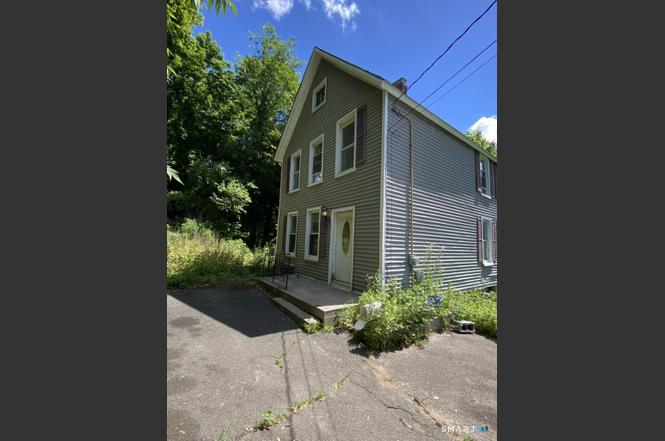
14 Brown Pl · New Haven, CT
Flood risk 5/10 · Moderate
- FEMA flood zone
- X (unshaded)
- Chance of flooding over 30 yrs
- 0.24%
- Est. flood insurance / yr
- $473 – $860
Fire risk 1/10 · Minimal
- Est. fire insurance / yr
- $829 – $1,539
Heat risk 7/10 · Major
- Hot days now (above 99°F)
- 7 days/yr
- Hot days in 30 yrs
- 16 days/yr
Wind risk 6/10 · Moderate
- Chance of severe wind over 30 yrs
- 61.0%
Air-quality risk 5/10 · Moderate
- Unhealthy air days now
- 6 days/yr
- Unhealthy air days in 30 yrs
- 8 days/yr
Risk factors via First Street. Map © Google.
Why this score? — see what drove the D+ grade
The composite is a weighted blend of 9 inputs, each scored 0–100. Each bar is that input's sub-score; the figure is the points it added to the 100-point composite (weight × sub-score).
- ARV discount +15.0/15.0
- Cash flow +14.2/30.0
- 1% rule +4.4/10.0
- DSCR +4.3/10.0
- Livability +4.0/5.0
- Rent growth +2.7/5.0
- Condition / age +2.5/5.0
- Schools +1.5/10.0
- Appreciation +0.0/10.0
$239,000
🖨 Deal sheet (PDF) 📄 Offer letter ✓ Due diligence
Listing remarks
Discover the charm of this inviting 3-bedroom, 2-bath home nestled in a convenient New Haven location. Bright and welcoming, this residence offers comfortable living spaces with abundant natural light and a practical layout designed for everyday living. The spacious bedrooms provide flexibility for family, guests, or a home office, while the two full bathrooms add convenience and functionality. Outside, enjoy a private yard with plenty of space for relaxing, entertaining, or gardening. Ideally situated near parks, shopping, dining, schools, and major commuter routes, this home offers a wonderful blend of comfort and convenience. Don't miss this opportunity to make it your own!
Key facts
- Private yard
- Convenient location
- 3,920 sq ft lot
Tags
Property features AI
Exterior
- Utilities: Public water (in street); Public sewer (in street)
- Home design: Single-family home
- Construction: Frame construction; Concrete foundation
- Exterior features: Lightly wooded lot; Vinyl siding; Asphalt shingle roof
Interior
- Bedrooms: 3 bedrooms
- Bathrooms: 2 full bathrooms
- Heating & cooling: Hot air heating; Oil-fired heat (tank located in basement); Ceiling fan cooling
- Interior features: Ceiling fans; Partial, unfinished basement; Walk-up attic
Neighborhood map
What this means for you Summary
Snapshot
- This is a 3-bed/1.0-bath single-family listed at $239k.
Deal economics
- At list price, monthly cash flow is $38 ($456/yr) — positive.
- The deal already cash-flows at list — no discount required.
- To meet the 1% rule (rent ≥ 1% of price), the offer needs to be $225k (5.8% below list).
- Recommended offer: $225k (5.8% below list) — sets the bar for 1% rule.
- Cap rate 6.5% vs local median 4.8% in New Haven — top-decile yield for the area; either an underpriced asset or a hidden risk that comps aren't pricing in. Stress-test before assuming the spread holds.
Location & tenants
- Location reads 79/100 on livability (#31 in CT, #2,190 nationally) — a middle-class / working-renter tenant base. Strengths: amenities A+, commute A+, health & safety A+; Watch: employment D, crime F.
- New Haven School District (urban): math 12% / reading 25% proficiency, ranked #147 of 153 in CT (top 96%) — low school quality limits family demand, transient renter base, plan for 1-2y turnover; 66% free/reduced lunch — lower-income household profile, screen leases tightly.
- Zoned schools: Betsy Ross Arts Magnet School (math 12% / reading 27%, grade F, #161 of 175 statewide, top 93%, 327 students, 70% FRL) — zoned schools at 70% FRL track the district average.
- Market conditions: Rents flat; 104 active listings in the ZIP; 40 comparable units currently listed for rent nearby; rentals at typical pace (median 25d on market — plan ~3-4 weeks tenant-placement turnaround); solid renter incomes; 1,059 units permitted in South Central Connecticut Planning Region in 2024 (779 in 5+ unit buildings).
Forward outlook
- Local home prices are declining (-3.0%/yr); year-one equity from $2k of loan paydown is wiped out by about $7k of value loss. Plan a longer hold.
Negotiation context
- Only 3 days on market — expect competitive offers; lowballing is unlikely to land.
Risks & watch-outs
- Watch-outs: built in 1890 — expect roof / HVAC / electrical / plumbing capex.
- Climate carrying-cost: moderate flood risk; major wind risk, 61% chance of damaging wind over 30y; extreme-heat days projected 7→16/yr by 2055 (HVAC capex compounding) — expect insurance premiums to compound above CPI over the hold.
Questions for the listing agent
- Built in 1890 — when were the roof, HVAC, electrical panel, plumbing, and water heater last replaced?
- Is there a deadline driving the sale (1031 exchange, divorce, estate, relocation)? That informs how much negotiation room exists.
- Schools are D-rated, which usually means shorter tenancies and higher turnover. Who's the typical renter profile here, and what's been the actual vacancy rate?
- Crime grade is F in this area — have there been break-ins, vandalism, or insurance claims at this property in the last 3 years? What carrier currently insures it and at what premium?
- The area grade is low — what's the realistic commute time and amenity access for the typical tenant pool here? Any planned neighborhood developments (good or bad) we should know about?
- What's the average days-on-market for RENTAL listings here right now (not sales)? A rising rental-DOM trend means longer vacancies and softer asking-rent achievability than the comps imply.
- What's the recent tenant-quality profile in this submarket — average credit score on applications, eviction rate, late-payment / NSF rate, and stable-employment percentage? A property-management company in the area should have these aggregated.
- How much new for-sale + rental construction is in the pipeline within 1–3 miles? Heavy new supply typically softens prices + rents 12–24 months out; constrained supply supports both.
Investment metrics
- 1% rule
- 0.94% ✗
- Cap rate
- 6.48%
- Cash-on-cash
- 0.68%
- DSCR
- 1.03
- GRM
- 8.8
CMA / ARV
- ARV (on-the-fly)
- $328,320
- Comps found
- 12
Show comp detail 12 sales within ~0.75 mi
| Address | Dist | Beds/Ba | Sqft | Sold | Price | $/sf | Match |
|---|---|---|---|---|---|---|---|
| 710 Woodward Ave | 0.20mi | 3/1.5 | 1,396 (-3%) | 16mo | $380,000 | $272 | 70 |
| 20 Ashland Pl | 0.18mi | 3/1.5 | 1,284 (-11%) | 1mo | $290,000 | $226 | 70 |
| 125 Oakley St | 0.33mi | 3/1.5 | 1,526 (+6%) | 12mo | $355,000 | $233 | 63 |
| 39 Irvington St | 0.22mi | 3/2.0 | 1,251 (-13%) | 3mo | $329,000 | $263 | 61 |
| 197 Beacon Ave | 0.29mi | 3/1.0 | 1,374 (-5%) | 23mo | $290,000 | $211 | 60 |
| 259 Elaine Ter | 0.31mi | 3/1.5 | 1,224 (-15%) | 3mo | $370,000 | $302 | 56 |
| 112 Harrington Ave | 0.58mi | 2/1.5 (-1) | 1,388 (-4%) | 6mo | $280,000 | $202 | 55 |
| 1025 Townsend Ave | 0.45mi | 4/1.5 (+1) | 1,555 (+8%) | 13mo | $230,000 | $148 | 48 |
| 79 Crofton St | 0.38mi | 3/2.5 | 1,544 (+7%) | 23mo | $352,000 | $228 | 45 |
| 66 Boston Ave | 0.64mi | 3/2.0 | 1,540 (+7%) | 15mo | $345,000 | $224 | 42 |
| 183 Farren Ave | 0.59mi | 3/1.0 | 1,295 (-10%) | 22mo | $225,000 | $174 | 37 |
| 30 Boston Ave | 0.67mi | 3/1.5 | 1,286 (-11%) | 24mo | $340,000 | $264 | 29 |
Match score weights: distance 35% · size 25% · config 20% · recency 20%. Top-matched comps best support the ARV.
Projected returns pro-forma
-3.0% appreciation · 0.79% rent growth · sell at horizon
- IRR
- -17.8%
- Equity multiple
- 0.39×
- Total profit
- $-41,116
- Equity at exit
- $35,636
- IRR
- -15.1%
- Equity multiple
- 0.23×
- Total profit
- $-51,554
- Equity at exit
- $20,664
Cash invested: $66,920 (down + closing). Projections, not guarantees.
Landlord ↔ Tenant lean methodology
- Overall (STATE)
- 27 Tenant-Leaning
- State Connecticut
- 27 Tenant-Leaning · D+7
- County
- — inherits STATE
- City
- — inherits STATE
ZIP-level market 06512
- Rents YoY
- 0.8%
- Active inventory
- 104
- Price-to-rent
- 8.8×
Monthly cashflow live
- Estimated rent
- $2,252 high interval (Pro) →
- Mortgage (P&I)
- −$1,253
- Tax from tax record
- −$388 /mo · $4,653/yr
- Insurance
- −$100
- HOA
- −$0
- Vacancy / Maint / Mgmt
- −$473
- Net cashflow
- $38
Break-even live
Sensitivity live
| Price | -10% $173 | -5% $106 | +0% $38 | +5% $-30 | +10% $-97 |
|---|---|---|---|---|---|
| Rent | -10% $-140 | -5% $-51 | +0% $38 | +5% $127 | +10% $216 |
| Rate | -1.0pp $158 | -0.5pp $99 | base $38 | +0.5pp $-24 | +1.0pp $-87 |
UW: 25.0% down · 7.5% · 30yr · 1.5% tax · 5.0% vac · 8.0% maint · 8.0% mgmt
Financing live
Cash to close
- Down payment
- $59,750
- Closing costs
- $7,170
- Reserves months
- —
- Total cash needed
- —
Loan-product check · same deal, 3 products live
Conventional
25% down · 7.5% · 30yr
- Down + closing
- —
- Monthly P&I
- —
- Monthly cashflow
- —
- DSCR
- —
- Eligible?
- —
Personal DTI + credit; lowest rate.
DSCR
20% down · 8.5% · 30yr
- Down + closing
- —
- Monthly P&I
- —
- Monthly cashflow
- —
- DSCR
- —
- Eligible?
- —
No personal income docs; deal must DSCR.
Hard money
10% down · 12.0% · 12mo
- Down + closing
- —
- Monthly P&I
- —
- Monthly cashflow
- —
- DSCR
- —
- Eligible?
- —
Short-term bridge; refi at stabilization.
Rent comps 40 comps
| Address | Beds | Baths | Sqft | Rent | $/sqft | DOM | Units | Dist |
|---|---|---|---|---|---|---|---|---|
| 22 Chamberlain St #22 New Haven, CT | 2.0 | 1.5 | 990 | $1,950 | $1.97 | 25d | 1 | 0.20mi |
| 35 Main Street Anx New Haven, CT | 2.0 | 1.0 | 1000 | $1,650 | $1.65 | 5d | 1 | 0.26mi |
| 1082 Townsend Ave Unit 1st Floor New Haven, CT | 2.0 | 1.0 | 1148 | $1,800 | $1.57 | 46d | 1 | 0.34mi |
| 43 Farren Ave Unit 1 New Haven, CT | 2.0 | 1.0 | 968 | $1,900 | $1.96 | 23d | 1 | 0.35mi |
| 75 Hillside Ave New Haven, CT | 3.0 | 1.0 | 1200 | $2,000 | $1.67 | 16d | 1 | 0.47mi |
| 181 Fairmont Ave New Haven, CT | 2.0 | 1.0 | 1380 | $2,700 | $1.96 | 21d | 1 | 0.50mi |
| 210 Burwell St New Haven, CT | 2.0 | 1.0 | 900 | $1,800 | $2.00 | 16d | 1 | 0.50mi |
| 241 Quinnipiac Ave New Haven, CT | 2.0 | 1.5 | 900 | $1,995 | $2.22 | 45d | 1 | 0.51mi |
| 25 Pardee St Unit 2nd Floor New Haven, CT | 3.0 | 1.0 | 980 | $1,900 | $1.94 | 45d | 1 | 0.51mi |
| 139 Farren Ave New Haven, CT | 2.0 | 1.0 | 1500 | $1,700 | $1.13 | 46d | 1 | 0.52mi |
| 509 Woodward Ave Unit 509-C New Haven, CT | 2.0 | 1.0 | 1440 | $2,250 | $1.56 | 4d | 1 | 0.58mi |
| 112 Harrington Ave New Haven, CT | 4.0 | 1.5 | 1388 | $3,300 | $2.38 | 4d | 1 | 0.59mi |
| 173 Farren Ave New Haven, CT | 3.0 | 1.0 | 875 | $1,850 | $2.11 | 4d | 1 | 0.59mi |
| 258 Fairmont Ave Unit 258 New Haven, CT | 2.0 | 1.5 | 1000 | $1,895 | $1.90 | 25d | 1 | 0.64mi |
| 37 Elizabeth Ann Dr New Haven, CT | 2.0 | 1.0 | 1617 | $2,000 | $1.24 | 25d | 1 | 0.78mi |
| 121 Lexington Ave #11 New Haven, CT | 2.0 | 1.5 | 936 | $2,000 | $2.14 | 16d | 1 | 0.84mi |
| 453 Quinnipiac Ave Unit 2 New Haven, CT | 3.0 | 1.0 | 1232 | $1,850 | $1.50 | 25d | 1 | 0.87mi |
| 76 Revere St Unit 2L New Haven, CT | 2.0 | 1.0 | 880 | $1,750 | $1.99 | 5d | 1 | 0.89mi |
| 76 Revere St Unit 2R New Haven, CT | 2.0 | 1.0 | 1000 | $1,850 | $1.85 | 25d | 1 | 0.89mi |
| 37 E Pearl St New Haven, CT | 3.0 | 1.0 | 1600 | $2,595 | $1.62 | 45d | 1 | 0.97mi |
| 132 Saltonstall Ave Unit 3 New Haven, CT | 3.0 | 1.0 | 1160 | $1,850 | $1.59 | 16d | 1 | 0.97mi |
| 34 Wolcott St #3 New Haven, CT | 3.0 | 1.0 | 1115 | $1,700 | $1.52 | 25d | 1 | 1.05mi |
| 114 Kneeland Rd New Haven, CT | 3.0 | 1.0 | 1800 | $2,900 | $1.61 | 45d | 1 | 1.07mi |
| 187 Wolcott St Unit 2 New Haven, CT | 4.0 | 2.0 | 906 | $2,400 | $2.65 | 5d | 1 | 1.10mi |
| 55 Pierpont St Unit 1 New Haven, CT | 3.0 | 1.0 | 1014 | $2,100 | $2.07 | 23d | 1 | 1.13mi |
| 55 Pierpont St Unit 1 New Haven, CT | 3.0 | 1.0 | 1014 | $2,100 | $2.07 | 25d | 1 | 1.13mi |
| 38 Hervey St New Haven, CT | 3.0 | 1.5 | 1450 | $3,400 | $2.34 | 23d | 1 | 1.15mi |
| 342 Exchange St Unit 2 New Haven, CT | 3.0 | 2.0 | 1200 | $2,300 | $1.92 | 45d | 1 | 1.15mi |
| 72 Woolsey St Unit 2 New Haven, CT | 4.0 | 1.0 | 1033 | $2,200 | $2.13 | 45d | 1 | 1.19mi |
| 40 Exchange St Unit 2 New Haven, CT | 3.0 | 1.0 | 1000 | $2,050 | $2.05 | 45d | 1 | 1.20mi |
| 651 Quinnipiac Ave Unit 2 New Haven, CT | 3.0 | 1.0 | 1355 | $1,975 | $1.46 | 45d | 1 | 1.24mi |
| 101 Laurel St East Haven, CT | 3.0 | 1.0 | 1196 | $3,000 | $2.51 | 45d | 1 | 1.25mi |
| 330 Fort Hale Rd New Haven, CT | 2.0 | 1.0 | 1140 | $2,200 | $1.93 | 16d | 1 | 1.29mi |
| 111 Fort Hale Rd New Haven, CT | 3.0 | 2.0 | 1126 | $3,200 | $2.84 | 45d | 1 | 1.30mi |
| 30 Bright St Unit 2 New Haven, CT | 3.0 | 2.0 | 993 | $2,000 | $2.01 | 45d | 1 | 1.30mi |
| 20 Maltby Pl New Haven, CT | 3.0 | 1.0 | 1100 | $1,900 | $1.73 | 5d | 1 | 1.31mi |
| 262 Lloyd St Unit 1 New Haven, CT | 3.0 | 2.0 | 1460 | $2,400 | $1.64 | 5d | 1 | 1.32mi |
| 57 Elm St East Haven, CT | 3.0 | 2.5 | 1390 | $3,700 | $2.66 | 4d | 1 | 1.33mi |
| 23 Brown St New Haven, CT | 3.0 | 2.0 | 1350 | $2,650 | $1.96 | 5d | 1 | 1.38mi |
| 23 Brown St Unit 3 New Haven, CT | 3.0 | 1.0 | 1300 | $2,650 | $2.04 | 16d | 1 | 1.38mi |
Listing history 3 events
-
2026-06-21days on market $239,000 Active 3 DOM
-
2026-06-18remarks 685-char remark
-
2026-06-18$239,000 Active 1 DOM
ⓘ Source: listings_history table (triggers on properties + properties_extension) + one-shot
backfill from property_details.listing_events for pre-trigger history.
Tax reassessment forecast CT · Partial reset (capped growth)
- Current annual tax
- $4,653 · $388/mo
- Projected year-2 tax
- $4,884 · $407/mo
- Expected delta
- +$231/yr (+$19/mo · 5.0%)
ⓘ Screening estimate from a state-policy table — verify with the county assessor before closing.
Climate risk First Street
- Flood 5/10 Major FEMA zone X (unshaded) · 24% chance over 30 yrs
- Wildfire 1/10 Low
- Heat 7/10 Severe 7 d/yr ≥99°F today · 16 d/yr by 30 yrs out
- Wind 6/10 Major 61% chance of damaging wind over 30 yrs
- Air quality 5/10 Major 6 unhealthy d/yr today · 8 by 30 yrs out
Nearby sold comps map
Loading sold comps map…
Walkable amenities ~0.75 mi
Loading nearby amenities…
Taxation est. · year 1
- Rental income
- $27,018
- − Mortgage interest
- −$13,388
- − Property taxes
- −$4,653
- − Insurance
- −$1,195
- − Repairs & maintenance
- −$2,161
- − Management
- −$2,161
- − Depreciation
- −$6,953
- Taxable loss
- −$3,493
- Est. tax savings @ 24.0%
- +$838
- After-tax cash flow
- $1,295/yr
For passive investors: Depreciation is non-cash, so a rental often shows a tax loss while cash-flowing — sheltering income. Rental losses are passive: they offset passive income freely, and up to $25,000/yr can offset ordinary (W-2) income if you actively participate and your MAGI is under $100k (phasing out to $0 by $150k); unused losses carry forward. On sale, claimed depreciation is recaptured at up to 25%, and gains may owe capital-gains tax (a 1031 exchange can defer both). Figures are a year-1 estimate at your 24.0% rate — not tax advice; consult a CPA.
Schools (NCES district)
- District
- New Haven School District
- NCES district ID
- 0902790
- Math proficiency
- 12% ▼ -10.00%
- Reading proficiency
- 25% ▼ -10.00%
- Median HH income
- $38,058
- Composite
- 15.48/100
- National rank
- #9308
- State rank
- #147 of 153 in CT
Livability — New Haven
- Score
- 79/100
- State rank
- #31
- US rank
- #2190
Category grades
Schools grade is shown separately in the Schools card above.
Census & demographics
- Census place
- New Haven, CT
- County
- New Haven County · 688,236 people
- City population
- 132,813
- Metro
- New Haven-Milford, CT
- Population (ZIP)
- 28,830
- Household income
- $96,146
- Rent vs Own
- Severe rent burden
- 770.0
Population outlook (South Central Connecticut County) Hauer SSP2
- By 2040
- 608,362
Race, ethnicity, and origin ACS 2023
- Neighborhood character
- Predominantly White (68%)
- Race & ethnicity
- White 68% Hispanic / Latino 19% Two or more races 9% Black 6% Asian 3%
- Hispanic origin (detail)
- Mexican 1% Puerto Rican 8%
- Common ancestry
- Romanian 5% Lithuanian 2% Russian 1%
- Foreign-born
- 12% · Canada, China, Jamaica
- Languages at home
- 81% English-only · Spanish 12% Other Indo-European 3% Other Asian/Pacific 1%
Political lean MEDSL · South Central Connecticut
- 2024 margin
- Strong D (+20.1) · D 59.0% · R 38.9% · Other 2.1%
- All cycles
- 2024: D+20.1
Not yet ingested
- Civics
- —
Market trends
- HPI YoY
- ▼ -302.63%
- Current HPI
- 302.2679
- Rent YoY
- ▲ 0.79%
- Metro
- New Haven-Milford, CT
- State GDP YoY
- ▲ 1.06%
- F500 in state
- 38
Industry mix (Fortune 500 HQ in CT)
| Industry | F500 HQs | Revenue |
|---|---|---|
| Industrial Machinery | 4 | $38B |
|
||
| Insurance | 3 | $71B |
|
||
| Financial Services | 2 | $25B |
|
||
| Transportation / Logistics | 2 | $18B |
|
||
| Healthcare | 1 | $247B |
|
||
| Telecommunications | 1 | $55B |
|
||
Price history
1 event — show timeline
- 2026-06-18 Listed $239,000 Smart MLS
Property tax history
+1.2%/yrLatest (2023): $4,653 · -6.4% YoY. Source: county tax records.
Cash-flow waterfall
monthlySold comps — $/sqft
last 12 mo · ≤1 miLoading sold comps…