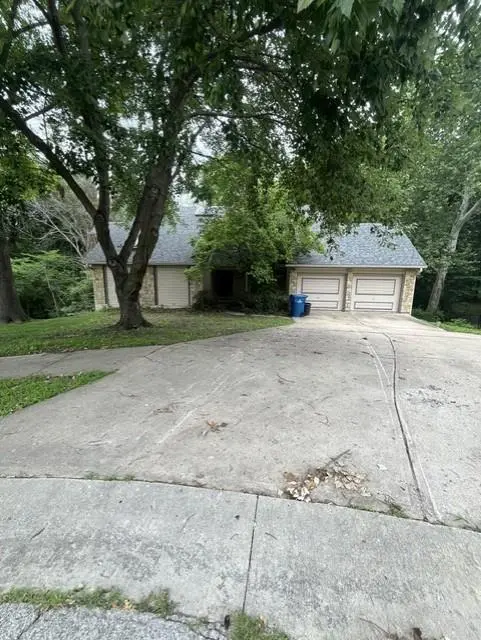
4440 NW Wildwood Dr · Gladstone, MO
Flood risk 8/10 · Major
- FEMA flood zone
- X (unshaded)
- Chance of flooding over 30 yrs
- 0.98%
- Est. flood insurance / yr
- $473 – $860
Fire risk 1/10 · Minimal
- Est. fire insurance / yr
- $1,054 – $1,958
Heat risk 4/10 · Minor
- Hot days now (above 107°F)
- 7 days/yr
- Hot days in 30 yrs
- 17 days/yr
Wind risk 2/10 · Minimal
- Chance of severe wind over 30 yrs
- —
Air-quality risk 3/10 · Minor
- Unhealthy air days now
- 2 days/yr
- Unhealthy air days in 30 yrs
- 3 days/yr
Risk factors via First Street. Map © Google.
Why this score? — see what drove the C- grade
The composite is a weighted blend of 9 inputs, each scored 0–100. Each bar is that input's sub-score; the figure is the points it added to the 100-point composite (weight × sub-score).
- ARV discount +15.0/15.0
- Cash flow +14.2/30.0
- DSCR +4.3/10.0
- 1% rule +4.1/10.0
- Schools +3.8/10.0
- Livability +3.8/5.0
- Rent growth +3.7/5.0
- Condition / age +2.5/5.0
- Appreciation +0.0/10.0
$230,000
🖨 Deal sheet (PDF) 📄 Offer letter ✓ Due diligence
Listing remarks
INVESTOR OPPORTUNITY! This 1.5-story home offers 4 bedrooms, 3.5 baths, and a finished lower level, providing plenty of square footage and potential for the right buyer. Whether you're looking for your next renovation project, investment property, or opportunity to build equity, this home is ready for your vision and updates. Property is being sold AS IS. Seller will make NO repairs, improvements, or concessions. Buyers are encouraged to conduct any desired inspections for informational purposes only. Don't miss this chance to unlock the potential of this property and make it your next successful investment. Roof is 2 years old and hot water heater is 1 year old.
Key facts
- 0.51 acre lot
- 2 garage spots
- Built 1984
Property features AI
Exterior
- Parking: Attached 2-car garage
- Utilities: Public water; Public sewer
- Home design: Single family residence; Residential property; 1.5-story floor plan; Living area approximately 3,345
- Construction: Wood siding with stone trim; Composition roof; Built approximately 41–50 years ago; Finished below-grade living area (estimated)
- Exterior features: Deck; Located on a cul-de-sac; Public road maintenance
Interior
- Kitchen: Breakfast area; Formal dining area
- Bedrooms: 4 bedrooms (includes main floor primary bedroom)
- Bathrooms: 3 full baths; 1 half bath
- Heating & cooling: Natural gas heating; Electric cooling
- Interior features: Finished basement with walk-out access; Main floor bedroom; Main floor primary bedroom; Breakfast area and formal dining
- Laundry & utility: Main level laundry
Neighborhood map
What this means for you Summary
Snapshot
- This is a 4-bed/3.0-bath single-family listed at $230k.
Deal economics
- At list price, monthly cash flow is $-17 ($-204/yr) — negative.
- To cash-flow at today's rent, offer at most $227k (1.3% below list).
- To meet the 1% rule (rent ≥ 1% of price), the offer needs to be $208k (9.5% below list).
- Recommended offer: $208k (9.5% below list) — sets the bar for 1% rule.
- Cap rate 6.5% vs local median 4.5% in Gladstone — top-decile yield for the area; either an underpriced asset or a hidden risk that comps aren't pricing in. Stress-test before assuming the spread holds.
Location & tenants
- Location reads 76/100 on livability (#44 in MO, #3,612 nationally) — a middle-class / working-renter tenant base. Strengths: cost of living A+, housing A+, health & safety A+; Watch: crime C-, amenities F, commute F.
- North Kansas City 74 (urban): math 38% / reading 49% proficiency, ranked #98 of 324 in MO (top 30%) — families likely to look elsewhere, expect single-tenant / working-renter base with shorter leases.
- Zoned schools: Briarcliff Elementary (math 42% / reading 52%, grade D-, #347 of 1,115 statewide, top 35%, 310 students, 46% FRL); Northgate Middle (math 25% / reading 37%, grade F, #279 of 391 statewide, top 72%, 689 students, 63% FRL); North Kansas City High (math 14% / reading 37%, grade F, #433 of 521 statewide, top 83%, 1,640 students, 55% FRL) — zoned schools average 55% FRL vs 37% district-wide (17 pts higher); higher-poverty schools than district average — tighter screening recommended.
- Market conditions: Rents rising fast (+4.7%/yr); 87 active listings in the ZIP; 3 comparable units currently listed for rent nearby; rentals at typical pace (median 26d on market — plan ~3-4 weeks tenant-placement turnaround); 341 units permitted in Clay County in 2024 (40 in 5+ unit buildings).
- This rent runs 39% of the median local income ($64k/yr) — at the standard rent-burdened threshold; future hikes will face affordability resistance.
Forward outlook
- Local home prices are declining (-3.0%/yr); year-one equity from $2k of loan paydown is wiped out by about $7k of value loss. Plan a longer hold.
- Clay County population projected at +24% by 2050 — long-run rental-demand tailwind backs the buy-and-hold thesis.
Negotiation context
- Only 3 days on market — expect competitive offers; lowballing is unlikely to land.
Risks & watch-outs
- Watch-outs: flood insurance adds $56/mo.
- Climate carrying-cost: severe flood risk — expect insurance premiums to compound above CPI over the hold.
Questions for the listing agent
- What do current leases actually rent for vs. the listed asking? Can we see a recent rent roll and the last 12 months of T-12 income?
- What's the actual annual flood-insurance premium (NFIP or private), and is the property in a SFHA with mandatory coverage?
- Is there a deadline driving the sale (1031 exchange, divorce, estate, relocation)? That informs how much negotiation room exists.
- What's the average days-on-market for RENTAL listings here right now (not sales)? A rising rental-DOM trend means longer vacancies and softer asking-rent achievability than the comps imply.
- What's the recent tenant-quality profile in this submarket — average credit score on applications, eviction rate, late-payment / NSF rate, and stable-employment percentage? A property-management company in the area should have these aggregated.
- How much new for-sale + rental construction is in the pipeline within 1–3 miles? Heavy new supply typically softens prices + rents 12–24 months out; constrained supply supports both.
Investment metrics
- 1% rule
- 0.91% ✗
- Cap rate
- 6.49%
- Cash-on-cash
- 0.72%
- DSCR
- 1.03
- GRM
- 9.2
CMA / ARV
- ARV (on-the-fly)
- $339,480
- Comps found
- 12
Show comp detail 12 sales within ~0.75 mi
| Address | Dist | Beds/Ba | Sqft | Sold | Price | $/sf | Match |
|---|---|---|---|---|---|---|---|
| 1 NE Normandy Ln | 0.37mi | 4/3.0 | 1,899 (+3%) | 8mo | $349,000 | $184 | 72 |
| 5017 N Washington St | 0.57mi | 4/2.5 | 1,852 (+0%) | 1mo | $435,000 | $235 | 70 |
| 102 NE Briarcliff Rd | 0.59mi | 3/3.0 (-1) | 1,812 (-2%) | 4mo | $355,000 | $196 | 61 |
| 17 NW 43rd St | 0.46mi | 3/2.0 (-1) | 1,828 (-1%) | 9mo | $350,000 | $191 | 61 |
| 4932 N Washington St | 0.50mi | 3/2.5 (-1) | 1,863 (+1%) | 14mo | $350,000 | $188 | 56 |
| 214 NW 43rd Ter | 0.29mi | 3/3.0 (-1) | 2,112 (+14%) | 12mo | $330,000 | $156 | 47 |
| 106 NE Northcrest Dr | 0.66mi | 4/2.0 | 1,986 (+8%) | 8mo | $300,000 | $151 | 46 |
| 17 Briarcliff Rd | 0.62mi | 3/2.0 (-1) | 1,686 (-9%) | 3mo | $340,000 | $202 | 45 |
| 4126 NW Willow Dr | 0.54mi | 3/2.0 (-1) | 1,700 (-8%) | 13mo | $300,000 | $176 | 42 |
| 312 NE Northcrest Dr | 0.75mi | 3/2.0 (-1) | 1,884 (+2%) | 24mo | $295,000 | $157 | 33 |
| 605 NW 40th Ter | 0.72mi | 3/2.5 (-1) | 1,720 (-7%) | 22mo | $260,000 | $151 | 30 |
| 128 NE Briarcliff Rd | 0.64mi | 3/2.0 (-1) | 1,988 (+8%) | 24mo | $275,000 | $138 | 28 |
Match score weights: distance 35% · size 25% · config 20% · recency 20%. Top-matched comps best support the ARV.
Projected returns pro-forma
-3.0% appreciation · 4.74% rent growth · sell at horizon
- IRR
- -14.8%
- Equity multiple
- 0.46×
- Total profit
- $-34,569
- Equity at exit
- $34,294
- IRR
- -3.3%
- Equity multiple
- 0.76×
- Total profit
- $-15,418
- Equity at exit
- $19,886
Cash invested: $64,400 (down + closing). Projections, not guarantees.
Landlord ↔ Tenant lean methodology
- Overall (STATE)
- 81 Strongly Landlord-Friendly
- State Missouri
- 81 Strongly Landlord-Friendly · R+10
- County
- — inherits STATE
- City
- — inherits STATE
ZIP-level market 64116
- Rents YoY
- 4.7%
- Active inventory
- 87
- Price-to-rent
- 9.2×
Monthly cashflow live
- Estimated rent
- $2,083 medium interval (Pro) →
- Mortgage (P&I)
- −$1,206
- Tax from tax record
- −$305 /mo · $3,658/yr
- Insurance
- −$96
- Flood insurance flood zone
- −$56 /mo · $666/yr
- HOA
- −$0
- Vacancy / Maint / Mgmt
- −$437
- Net cashflow
- $-17
Break-even live
Sensitivity live
| Price | -10% $113 | -5% $48 | +0% $-17 | +5% $-82 | +10% $-147 |
|---|---|---|---|---|---|
| Rent | -10% $-182 | -5% $-99 | +0% $-17 | +5% $65 | +10% $147 |
| Rate | -1.0pp $99 | -0.5pp $41 | base $-17 | +0.5pp $-77 | +1.0pp $-137 |
UW: 25.0% down · 7.5% · 30yr · 1.5% tax · 5.0% vac · 8.0% maint · 8.0% mgmt
Financing live
Cash to close
- Down payment
- $57,500
- Closing costs
- $6,900
- Reserves months
- —
- Total cash needed
- —
Loan-product check · same deal, 3 products live
Conventional
25% down · 7.5% · 30yr
- Down + closing
- —
- Monthly P&I
- —
- Monthly cashflow
- —
- DSCR
- —
- Eligible?
- —
Personal DTI + credit; lowest rate.
DSCR
20% down · 8.5% · 30yr
- Down + closing
- —
- Monthly P&I
- —
- Monthly cashflow
- —
- DSCR
- —
- Eligible?
- —
No personal income docs; deal must DSCR.
Hard money
10% down · 12.0% · 12mo
- Down + closing
- —
- Monthly P&I
- —
- Monthly cashflow
- —
- DSCR
- —
- Eligible?
- —
Short-term bridge; refi at stabilization.
Rent comps 3 comps
| Address | Beds | Baths | Sqft | Rent | $/sqft | DOM | Units | Dist |
|---|---|---|---|---|---|---|---|---|
| 5000 N Jefferson St Kansas City, MO | 4.0 | 2.5 | 2438 | $2,750 | $1.13 | 25d | 1 | 0.46mi |
| 5000 N Oak Trfy Kansas City, MO | 3.0 | 1.0–2.0 | 1225 | $1,340 | $1.09 | 45d | 1 | 0.61mi |
| 531 NE 45th St Kansas City, MO | 3.0 | 2.0 | 1886 | $1,700 | $0.90 | 4d | 1 | 0.70mi |
Listing history 10 events
-
2026-06-22status $230,000 Pending 3 DOM
-
2026-06-21statusdays on market $230,000 Active 3 DOM
-
2026-06-19remarks 671-char remark
-
2026-06-18days on market $230,000 Coming Soon 8 DOM
-
2026-06-17days on market $230,000 Coming Soon 7 DOM
-
2026-06-16days on market $230,000 Coming Soon 6 DOM
-
2026-06-15days on market $230,000 Coming Soon 5 DOM
-
2026-06-13days on market $230,000 Coming Soon 3 DOM
-
2026-06-13remarks 624-char remark
-
2026-06-13$230,000 Coming Soon 2 DOM
ⓘ Source: listings_history table (triggers on properties + properties_extension) + one-shot
backfill from property_details.listing_events for pre-trigger history.
Tax reassessment forecast MO · Resets to sale price
- Current annual tax
- $3,658 · $305/mo
- Projected year-2 tax
- $3,658 · $305/mo
- Expected delta
- $0/yr ($0/mo · -0.0%)
ⓘ Screening estimate from a state-policy table — verify with the county assessor before closing.
Climate risk First Street
- Flood 8/10 Severe FEMA zone X (unshaded) · 98% chance over 30 yrs
- Wildfire 1/10 Low
- Heat 4/10 Moderate 7 d/yr ≥107°F today · 17 d/yr by 30 yrs out
- Wind 2/10 Low
- Air quality 3/10 Moderate 2 unhealthy d/yr today · 3 by 30 yrs out
Nearby sold comps map
Loading sold comps map…
Walkable amenities ~0.75 mi
Loading nearby amenities…
Taxation est. · year 1
- Rental income
- $24,992
- − Mortgage interest
- −$12,884
- − Property taxes
- −$3,658
- − Insurance
- −$1,816
- − Repairs & maintenance
- −$1,999
- − Management
- −$1,999
- − Depreciation
- −$6,691
- Taxable loss
- −$4,056
- Est. tax savings @ 24.0%
- +$973
- After-tax cash flow
- $769/yr
For passive investors: Depreciation is non-cash, so a rental often shows a tax loss while cash-flowing — sheltering income. Rental losses are passive: they offset passive income freely, and up to $25,000/yr can offset ordinary (W-2) income if you actively participate and your MAGI is under $100k (phasing out to $0 by $150k); unused losses carry forward. On sale, claimed depreciation is recaptured at up to 25%, and gains may owe capital-gains tax (a 1031 exchange can defer both). Figures are a year-1 estimate at your 24.0% rate — not tax advice; consult a CPA.
Schools (NCES district)
- District
- North Kansas City 74
- NCES district ID
- 2922800
- Math proficiency
- 38% ▼ -11.00%
- Reading proficiency
- 49% ▼ -3.00%
- Median HH income
- $55,444
- Composite
- 37.88/100
- National rank
- #4321
- State rank
- #98 of 324 in MO
Livability — Gladstone
- Score
- 76/100
- State rank
- #44
- US rank
- #3612
Category grades
Schools grade is shown separately in the Schools card above.
Census & demographics
- Census place
- Gladstone, MO
- County
- Clay County · 220,651 people
- City population
- 41,984
- Metro
- Kansas City, MO-KS
- Population (ZIP)
- 18,046
- Household income
- $64,123
- Rent vs Own
- Severe rent burden
- 844.0
Population outlook (Clay County) Hauer SSP2
- Today (2025)
- 266,022 people
- By 2030
- 280,057 · +5.3%
- By 2040
- 306,153 · +15.1%
- By 2050
- 328,630 · +23.5%
- By 2075
- 375,182 · +41.0%
- By 2100
- 392,861 · +47.7%
Race, ethnicity, and origin ACS 2023
- Neighborhood character
- Diverse neighborhood (Simpson 0.57)
- Race & ethnicity
- White 63% Two or more races 15% Black 12% Hispanic / Latino 10% Asian 3%
- Hispanic origin (detail)
- Mexican 5% Puerto Rican 2%
- Common ancestry
- Italian 3% Serbian 2% Lithuanian 2%
- Foreign-born
- 8% · Canada, Vietnam, Jamaica
- Languages at home
- 91% English-only · Arabic 2% Spanish 2% Vietnamese 2%
Political lean MEDSL · Clay
- 2024 margin
- Lean R (+5.6) · D 46.4% · R 52.0% · Other 1.6%
- 2008→2024 swing
- -4.9pp toward R · 2008: -0.7pp · 2024: -5.6pp
- All cycles
- 2024: R+5.6 2020: R+4.1 2016: R+11.1 2012: R+8.4 2008: R+0.7
Not yet ingested
- Civics
- —
Market trends
- HPI YoY
- ▼ -180.14%
- Current HPI
- 256.6222
- Rent YoY
- ▲ 4.74%
- Metro
- Kansas City, MO-KS
- State GDP YoY
- ▲ 1.84%
- F500 in state
- 20
Industry mix (Fortune 500 HQ in MO)
| Industry | F500 HQs | Revenue |
|---|---|---|
| Healthcare | 1 | $163B |
|
||
| Insurance | 1 | $21B |
|
||
| Industrial Technology | 1 | $17B |
|
||
| Retail | 1 | $16B |
|
||
| Industrial Distribution | 1 | $10B |
|
||
| Utilities | 1 | $9B |
|
||
Price history
1 event — show timeline
- 2026-06-11 Coming Soon $230,000 Heartland MLS as Distributed by MLS Grid
Property tax history
+1.6%/yrLatest (2025): $3,658 · +5.8% YoY. Source: county tax records.
Cash-flow waterfall
monthlySold comps — $/sqft
last 12 mo · ≤1 miLoading sold comps…