5144 Castle Way · Portsmouth, VA
Flood risk 5/10 · Moderate
- FEMA flood zone
- X (unshaded)
- Chance of flooding over 30 yrs
- 0.47%
- Est. flood insurance / yr
- $507 – $1,088
Fire risk 1/10 · Minimal
- Est. fire insurance / yr
- $666 – $1,236
Heat risk 9/10 · Severe
- Hot days now (above 106°F)
- 7 days/yr
- Hot days in 30 yrs
- 16 days/yr
Wind risk 8/10 · Major
- Chance of severe wind over 30 yrs
- 80.0%
Air-quality risk 2/10 · Minimal
- Unhealthy air days now
- 1 days/yr
- Unhealthy air days in 30 yrs
- 3 days/yr
Risk factors via First Street. Map © Google.
Why this score? — see what drove the D- grade
The composite is a weighted blend of 9 inputs, each scored 0–100. Each bar is that input's sub-score; the figure is the points it added to the 100-point composite (weight × sub-score).
- Cash flow +13.1/30.0
- ARV discount +7.0/15.0
- DSCR +3.9/10.0
- Schools +3.9/10.0
- Livability +3.7/5.0
- 1% rule +3.3/10.0
- Rent growth +2.5/5.0
- Condition / age +2.5/5.0
- Appreciation +0.0/10.0
$200,000
🖨 Deal sheet (PDF) 📄 Offer letter ✓ Due diligence
Listing remarks
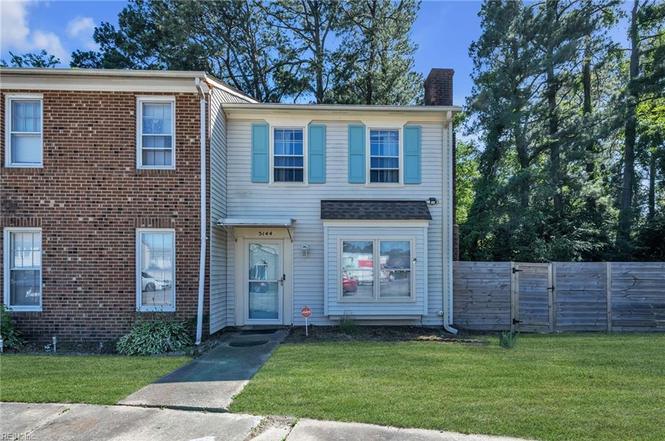
Discover easy living in this end-unit townhome located in the heart of Churchland. Tucked away near the Western Branch of the Elizabeth River, this home offers a peaceful setting with easy access to shopping, dining, and major conveniences. The private backyard patio overlooks a wooded backdrop, creating an ideal space to enjoy your morning coffee or unwind at the end of the day. Recent improvements include a newer roof installed in 2022, providing added value and peace of mind. Whether you're looking for your first home, a smart investment opportunity, or a low-maintenance lifestyle, this property offers it all! Don't miss your chance to make it yours—schedule a showing today.
Key facts
- Wooded backdrop
- Newer roof
- End-unit townhome
Tags
Property features AI
Finance
- HOA & community: No HOA/Condo fees indicated
Exterior
- Parking: 2 parking spaces
- Utilities: City/County water; City/County sewer; Electric water heater; Electric service
- Home design: Attached townhouse; End unit; 2 stories; 2 living levels; Slab foundation
- Construction: Brick and vinyl siding; Asphalt shingle roof
- Exterior features: Corner lot; Patio; Wooded setting; Partial privacy wood fence; Storage shed
Interior
- Kitchen: Electric range; Microwave; Dishwasher; Disposal; Refrigerator
- Bedrooms: Master bedroom; Additional bedroom
- Flooring: Carpet; Ceramic; Laminate
- Bathrooms: 1 full bathroom; 1 half bathroom; Dual-entry bath configuration
- Heating & cooling: Forced hot air heating; Heat pump; Central air conditioning
- Interior features: Ceiling fan; Cable hookup; Fireplace (wood); Dual-entry bath (between bedroom and hall); Walk-in closet; Attic; Breakfast area; Utility closet
- Laundry & utility: Washer (hookup provided); Dryer (hookup provided); Utility room
Neighborhood map
What this means for you Summary
Snapshot
- This is a 2-bed/1.5-bath townhouse listed at $200k.
Deal economics
- At list price, monthly cash flow is $-9 ($-109/yr) — negative.
- To cash-flow at today's rent, offer at most $198k (0.8% below list).
- To meet the 1% rule (rent ≥ 1% of price), the offer needs to be $166k (17.2% below list).
- Recommended offer: $166k (17.2% below list) — sets the bar for 1% rule.
- Cap rate 6.2% vs local median 4.6% in Portsmouth — top-decile yield for the area; either an underpriced asset or a hidden risk that comps aren't pricing in. Stress-test before assuming the spread holds.
Location & tenants
- Location reads 73/100 on livability (#172 in VA) — a middle-class / working-renter tenant base. Strengths: amenities A+, cost of living A+, housing A+; Watch: employment C-, crime F, commute F.
- Portsmouth City Public School District (urban): math 34% / reading 58% proficiency, ranked #107 of 131 in VA (top 82%) — families likely to look elsewhere, expect single-tenant / working-renter base with shorter leases.
- Zoned schools: Churchland Elementary (math 47% / reading 72%, grade B-, #536 of 1,108 statewide, top 51%, 767 students, 98% FRL); Churchland Middle (math 53% / reading 77%, grade A-, #120 of 342 statewide, top 35%, 890 students, 100% FRL); Churchland High (math 48% / reading 80%, grade B-, #220 of 319 statewide, top 70%, 1,435 students, 100% FRL) — zoned schools average 99% FRL vs 60% district-wide (39 pts higher); higher-poverty schools than district average — tighter screening recommended.
- Zoned-school proficiency averages 63% at this address vs 46% district-wide (+17 pts) — the actual schools serving this property are materially stronger than the Portsmouth City Public School District average implies; a family-tenant draw the district grade alone would hide.
- Market conditions: 124 active listings in the ZIP; 3 comparable units currently listed for rent nearby; rentals lingering (median 46d on market — plan ~5-8 weeks vacancy on turnover, expect pricing pressure); 67% of comp listings sitting > 30 days — soft ceiling on asking rent; solid renter incomes; 300 units permitted in Portsmouth city in 2024 (112 in 5+ unit buildings).
Forward outlook
- Local home prices are declining (-3.0%/yr); year-one equity from $1k of loan paydown is wiped out by about $6k of value loss. Plan a longer hold.
Negotiation context
- Only 10 days on market — expect competitive offers; lowballing is unlikely to land.
- 2 sale attempts since 2y ago with the ask held roughly flat each time — persistent listings suggest the price (not the market) is what's stuck; bring a comps-based counter.
Risks & watch-outs
- Climate carrying-cost: moderate flood risk; severe wind risk, 80% chance of damaging wind over 30y; extreme-heat days projected 7→16/yr by 2055 (HVAC capex compounding) — expect insurance premiums to compound above CPI over the hold.
Questions for the listing agent
- What do current leases actually rent for vs. the listed asking? Can we see a recent rent roll and the last 12 months of T-12 income?
- Is there a deadline driving the sale (1031 exchange, divorce, estate, relocation)? That informs how much negotiation room exists.
- Schools are B-rated — typically a magnet for longer-tenancy family renters. What's the average tenant stay here, and is there a school-zone premium baked into asking?
- Crime grade is F in this area — have there been break-ins, vandalism, or insurance claims at this property in the last 3 years? What carrier currently insures it and at what premium?
- The area grade is low — what's the realistic commute time and amenity access for the typical tenant pool here? Any planned neighborhood developments (good or bad) we should know about?
- What's the average days-on-market for RENTAL listings here right now (not sales)? A rising rental-DOM trend means longer vacancies and softer asking-rent achievability than the comps imply.
- What's the recent tenant-quality profile in this submarket — average credit score on applications, eviction rate, late-payment / NSF rate, and stable-employment percentage? A property-management company in the area should have these aggregated.
- How much new for-sale + rental construction is in the pipeline within 1–3 miles? Heavy new supply typically softens prices + rents 12–24 months out; constrained supply supports both.
Investment metrics
- 1% rule
- 0.83% ✗
- Cap rate
- 6.24%
- Cash-on-cash
- -0.19%
- DSCR
- 0.99
- GRM
- 10.1
CMA / ARV
- ARV (on-the-fly)
- $197,960
- Comps found
- 4
Show comp detail 4 sales within ~0.75 mi
| Address | Dist | Beds/Ba | Sqft | Sold | Price | $/sf | Match |
|---|---|---|---|---|---|---|---|
| 4011 Reese Dr S | 0.04mi | 2/1.5 | 980 (0%) | 7mo | $150,000 | $153 | 92 |
| 5101 Radcliffe Cir | 0.09mi | 2/1.0 | 875 (-11%) | 13mo | $199,500 | $228 | 65 |
| 4051 S Reese Dr | 0.11mi | 2/1.5 | 1,100 (+12%) | 12mo | $222,000 | $202 | 64 |
| 5220 Clover Hill Dr | 0.34mi | 2/1.5 | 1,122 (+14%) | 6mo | $203,000 | $181 | 55 |
Match score weights: distance 35% · size 25% · config 20% · recency 20%. Top-matched comps best support the ARV.
Projected returns pro-forma
-3.0% appreciation · 3.0% rent growth · sell at horizon
- IRR
- -16.6%
- Equity multiple
- 0.41×
- Total profit
- $-33,000
- Equity at exit
- $29,821
- IRR
- -8.4%
- Equity multiple
- 0.47×
- Total profit
- $-29,539
- Equity at exit
- $17,292
Cash invested: $56,000 (down + closing). Projections, not guarantees.
Landlord ↔ Tenant lean methodology
- Overall (STATE)
- 55 Moderately Landlord-Leaning
- State Virginia
- 55 Moderately Landlord-Leaning · D+2
- County
- — inherits STATE
- City
- — inherits STATE
ZIP-level market 23703
- Active inventory
- 124
- Price-to-rent
- 10.1×
Monthly cashflow live
- Estimated rent
- $1,655 medium interval (Pro) →
- Mortgage (P&I)
- −$1,049
- Tax from tax record
- −$185 /mo · $2,216/yr
- Insurance
- −$83
- HOA
- −$0
- Vacancy / Maint / Mgmt
- −$348
- Net cashflow
- $-9
Break-even live
Sensitivity live
| Price | -10% $104 | -5% $48 | +0% $-9 | +5% $-66 | +10% $-122 |
|---|---|---|---|---|---|
| Rent | -10% $-140 | -5% $-74 | +0% $-9 | +5% $56 | +10% $122 |
| Rate | -1.0pp $92 | -0.5pp $42 | base $-9 | +0.5pp $-61 | +1.0pp $-114 |
UW: 25.0% down · 7.5% · 30yr · 1.5% tax · 5.0% vac · 8.0% maint · 8.0% mgmt
Financing live
Cash to close
- Down payment
- $50,000
- Closing costs
- $6,000
- Reserves months
- —
- Total cash needed
- —
Loan-product check · same deal, 3 products live
Conventional
25% down · 7.5% · 30yr
- Down + closing
- —
- Monthly P&I
- —
- Monthly cashflow
- —
- DSCR
- —
- Eligible?
- —
Personal DTI + credit; lowest rate.
DSCR
20% down · 8.5% · 30yr
- Down + closing
- —
- Monthly P&I
- —
- Monthly cashflow
- —
- DSCR
- —
- Eligible?
- —
No personal income docs; deal must DSCR.
Hard money
10% down · 12.0% · 12mo
- Down + closing
- —
- Monthly P&I
- —
- Monthly cashflow
- —
- DSCR
- —
- Eligible?
- —
Short-term bridge; refi at stabilization.
Rent comps 3 comps
| Address | Beds | Baths | Sqft | Rent | $/sqft | DOM | Units | Dist |
|---|---|---|---|---|---|---|---|---|
| 4016 Reese Dr S Portsmouth, VA | 2.0 | 1.0 | 980 | $1,600 | $1.63 | 45d | 1 | 0.06mi |
| 3117 Sterling Point Dr Unit A Portsmouth, VA | 2.0 | 1.0 | 900 | $1,450 | $1.61 | 4d | 1 | 0.27mi |
| 5020 Fable Ave Portsmouth, VA | 3.0 | 1.0 | 1075 | $2,000 | $1.86 | 45d | 1 | 0.62mi |
Listing history 7 events
-
2026-06-21days on market $200,000 Active 10 DOM
-
2026-06-18days on market $200,000 Active 7 DOM
-
2026-06-17days on market $200,000 Active 6 DOM
-
2026-06-16days on market $200,000 Active 5 DOM
-
2026-06-15days on market $200,000 Active 4 DOM
-
2026-06-13remarks 686-char remark
-
2026-06-13$200,000 Active 2 DOM
ⓘ Source: listings_history table (triggers on properties + properties_extension) + one-shot
backfill from property_details.listing_events for pre-trigger history.
Tax reassessment forecast VA · Resets to sale price
- Current annual tax
- $2,216 · $185/mo
- Projected year-2 tax
- $2,216 · $185/mo
- Expected delta
- $0/yr ($0/mo · 0.0%)
ⓘ Screening estimate from a state-policy table — verify with the county assessor before closing.
Climate risk First Street
- Flood 5/10 Major FEMA zone X (unshaded) · 47% chance over 30 yrs
- Wildfire 1/10 Low
- Heat 9/10 Extreme 7 d/yr ≥106°F today · 16 d/yr by 30 yrs out
- Wind 8/10 Severe 80% chance of damaging wind over 30 yrs
- Air quality 2/10 Low 1 unhealthy d/yr today · 3 by 30 yrs out
Nearby sold comps map
Loading sold comps map…
Walkable amenities ~0.75 mi
Loading nearby amenities…
Taxation est. · year 1
- Rental income
- $19,866
- − Mortgage interest
- −$11,203
- − Property taxes
- −$2,216
- − Insurance
- −$1,000
- − Repairs & maintenance
- −$1,589
- − Management
- −$1,589
- − Depreciation
- −$5,818
- Taxable loss
- −$3,551
- Est. tax savings @ 24.0%
- +$852
- After-tax cash flow
- $744/yr
For passive investors: Depreciation is non-cash, so a rental often shows a tax loss while cash-flowing — sheltering income. Rental losses are passive: they offset passive income freely, and up to $25,000/yr can offset ordinary (W-2) income if you actively participate and your MAGI is under $100k (phasing out to $0 by $150k); unused losses carry forward. On sale, claimed depreciation is recaptured at up to 25%, and gains may owe capital-gains tax (a 1031 exchange can defer both). Figures are a year-1 estimate at your 24.0% rate — not tax advice; consult a CPA.
Schools (NCES district)
- District
- Portsmouth City Public School District
- NCES district ID
- 5103000
- Math proficiency
- 34% ▼ -40.00%
- Reading proficiency
- 58% ▼ -12.00%
- Median HH income
- $46,152
- Composite
- 39.01/100
- National rank
- #4071
- State rank
- #107 of 131 in VA
Livability — Portsmouth
- Score
- 73/100
- State rank
- #172
- US rank
- #5381
Category grades
Schools grade is shown separately in the Schools card above.
Census & demographics
- Census place
- Portsmouth, VA
- County
- Portsmouth City · 96,366 people
- City population
- 96,366
- Metro
- Virginia Beach-Norfolk-Newport News, VA-NC
- Population (ZIP)
- 25,610
- Household income
- $78,707
- Rent vs Own
- Severe rent burden
- 705.0
Population outlook (Portsmouth County) Hauer SSP2
- Today (2025)
- 96,730 people
- By 2030
- 96,760 · +0.0%
- By 2040
- 96,573 · -0.2%
- By 2050
- 95,606 · -1.2%
- By 2075
- 93,579 · -3.3%
- By 2100
- 83,756 · -13.4%
Race, ethnicity, and origin ACS 2023
- Neighborhood character
- Diverse neighborhood (Simpson 0.64)
- Race & ethnicity
- Black 47% White 38% Two or more races 9% Hispanic / Latino 7% Asian 2%
- Hispanic origin (detail)
- Mexican 3% Puerto Rican 3%
- Common ancestry
- Slovak 2% Lithuanian 2% Italian 1%
- Foreign-born
- 4% · Canada, China
- Languages at home
- 94% English-only · Spanish 3% French/Haitian/Cajun 0%
Political lean MEDSL · Portsmouth
- 2024 margin
- Solid D (+38.6) · D 68.6% · R 30.0% · Other 1.4%
- 2008→2024 swing
- -0.7pp no change · 2008: 39.3pp · 2024: 38.6pp
- All cycles
- 2024: D+38.6 2020: D+40.8 2016: D+36.5 2012: D+39.6 2008: D+39.3
Not yet ingested
- Civics
- —
Market trends
- HPI YoY
- ▼ -228.63%
- Current HPI
- 278.3968
- Rent YoY
- —
- Metro
- Virginia Beach-Norfolk-Newport News, VA-NC
- State GDP YoY
- ▲ 2.40%
- F500 in state
- 50
Industry mix (Fortune 500 HQ in VA)
| Industry | F500 HQs | Revenue |
|---|---|---|
| Aerospace / Defense | 4 | $236B |
|
||
| Technology / Defense | 3 | $32B |
|
||
| Financial Services | 2 | $176B |
|
||
| Utilities | 2 | $27B |
|
||
| Insurance | 2 | $25B |
|
||
| Technology | 2 | $15B |
|
||
Price history
+122.2% since first listed7 events — show timeline
- 2026-06-11 Listed $200,000 REINMLS
- 2024-02-20 Sold (Public Records) $185,000 Public Records
- 2024-01-25 Pending — REINMLS
- 2024-01-15 Contingent — REINMLS
- 2024-01-11 Listed $185,000 REINMLS
- 2015-04-29 Sold (Public Records) $89,999 Public Records
- 2014-08-18 Price Changed $89,999 REINMLS
Property tax history
+25.9%/yrLatest (2025): $2,216 · +5.9% YoY. Source: county tax records.
Cash-flow waterfall
monthlySold comps — $/sqft
last 12 mo · ≤1 miLoading sold comps…