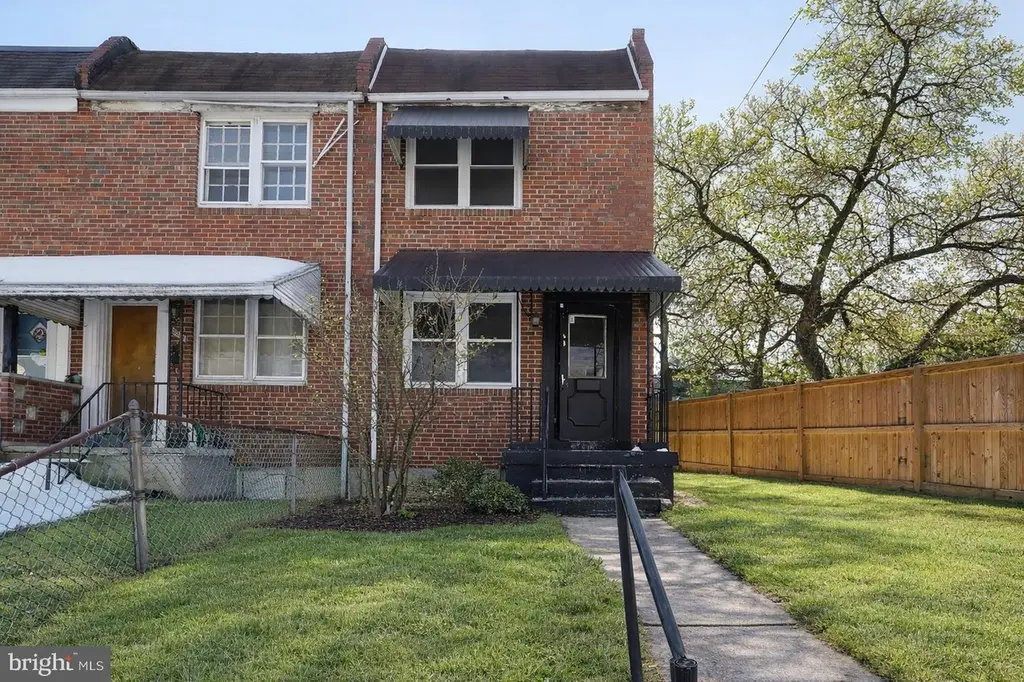
3021 Stafford St · Baltimore, MD
Flood risk 1/10 · Minimal
- FEMA flood zone
- X (unshaded)
- Chance of flooding over 30 yrs
- 0.0%
- Est. flood insurance / yr
- $473 – $860
Fire risk 1/10 · Minimal
- Est. fire insurance / yr
- $755 – $1,403
Heat risk 7/10 · Major
- Hot days now (above 103°F)
- 7 days/yr
- Hot days in 30 yrs
- 15 days/yr
Wind risk 6/10 · Moderate
- Chance of severe wind over 30 yrs
- 27.0%
Air-quality risk 3/10 · Minor
- Unhealthy air days now
- 3 days/yr
- Unhealthy air days in 30 yrs
- 4 days/yr
Risk factors via First Street. Map © Google.
Why this score? — see what drove the C+ grade
The composite is a weighted blend of 9 inputs, each scored 0–100. Each bar is that input's sub-score; the figure is the points it added to the 100-point composite (weight × sub-score).
- Cash flow +30.0/30.0
- DSCR +10.0/10.0
- 1% rule +8.8/10.0
- Rent growth +4.4/5.0
- Livability +3.8/5.0
- Condition / age +2.5/5.0
- Schools +1.0/10.0
- ARV discount +0.0/15.0
- Appreciation +0.0/10.0
$104,900
🖨 Deal sheet (PDF) 📄 Offer letter ✓ Due diligence
Listing remarks MLS
Welcome to this charming Baltimore Federal Semi- Detached home nestled in the heart of Gwynns Falls. This inviting property blends classic character with everyday comfort, offering bright living spaces, a functional layout, and plenty of room to make it your own. Enjoy the convenience of city living while being just moments from parks, local amenities, and major commuter routes.
Key facts
- Built 1950
- Listed 116 days
Neighborhood map
What this means for you Summary
Snapshot
- This is a 2-bed/1.0-bath townhouse listed at $105k.
Deal economics
- At list price, monthly cash flow is $394 ($5k/yr) — positive.
- The deal already cash-flows at list — no discount required.
- Meets the 1% rule at list price ($1k rent vs $105k).
- Recommended offer: $95k (9.0% below list) — sets the bar for market timing.
- Cap rate 10.8% vs local median 6.0% in Baltimore — top-decile yield for the area; either an underpriced asset or a hidden risk that comps aren't pricing in. Stress-test before assuming the spread holds.
Location & tenants
- Location reads 76/100 on livability (#90 in MD, #3,396 nationally) — a middle-class / working-renter tenant base. Strengths: amenities A+, commute A+, housing A+; Watch: crime F.
- Baltimore City Public Schools (urban): math 7% / reading 16% proficiency, ranked #24 of 24 in MD (top 100%) — low school quality limits family demand, transient renter base, plan for 1-2y turnover; 79% free/reduced lunch — lower-income household profile, screen leases tightly.
- Zoned schools: Elmer A. Henderson: A Johns Hopkins Partnership (math 2% / reading 16%, grade F, #650 of 860 statewide, top 77%, 642 students, 80% FRL); Vanguard Collegiate Middle (math 3% / reading 15%, grade F, #212 of 225 statewide, top 95%, 343 students, 84% FRL); Baltimore Polytechnic Institute (math 71% / reading 84%, grade A-, #22 of 222 statewide, top 10%, 1,555 students, 43% FRL).
- Zoned-school proficiency averages 32% at this address vs 12% district-wide (+20 pts) — the actual schools serving this property are materially stronger than the Baltimore City Public Schools average implies; a family-tenant draw the district grade alone would hide.
- Market conditions: Rents rising fast (+7.5%/yr); 425 active listings in the ZIP; 36 comparable units currently listed for rent nearby; rentals at typical pace (median 26d on market — plan ~3-4 weeks tenant-placement turnaround); 1,273 units permitted in Baltimore city in 2024 (1,104 in 5+ unit buildings).
Forward outlook
- Local home prices are declining (-3.0%/yr); year-one equity from $725 of loan paydown is wiped out by about $3k of value loss. Plan a longer hold.
- Baltimore County population projected to shrink 4% by 2050 — rents likely to lag national; underwrite the cash flow, not the appreciation.
- At projected returns (-3.0% appreciation + 7.5% rent growth), your $29k cash investment doubles in ~6 years — after that, you're playing with house money.
Negotiation context
- It's been on market 116 days — a 9% lower offer ($95k) is reasonable based on typical stale-listing flexibility.
- 9 sale attempts since 21y ago; this cycle's ask has dropped $20k (16%) from the opening price — seller is motivated, your offer sets the floor, not the list.
Risks & watch-outs
- Watch-outs: built in 1950 — expect roof / HVAC / electrical / plumbing capex.
- Climate carrying-cost: major wind risk, 27% chance of damaging wind over 30y; extreme-heat days projected 7→15/yr by 2055 (HVAC capex compounding) — expect insurance premiums to compound above CPI over the hold.
Questions for the listing agent
- It's been on market 116 days. Have you received any prior offers? Is the seller open to a 9% concession, seller financing, or rate buy-down credit?
- Built in 1950 — when were the roof, HVAC, electrical panel, plumbing, and water heater last replaced?
- Why hasn't it sold? Are there any deal-killer items the seller is aware of (foundation, flood, title, zoning, code violations)?
- Is there a deadline driving the sale (1031 exchange, divorce, estate, relocation)? That informs how much negotiation room exists.
- Schools are D-rated, which usually means shorter tenancies and higher turnover. Who's the typical renter profile here, and what's been the actual vacancy rate?
- Crime grade is F in this area — have there been break-ins, vandalism, or insurance claims at this property in the last 3 years? What carrier currently insures it and at what premium?
- What's the average days-on-market for RENTAL listings here right now (not sales)? A rising rental-DOM trend means longer vacancies and softer asking-rent achievability than the comps imply.
- What's the recent tenant-quality profile in this submarket — average credit score on applications, eviction rate, late-payment / NSF rate, and stable-employment percentage? A property-management company in the area should have these aggregated.
- How much new for-sale + rental construction is in the pipeline within 1–3 miles? Heavy new supply typically softens prices + rents 12–24 months out; constrained supply supports both.
Investment metrics
- 1% rule
- 1.38% ✓
- Cap rate
- 10.80%
- Cash-on-cash
- 16.09%
- DSCR
- 1.72
- GRM
- 6.0
CMA / ARV
- ARV (median comp)
- $79,996
- List price
- $104,900
- Delta
- 31.13%
- Verdict
- OVERPRICED
- Comps
- 20 within 1.0 mi
Show comp detail 12 sales within ~0.75 mi
| Address | Dist | Beds/Ba | Sqft | Sold | Price | $/sf | Match |
|---|---|---|---|---|---|---|---|
| 3140 Strickland St | 0.15mi | 2/1.0 | 904 (-9%) | 7mo | $103,000 | $114 | 72 |
| 1052 Parksley Ave | 0.47mi | 2/1.0 | 1,050 (+6%) | 4mo | $110,000 | $105 | 66 |
| 2637 Dulany St | 0.51mi | 3/1.0 (+1) | 972 (-2%) | 6mo | $35,000 | $36 | 63 |
| 3386 Dulany St | 0.50mi | 3/2.0 (+1) | 1,014 (+2%) | 6mo | $169,000 | $167 | 60 |
| 3396 Dulany St | 0.51mi | 2/1.5 | 1,080 (+9%) | 0mo | $177,523 | $164 | 60 |
| 119 Hilton St | 0.63mi | 2/2.0 | 1,040 (+5%) | 0mo | $211,000 | $203 | 59 |
| 3367 Dulany St | 0.47mi | 3/1.5 (+1) | 1,054 (+6%) | 7mo | $166,000 | $157 | 55 |
| 23 N Morley St | 0.67mi | 3/1.0 (+1) | 1,041 (+5%) | 6mo | $85,000 | $82 | 51 |
| 2402 Wilkens Ave | 0.72mi | 2/1.0 | 1,092 (+10%) | 1mo | $45,000 | $41 | 50 |
| 3517 Wilkens Ave | 0.75mi | 2/2.0 | 1,050 (+6%) | 4mo | $215,000 | $205 | 49 |
| 2408 Wilkens Ave | 0.71mi | 3/2.0 (+1) | 1,092 (+10%) | 2mo | $99,900 | $91 | 40 |
| 1 N Culver St | 0.73mi | 3/2.0 (+1) | 1,140 (+15%) | 4mo | $225,000 | $197 | 29 |
Match score weights: distance 35% · size 25% · config 20% · recency 20%. Top-matched comps best support the ARV.
Projected returns pro-forma
-3.0% appreciation · 7.51% rent growth · sell at horizon
- IRR
- 12.2%
- Equity multiple
- 1.51×
- Total profit
- $14,982
- Equity at exit
- $15,641
- IRR
- 24.5%
- Equity multiple
- 3.60×
- Total profit
- $76,388
- Equity at exit
- $9,070
Cash invested: $29,372 (down + closing). Projections, not guarantees.
Landlord ↔ Tenant lean methodology
- Overall (CITY)
- 12 Strongly Tenant-Friendly
- State Maryland
- 27 Tenant-Leaning · D+14
- County
- — inherits STATE
- City Baltimore
- 12 Strongly Tenant-Friendly · D+58
ZIP-level market 21223
- Rents YoY
- 7.5%
- Active inventory
- 425
- Price-to-rent
- 6.0×
Monthly cashflow live
- Estimated rent
- $1,446 high interval (Pro) →
- Mortgage (P&I)
- −$550
- Tax from tax record
- −$154 /mo · $1,853/yr
- Insurance
- −$44
- HOA
- −$0
- Vacancy / Maint / Mgmt
- −$304
- Net cashflow
- $394
Break-even live
Sensitivity live
| Price | -10% $453 | -5% $424 | +0% $394 | +5% $364 | +10% $334 |
|---|---|---|---|---|---|
| Rent | -10% $280 | -5% $337 | +0% $394 | +5% $451 | +10% $508 |
| Rate | -1.0pp $447 | -0.5pp $421 | base $394 | +0.5pp $367 | +1.0pp $339 |
UW: 25.0% down · 7.5% · 30yr · 1.5% tax · 5.0% vac · 8.0% maint · 8.0% mgmt
Financing live
Cash to close
- Down payment
- $26,225
- Closing costs
- $3,147
- Reserves months
- —
- Total cash needed
- —
Loan-product check · same deal, 3 products live
Conventional
25% down · 7.5% · 30yr
- Down + closing
- —
- Monthly P&I
- —
- Monthly cashflow
- —
- DSCR
- —
- Eligible?
- —
Personal DTI + credit; lowest rate.
DSCR
20% down · 8.5% · 30yr
- Down + closing
- —
- Monthly P&I
- —
- Monthly cashflow
- —
- DSCR
- —
- Eligible?
- —
No personal income docs; deal must DSCR.
Hard money
10% down · 12.0% · 12mo
- Down + closing
- —
- Monthly P&I
- —
- Monthly cashflow
- —
- DSCR
- —
- Eligible?
- —
Short-term bridge; refi at stabilization.
Rent comps 36 comps
| Address | Beds | Baths | Sqft | Rent | $/sqft | DOM | Units | Dist |
|---|---|---|---|---|---|---|---|---|
| 2657 Lehman St Unit 1 Baltimore, MD | 2.0 | 1.0 | 1056 | $1,000 | $0.95 | 45d | 1 | 0.46mi |
| 3392 Saint Benedict St Baltimore, MD | 2.0 | 1.0 | 864 | $1,450 | $1.68 | 25d | 1 | 0.53mi |
| 332 S Franklintown Rd Unit 2 Baltimore, MD | 2.0 | 1.0 | 776 | $795 | $1.02 | 25d | 1 | 0.57mi |
| 2540 Frederick Ave Baltimore, MD | 3.0 | 1.0 | 1075 | $1,400 | $1.30 | 25d | 1 | 0.61mi |
| 3310 Elbert St Baltimore, MD | 2.0 | 1.0 | 920 | $1,550 | $1.68 | 25d | 1 | 0.65mi |
| 2516 Hollins St Baltimore, MD | 3.0 | 2.0 | 1100 | $1,700 | $1.55 | 45d | 1 | 0.77mi |
| 304 Collins Ave Unit 2 Baltimore, MD | 3.0 | 1.0 | 1016 | $2,100 | $2.07 | 45d | 1 | 0.91mi |
| 304 Collins Ave Unit 1 Baltimore, MD | 1.0 | 1.0 | 845 | $1,600 | $1.89 | 45d | 1 | 0.91mi |
| 4018 Massachusetts Ave Baltimore, MD | 3.0 | 1.0 | 1050 | $1,400 | $1.33 | 25d | 1 | 0.92mi |
| 3607 W Lexington St Baltimore, MD | 3.0 | 2.0 | 1050 | $1,895 | $1.80 | 6d | 1 | 0.94mi |
| 62 N Gorman Ave Baltimore, MD | 3.0 | 2.0 | 1100 | $2,500 | $2.27 | 19d | 1 | 0.99mi |
| 1706 Harman Ave Baltimore, MD | 3.0 | 1.0 | 1056 | $1,600 | $1.52 | 0d | 1 | 1.05mi |
| 4301 Parkton St Baltimore, MD | 1.0–3.0 | 1.0 | 730 | $1,264 | $1.73 | 45d | 1 | 1.07mi |
| 4215 Connecticut Ave Baltimore, MD | 1.0 | 1.0 | 625 | $950 | $1.52 | 25d | 1 | 1.10mi |
| 3706 W Franklin St Unit 1 Baltimore, MD | 2.0 | 1.0 | 735 | $1,100 | $1.50 | 6d | 1 | 1.15mi |
| 2429 Washington Blvd Baltimore, MD | 1.0 | 1.0 | 940 | $600 | $0.64 | 25d | 1 | 1.16mi |
| 2 S Woodington Rd Baltimore, MD | 1.0 | 1.0 | 620 | $1,310 | $2.11 | 45d | 1 | 1.17mi |
| 2 S Woodington Rd Baltimore, MD | 2.0 | 1.0 | 856 | $1,160 | $1.36 | 16d | 1 | 1.17mi |
| 2 S Woodington Rd Baltimore, MD | 1.0 | 1.0 | 620 | $1,135 | $1.83 | 6d | 1 | 1.17mi |
| 2 S Woodington Rd Baltimore, MD | 1.0 | 1.0 | 620 | $1,135 | $1.83 | 0d | 1 | 1.17mi |
| 2 N Woodington Rd Baltimore, MD | 1.0–2.0 | 1.0 | 738 | $1,335 | $1.81 | 5d | 5 | 1.18mi |
| 600 Linnard St Baltimore, MD | 1.0 | 1.0 | 600 | $1,300 | $2.17 | 45d | 1 | 1.19mi |
| 1931 Griffis Ave Baltimore, MD | 2.0 | 1.0 | 912 | $1,349 | $1.48 | 6d | 1 | 1.20mi |
| 709 Denison St Baltimore, MD | 2.0 | 2.0 | 840 | $1,630 | $1.94 | 25d | 1 | 1.20mi |
| 1918 W Baltimore St Baltimore, MD | 2.0–3.0 | 1.0–2.0 | 857 | $1,375 | $1.60 | 45d | 1 | 1.23mi |
| 751 Yale Ave Baltimore, MD | 3.0 | 1.5 | 1024 | $1,750 | $1.71 | 45d | 1 | 1.26mi |
| 4431 Eldone Rd Baltimore, MD | 3.0 | 2.0 | 896 | $2,000 | $2.23 | 25d | 1 | 1.30mi |
| 1712 W Lombard St #4 Baltimore, MD | 1.0 | 1.0 | 550 | $900 | $1.64 | 45d | 1 | 1.33mi |
| 787 N Grantley St Baltimore, MD | 3.0 | 1.0 | 1116 | $1,575 | $1.41 | 25d | 1 | 1.33mi |
| 4041 Wilkens Ave Unit C Baltimore, MD | 1.0 | 1.0 | 600 | $1,050 | $1.75 | 16d | 1 | 1.37mi |
| 4041 Wilkens Ave Unit B Baltimore, MD | 1.0 | 1.0 | 600 | $1,000 | $1.67 | 45d | 1 | 1.39mi |
| 627 Lucia Ave Baltimore, MD | 3.0 | 1.0 | 892 | $1,750 | $1.96 | 25d | 1 | 1.39mi |
| 919 Claymont Ave Baltimore, MD | 2.0 | 1.0 | 1006 | $1,342 | $1.33 | 0d | 2 | 1.41mi |
| 613 S Beechfield Ave Baltimore, MD | 3.0 | 1.5 | 1080 | $1,950 | $1.81 | 45d | 1 | 1.45mi |
| 1601 Frederick Ave Unit 3 Baltimore, MD | 2.0 | 1.0 | 1050 | $1,050 | $1.00 | 6d | 1 | 1.45mi |
| 1042 Ellicott Dr Baltimore, MD | 2.0 | 1.0 | 900 | $1,450 | $1.61 | 45d | 1 | 1.49mi |
Listing history 42 events
-
2026-06-13statusdays on market $104,900 Pending 116 DOM
-
2026-06-09days on market $104,900 Active 114 DOM
-
2026-06-08days on market $104,900 Active 113 DOM
-
2026-06-07days on market $104,900 Active 112 DOM
-
2026-06-04days on market $104,900 Active 109 DOM
-
2026-06-03days on market $104,900 Active 108 DOM
-
2026-06-02days on market $104,900 Active 107 DOM
-
2026-06-01days on market $104,900 Active 106 DOM
-
2026-05-31days on market $104,900 Active 105 DOM
-
2026-04-24price $104,900 381-char remark
Show marketing remark (381 chars)
Welcome to this charming Baltimore Federal Semi- Detached home nestled in the heart of Gwynns Falls. This inviting property blends classic character with everyday comfort, offering bright living spaces, a functional layout, and plenty of room to make it your own. Enjoy the convenience of city living while being just moments from parks, local amenities, and major commuter routes.
-
2026-03-20price $114,900 381-char remark
Show marketing remark (381 chars)
Welcome to this charming Baltimore Federal Semi- Detached home nestled in the heart of Gwynns Falls. This inviting property blends classic character with everyday comfort, offering bright living spaces, a functional layout, and plenty of room to make it your own. Enjoy the convenience of city living while being just moments from parks, local amenities, and major commuter routes.
-
2026-02-15$125,000 Active 381-char remark
Show marketing remark (381 chars)
Welcome to this charming Baltimore Federal Semi- Detached home nestled in the heart of Gwynns Falls. This inviting property blends classic character with everyday comfort, offering bright living spaces, a functional layout, and plenty of room to make it your own. Enjoy the convenience of city living while being just moments from parks, local amenities, and major commuter routes.
-
2023-03-13soldstatus $190,000
-
2023-02-22soldstatus $115,000
-
2021-07-27soldstatus $38,000
-
2021-05-13soldstatus $38,000 Closed 379-char remark
Show marketing remark (379 chars)
NOT AN AUCTION, NOT A SHORT SALE, NOT A BANK OWNED, NOT A FORECLOSURE, NOT WHOLESALING---QUICK AND EASY. BUYER TO PAY ALL TRANSFER AND RECORDING FEES. NEW ROOF IN 2020! This property has been very popular!!! The owner has decided that all offers should be submitted by 4 p. m. on Friday, April 16th. Please submit your highest and best offer. Escalation addendum are acceptable.
-
2021-04-27status Pending 379-char remark
Show marketing remark (379 chars)
NOT AN AUCTION, NOT A SHORT SALE, NOT A BANK OWNED, NOT A FORECLOSURE, NOT WHOLESALING---QUICK AND EASY. BUYER TO PAY ALL TRANSFER AND RECORDING FEES. NEW ROOF IN 2020! This property has been very popular!!! The owner has decided that all offers should be submitted by 4 p. m. on Friday, April 16th. Please submit your highest and best offer. Escalation addendum are acceptable.
-
2021-04-17historical Active Under Contract 379-char remark
Show marketing remark (379 chars)
NOT AN AUCTION, NOT A SHORT SALE, NOT A BANK OWNED, NOT A FORECLOSURE, NOT WHOLESALING---QUICK AND EASY. BUYER TO PAY ALL TRANSFER AND RECORDING FEES. NEW ROOF IN 2020! This property has been very popular!!! The owner has decided that all offers should be submitted by 4 p. m. on Friday, April 16th. Please submit your highest and best offer. Escalation addendum are acceptable.
-
2021-04-10$29,900 Active 379-char remark
Show marketing remark (379 chars)
NOT AN AUCTION, NOT A SHORT SALE, NOT A BANK OWNED, NOT A FORECLOSURE, NOT WHOLESALING---QUICK AND EASY. BUYER TO PAY ALL TRANSFER AND RECORDING FEES. NEW ROOF IN 2020! This property has been very popular!!! The owner has decided that all offers should be submitted by 4 p. m. on Friday, April 16th. Please submit your highest and best offer. Escalation addendum are acceptable.
-
2018-05-15historical
-
2018-03-29historical Active Under Contract
-
2018-03-29status Contingent (No Kick Out)
-
2018-03-29historical Withdrawn
-
2017-10-13price
-
2017-06-12price
-
2017-05-29price
-
2017-05-29status Active
-
2017-04-11status Contingent (No Kick Out)
-
2017-03-24Active
-
2017-03-24$32,000 Active
-
2014-04-27historical Withdrawn
-
2014-04-27historical
-
2014-03-04status Contract
-
2014-01-08price
-
2013-11-10Active
-
2013-11-10$19,000
-
2006-02-07historical
-
2005-11-05
-
2005-07-14soldstatus $49,000
-
2005-07-13historical
-
2005-05-02$52,500
-
1988-05-31soldstatus $35,000
ⓘ Source: listings_history table (triggers on properties + properties_extension) + one-shot
backfill from property_details.listing_events for pre-trigger history.
Tax reassessment forecast MD · Partial reset (capped growth)
- Current annual tax
- $1,853 · $154/mo
- Projected year-2 tax
- $1,853 · $154/mo
- Expected delta
- $0/yr ($0/mo · 0.0%)
ⓘ Screening estimate from a state-policy table — verify with the county assessor before closing.
Climate risk First Street
- Flood 1/10 Low FEMA zone X (unshaded) · 0% chance over 30 yrs
- Wildfire 1/10 Low
- Heat 7/10 Severe 7 d/yr ≥103°F today · 15 d/yr by 30 yrs out
- Wind 6/10 Major 27% chance of damaging wind over 30 yrs
- Air quality 3/10 Moderate 3 unhealthy d/yr today · 4 by 30 yrs out
Nearby sold comps map
Loading sold comps map…
Walkable amenities ~0.75 mi
Loading nearby amenities…
Taxation est. · year 1
- Rental income
- $17,349
- − Mortgage interest
- −$5,876
- − Property taxes
- −$1,853
- − Insurance
- −$524
- − Repairs & maintenance
- −$1,388
- − Management
- −$1,388
- − Depreciation
- −$3,052
- Taxable income
- $3,267
- Est. tax owed @ 24.0%
- −$784
- After-tax cash flow
- $3,942/yr
For passive investors: Depreciation is non-cash, so a rental often shows a tax loss while cash-flowing — sheltering income. Rental losses are passive: they offset passive income freely, and up to $25,000/yr can offset ordinary (W-2) income if you actively participate and your MAGI is under $100k (phasing out to $0 by $150k); unused losses carry forward. On sale, claimed depreciation is recaptured at up to 25%, and gains may owe capital-gains tax (a 1031 exchange can defer both). Figures are a year-1 estimate at your 24.0% rate — not tax advice; consult a CPA.
Schools (NCES district)
- District
- Baltimore City Public Schools
- NCES district ID
- 2400090
- Math proficiency
- 7% ▼ -9.00%
- Reading proficiency
- 16% ▼ -5.00%
- Median HH income
- $42,108
- Composite
- 10.08/100
- National rank
- #9805
- State rank
- #24 of 24 in MD
Livability — Baltimore
- Score
- 76/100
- State rank
- #90
- US rank
- #3396
Category grades
Schools grade is shown separately in the Schools card above.
Census & demographics
- Census place
- Baltimore, MD
- County
- Baltimore City · 558,601 people
- City population
- 588,727
- Metro
- Baltimore-Columbia-Towson, MD
- Population (ZIP)
- 19,572
- Household income
- $45,840
- Rent vs Own
- Severe rent burden
- 1755.0
Population outlook (Baltimore County) Hauer SSP2
- Today (2025)
- 624,249 people
- By 2030
- 621,541 · -0.4%
- By 2040
- 609,756 · -2.3%
- By 2050
- 597,249 · -4.3%
- By 2075
- 552,236 · -11.5%
- By 2100
- 513,934 · -17.7%
Race, ethnicity, and origin ACS 2023
- Neighborhood character
- Predominantly Black (72%)
- Race & ethnicity
- Black 72% White 16% Hispanic / Latino 7% Two or more races 6% Asian 1%
- Hispanic origin (detail)
- Mexican 3% Puerto Rican 1%
- Common ancestry
- Romanian 1%
- Foreign-born
- 8% · Canada
- Languages at home
- 90% English-only · Spanish 6% French/Haitian/Cajun 2% Other Indo-European 1%
Political lean MEDSL · Baltimore
- 2024 margin
- Solid D (+73.0) · D 85.2% · R 12.2% · Other 2.6%
- 2008→2024 swing
- -2.5pp toward R · 2008: 75.5pp · 2024: 73.0pp
- All cycles
- 2024: D+73.0 2020: D+76.6 2016: D+74.6 2012: D+76.4 2008: D+75.5
Not yet ingested
- Civics
- —
Market trends
- HPI YoY
- ▼ -97.99%
- Current HPI
- 140.5836
- Rent YoY
- ▲ 7.51%
- Metro
- Baltimore-Columbia-Towson, MD
- State GDP YoY
- ▲ 2.97%
- F500 in state
- 12
Industry mix (Fortune 500 HQ in MD)
| Industry | F500 HQs | Revenue |
|---|---|---|
| Aerospace / Defense | 1 | $71B |
|
||
| Utilities | 1 | $25B |
|
||
| Hotels | 1 | $24B |
|
||
| Consumer Goods | 1 | $7B |
|
||
| Real Estate | 1 | $6B |
|
||
| Chemicals | 1 | $2B |
|
||
Price history
+199.7% since first listed33 events — show timeline
- 2026-04-24 Price Changed $104,900 BRIGHT MLS
- 2026-03-20 Price Changed $114,900 BRIGHT MLS
- 2026-02-15 Listed $125,000 BRIGHT MLS
- 2023-03-13 Sold (Public Records) $190,000 Public Records
- 2023-02-22 Sold (Public Records) $115,000 Public Records
- 2021-07-27 Sold (Public Records) $38,000 Public Records
- 2021-05-13 Sold (MLS) $38,000 BRIGHT MLS
- 2021-04-27 Pending — BRIGHT MLS
- 2021-04-17 Contingent — BRIGHT MLS
- 2021-04-10 Listed $29,900 BRIGHT MLS
- 2018-05-15 Listing Removed — BRIGHT MLS
- 2018-03-29 Contingent — BRIGHT MLS
- 2018-03-29 Pending — MRIS
- 2018-03-29 Delisted — MRIS
- 2017-10-13 Price Changed — MRIS
- 2017-06-12 Price Changed — MRIS
- 2017-05-29 Price Changed — MRIS
- 2017-05-29 Relisted — MRIS
- 2017-04-11 Pending — MRIS
- 2017-03-24 Listed — MRIS
- 2017-03-24 Listed $32,000 BRIGHT MLS
- 2014-04-27 Delisted — MRIS
- 2014-04-27 Listing Removed — BRIGHT MLS
- 2014-03-04 Pending — MRIS
- 2014-01-08 Price Changed — MRIS
- 2013-11-10 Listed — MRIS
- 2013-11-10 Listed $19,000 BRIGHT MLS
- 2006-02-07 Delisted — MRIS
- 2005-11-05 Listed — MRIS
- 2005-07-14 Sold (MLS) $49,000 MRIS
- 2005-07-13 Delisted — MRIS
- 2005-05-02 Listed $52,500 MRIS
- 1988-05-31 Sold (Public Records) $35,000 Public Records
Property tax history
+0.6%/yrLatest (2025): $1,853 · +12.7% YoY. Source: county tax records.
Cash-flow waterfall
monthlySold comps — $/sqft
last 12 mo · ≤1 miLoading sold comps…