1618 Olive Ibis · San Antonio, TX
Flood risk No data
- FEMA flood zone
- —
- Chance of flooding over 30 yrs
- —
- Est. flood insurance / yr
- —
Fire risk No data
- Est. fire insurance / yr
- —
Heat risk No data
- Hot days now (above threshold)
- —
- Hot days in 30 yrs
- —
Wind risk No data
- Chance of severe wind over 30 yrs
- —
Air-quality risk No data
- Unhealthy air days now
- —
- Unhealthy air days in 30 yrs
- —
Risk factors via First Street. Map © Google.
Why this score? — see what drove the D+ grade
The composite is a weighted blend of 9 inputs, each scored 0–100. Each bar is that input's sub-score; the figure is the points it added to the 100-point composite (weight × sub-score).
- Cash flow +15.2/30.0
- ARV discount +10.7/15.0
- DSCR +4.7/10.0
- 1% rule +4.5/10.0
- Livability +4.0/5.0
- Condition / age +4.0/5.0
- Rent growth +2.2/5.0
- Schools +1.4/10.0
- Appreciation +0.0/10.0
$250,950
🖨 Deal sheet (PDF) 📄 Offer letter ✓ Due diligence
Listing remarks
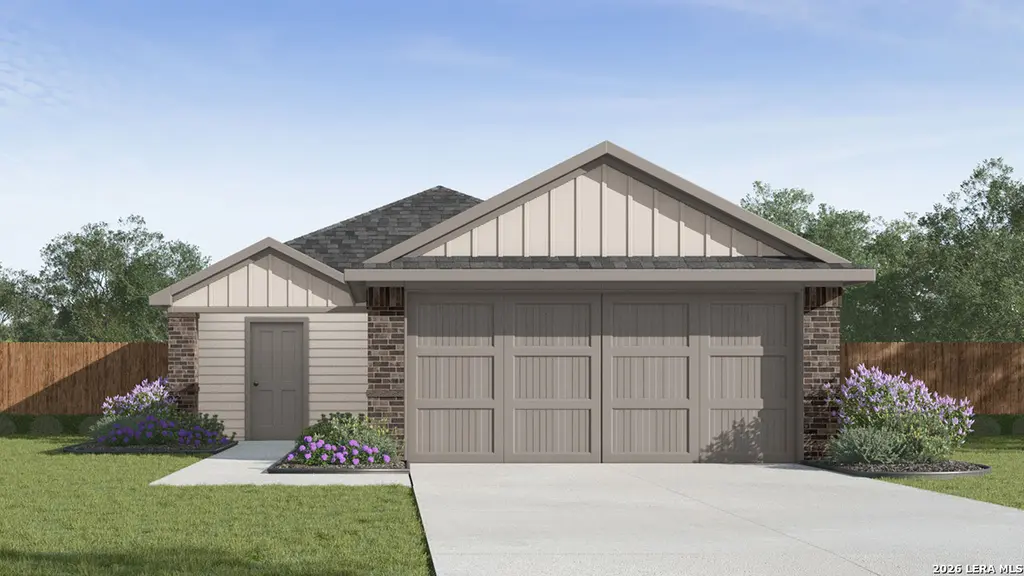
The Estero is a charming one-story home featured in Redbird Ranch in San Antonio, TX. Featuring 2 classic front exteriors, this 4 bedroom, 2 bathroom home also offers 1586 square feet of living space and a 2-car garage. A front porch (per plan) welcomes you into the home and opens to the gourmet kitchen which includes quartz counter tops, shaker style cabinets, stainless steel appliances and an open concept floorplan with the kitchen flowing seamlessly into the dining room and living room. The main bedroom has an attractive ensuite bathroom that features a quartz vanity countertop, shaker style cabinetry and a spacious tiled walk-in shower. Enjoy additional storage with a large walk-in clos
Key facts
- Gourmet kitchen
- Quartz counter tops
- Ensuite bathroom
Tags
Neighborhood map
What this means for you Summary
Snapshot
- This is a 4-bed/2.0-bath single-family listed at $251k. Condition is rated good.
Deal economics
- At list price, monthly cash flow is $86 ($1k/yr) — positive.
- The deal already cash-flows at list — no discount required.
- To meet the 1% rule (rent ≥ 1% of price), the offer needs to be $238k (5.2% below list).
- Recommended offer: $238k (5.2% below list) — sets the bar for 1% rule.
- Cap rate 6.7% vs local median 3.8% in San Antonio — top-decile yield for the area; either an underpriced asset or a hidden risk that comps aren't pricing in. Stress-test before assuming the spread holds.
Location & tenants
- Location reads 80/100 on livability (#31 in TX, #1,616 nationally) — a professional / high-income tenant draw. Strengths: amenities A+, commute A+, cost of living A+; Watch: crime F.
- San Antonio ISD (urban): math 12% / reading 22% proficiency, ranked #805 of 826 in TX (top 98%) — low school quality limits family demand, transient renter base, plan for 1-2y turnover; 80% free/reduced lunch — lower-income household profile, screen leases tightly.
- Zoned schools: Hawthorne Pk-8 Academy (math 16% / reading 27%, grade F, #3,470 of 4,322 statewide, top 81%, 621 students, 79% FRL, charter); Edison H S (math 14% / reading 24%, grade F, #1,431 of 1,632 statewide, top 88%, 1,329 students, 90% FRL) — zoned schools at 84% FRL track the district average.
- Market conditions: Rents soft (-1.1%/yr); 728 active listings in the ZIP; 40 comparable units currently listed for rent nearby; rentals at typical pace (median 26d on market — plan ~3-4 weeks tenant-placement turnaround); 40% of comp listings sitting > 30 days — soft ceiling on asking rent; solid renter incomes; 8,308 units permitted in Bexar County in 2024 (2,506 in 5+ unit buildings).
Forward outlook
- Local home prices are declining (-3.0%/yr); year-one equity from $2k of loan paydown is wiped out by about $8k of value loss. Plan a longer hold.
- Bexar County population projected at +50% by 2050 — long-run rental-demand tailwind backs the buy-and-hold thesis.
Negotiation context
- Only 4 days on market — expect competitive offers; lowballing is unlikely to land.
Questions for the listing agent
- What does the HOA fee cover, when was the last increase, and are there any pending special assessments or reserve-fund shortfalls?
- Is there a deadline driving the sale (1031 exchange, divorce, estate, relocation)? That informs how much negotiation room exists.
- Crime grade is F in this area — have there been break-ins, vandalism, or insurance claims at this property in the last 3 years? What carrier currently insures it and at what premium?
- The area grade is low — what's the realistic commute time and amenity access for the typical tenant pool here? Any planned neighborhood developments (good or bad) we should know about?
- What's the average days-on-market for RENTAL listings here right now (not sales)? A rising rental-DOM trend means longer vacancies and softer asking-rent achievability than the comps imply.
- What's the recent tenant-quality profile in this submarket — average credit score on applications, eviction rate, late-payment / NSF rate, and stable-employment percentage? A property-management company in the area should have these aggregated.
- How much new for-sale + rental construction is in the pipeline within 1–3 miles? Heavy new supply typically softens prices + rents 12–24 months out; constrained supply supports both.
Investment metrics
- 1% rule
- 0.95% ✗
- Cap rate
- 6.70%
- Cash-on-cash
- 1.46%
- DSCR
- 1.07
- GRM
- 8.8
CMA / ARV
- ARV (on-the-fly)
- $270,384
- Comps found
- 12
Show comp detail 12 sales within ~0.75 mi
| Address | Dist | Beds/Ba | Sqft | Sold | Price | $/sf | Match |
|---|---|---|---|---|---|---|---|
| 1618 Olive Ibis | 0.00mi | 4/2.0 | 1,572 (0%) | 1mo | $250,950 | $160 | 99 |
| 1633 Olive Ibis | 0.03mi | 4/2.0 | 1,572 (0%) | 5mo | $243,950 | $155 | 94 |
| 1621 Olive Ibis | 0.01mi | 3/2.0 (-1) | 1,434 (-9%) | 4mo | $242,950 | $169 | 76 |
| 1645 Olive Ibis | 0.03mi | 3/2.5 (-1) | 1,470 (-6%) | 6mo | $240,245 | $163 | 76 |
| 1657 Olive Ibis | 0.03mi | 3/2.0 (-1) | 1,434 (-9%) | 6mo | $246,200 | $172 | 74 |
| 502 Sherman | 0.41mi | 3/3.0 (-1) | 1,531 (-3%) | 2mo | $350,000 | $229 | 65 |
| 8543 Willow Xing | 0.44mi | 4/2.5 | 1,692 (+8%) | 3mo | $205,999 | $122 | 62 |
| 8523 Willow Xing | 0.44mi | 4/2.5 | 1,692 (+8%) | 3mo | $195,999 | $116 | 62 |
| 914 N Olive #101 | 0.62mi | 3/2.5 (-1) | 1,536 (-2%) | 5mo | $341,000 | $222 | 56 |
| 215 Cunningham Ave | 0.52mi | 3/2.0 (-1) | 1,400 (-11%) | 4mo | $380,000 | $271 | 49 |
| 214 Rudolph | 0.67mi | 3/2.5 (-1) | 1,757 (+12%) | 6mo | $324,990 | $185 | 37 |
| 1118 Mason | 0.70mi | 3/1.5 (-1) | 1,374 (-13%) | 6mo | $299,999 | $218 | 34 |
Match score weights: distance 35% · size 25% · config 20% · recency 20%. Top-matched comps best support the ARV.
Projected returns pro-forma
-3.0% appreciation · 0.0% rent growth · sell at horizon
- IRR
- -17.5%
- Equity multiple
- 0.40×
- Total profit
- $-42,104
- Equity at exit
- $37,417
- IRR
- -16.8%
- Equity multiple
- 0.20×
- Total profit
- $-56,286
- Equity at exit
- $21,698
Cash invested: $70,266 (down + closing). Projections, not guarantees.
Landlord ↔ Tenant lean methodology
- Overall (STATE)
- 87 Strongly Landlord-Friendly
- State Texas
- 87 Strongly Landlord-Friendly · R+5
- County
- — inherits STATE
- City
- — inherits STATE
ZIP-level market 78253
- Home prices YoY
- -33.4%
- Rents YoY
- -1.1%
- Active inventory
- 728
- Price-to-rent
- 8.8×
Monthly cashflow live
- Estimated rent
- $2,380 high interval (Pro) →
- Mortgage (P&I)
- −$1,316
- Tax est. 1.5%
- −$314 /mo · $3,764/yr
- Insurance
- −$105
- HOA
- −$60
- Vacancy / Maint / Mgmt
- −$500
- Net cashflow
- $86
Break-even live
Sensitivity live
| Price | -10% $259 | -5% $172 | +0% $86 | +5% $-1 | +10% $-88 |
|---|---|---|---|---|---|
| Rent | -10% $-102 | -5% $-8 | +0% $86 | +5% $180 | +10% $274 |
| Rate | -1.0pp $212 | -0.5pp $150 | base $86 | +0.5pp $21 | +1.0pp $-45 |
UW: 25.0% down · 7.5% · 30yr · 1.5% tax · 5.0% vac · 8.0% maint · 8.0% mgmt
Financing live
Cash to close
- Down payment
- $62,738
- Closing costs
- $7,528
- Reserves months
- —
- Total cash needed
- —
Loan-product check · same deal, 3 products live
Conventional
25% down · 7.5% · 30yr
- Down + closing
- —
- Monthly P&I
- —
- Monthly cashflow
- —
- DSCR
- —
- Eligible?
- —
Personal DTI + credit; lowest rate.
DSCR
20% down · 8.5% · 30yr
- Down + closing
- —
- Monthly P&I
- —
- Monthly cashflow
- —
- DSCR
- —
- Eligible?
- —
No personal income docs; deal must DSCR.
Hard money
10% down · 12.0% · 12mo
- Down + closing
- —
- Monthly P&I
- —
- Monthly cashflow
- —
- DSCR
- —
- Eligible?
- —
Short-term bridge; refi at stabilization.
Rent comps 40 comps
| Address | Beds | Baths | Sqft | Rent | $/sqft | DOM | Units | Dist |
|---|---|---|---|---|---|---|---|---|
| 1607 N Pine St San Antonio, TX | 4.0 | 3.0 | 2034 | $2,995 | $1.47 | 45d | 1 | 0.10mi |
| 330 E Carson St Unit 2103 San Antonio, TX | 3.0 | 3.0 | 1428 | $1,930 | $1.35 | 26d | 1 | 0.11mi |
| 330 E Carson St Unit 2103 San Antonio, TX | 3.0 | 3.0 | 1428 | $2,215 | $1.55 | 45d | 1 | 0.11mi |
| 330 E Carson St Apt 2301 San Antonio, TX | 4.0 | 3.0 | 2087 | $2,835 | $1.36 | 26d | 1 | 0.11mi |
| 808 E Carson #102 San Antonio, TX | 3.0 | 2.5 | 1883 | $2,900 | $1.54 | 45d | 1 | 0.49mi |
| 808 E Carson St #101 San Antonio, TX | 3.0 | 2.5 | 1790 | $2,850 | $1.59 | 45d | 1 | 0.49mi |
| 122 Roy Smith St San Antonio, TX | 3.0 | 1.0–3.0 | 996 | $3,299 | $3.31 | 0d | 17 | 0.56mi |
| 1018 N Olive St San Antonio, TX | 3.0 | 2.0 | 1600 | $1,495 | $0.93 | 45d | 1 | 0.57mi |
| 1102 Burleson San Antonio, TX | 3.0 | 2.0 | 1400 | $2,500 | $1.79 | 26d | 1 | 0.70mi |
| 1136 E Euclid Ave San Antonio, TX | 3.0 | 2.5 | 1635 | $3,200 | $1.96 | 6d | 1 | 0.71mi |
| 210 W Josephine St San Antonio, TX | 3.0 | 1.0–2.0 | 912 | $3,400 | $3.73 | 0d | 28 | 0.75mi |
| 1010 Burnet St San Antonio, TX | 3.0 | 2.5 | 1886 | $1,995 | $1.06 | 6d | 1 | 0.81mi |
| 118 Canadian St San Antonio, TX | 3.0 | 2.0 | 1232 | $2,300 | $1.87 | 45d | 1 | 0.84mi |
| 1223 Hays St San Antonio, TX | 3.0 | 2.5 | 1810 | $2,495 | $1.38 | 26d | 1 | 0.85mi |
| 603 N Mesquite St San Antonio, TX | 3.0 | 2.5 | 1333 | $1,750 | $1.31 | 26d | 1 | 0.87mi |
| 515 Nolan St San Antonio, TX | 4.0 | 2.0 | 1928 | $3,500 | $1.82 | 45d | 1 | 0.87mi |
| 1225 Burnet St Unit 101 San Antonio, TX | 3.0 | 2.0 | 1218 | $1,850 | $1.52 | 45d | 1 | 0.87mi |
| 1817 N Saint Marys St #102 San Antonio, TX | 3.0 | 2.5 | 1865 | $2,850 | $1.53 | 45d | 1 | 0.87mi |
| 1817 N Saint Marys St #502 San Antonio, TX | 3.0 | 2.5 | 1598 | $2,750 | $1.72 | 45d | 1 | 0.87mi |
| 1817 N Saint Marys St #301 San Antonio, TX | 3.0 | 2.5 | 1616 | $2,800 | $1.73 | 45d | 1 | 0.87mi |
| 102 Tendick #305 San Antonio, TX | 3.0 | 2.5 | 1674 | $2,400 | $1.43 | 12d | 1 | 0.88mi |
| 719 E Locust St #4107 San Antonio, TX | 3.0 | 2.5 | 1952 | $3,595 | $1.84 | 0d | 1 | 0.90mi |
| 1414 Burleson San Antonio, TX | 4.0 | 2.0 | 1769 | $2,000 | $1.13 | 45d | 1 | 0.95mi |
| 618 E Evergreen St San Antonio, TX | 3.0 | 2.0 | 1488 | $2,395 | $1.61 | 26d | 1 | 0.96mi |
| 723 E Euclid Ave San Antonio, TX | 3.0 | 1.0 | 1265 | $1,297 | $1.03 | 5d | 1 | 0.96mi |
| 723 E Euclid Ave San Antonio, TX | 3.0 | 1.0 | 1265 | $1,297 | $1.03 | 0d | 1 | 0.96mi |
| 431 N Mesquite St San Antonio, TX | 3.0 | 2.0 | 1220 | $1,750 | $1.43 | 17d | 1 | 0.97mi |
| 1412 Hays St San Antonio, TX | 3.0 | 1.0 | 1250 | $1,495 | $1.20 | 26d | 1 | 0.97mi |
| 423 N Mesquite St San Antonio, TX | 3.0 | 2.5 | 1925 | $1,750 | $0.91 | 14d | 1 | 0.98mi |
| 126 Armour Pl San Antonio, TX | 3.0 | 3.5 | 2080 | $3,600 | $1.73 | 26d | 1 | 0.99mi |
| 115 Saint Charles San Antonio, TX | 3.0 | 2.0 | 1680 | $2,050 | $1.22 | 13d | 1 | 1.00mi |
| 302 Tendick #1103 San Antonio, TX | 3.0 | 3.5 | 1842 | $2,400 | $1.30 | 0d | 1 | 1.02mi |
| 411 Ira Ave San Antonio, TX | 3.0 | 3.5 | 1865 | $2,375 | $1.27 | 45d | 1 | 1.03mi |
| 323 Gabriel Unit 1 101 San Antonio, TX | 3.0 | 2.5 | 1400 | $1,950 | $1.39 | 26d | 1 | 1.04mi |
| 323 Gabriel San Antonio, TX | 3.0 | 2.0 | 1400 | $1,950 | $1.39 | 24d | 1 | 1.04mi |
| 400 Eleanor Ave San Antonio, TX | 3.0 | 2.0 | 1630 | $1,825 | $1.12 | 6d | 1 | 1.04mi |
| 418 Lockhart St Unit 1 San Antonio, TX | 4.0 | 2.0 | 1479 | $1,590 | $1.08 | 45d | 1 | 1.05mi |
| 418 Lockhart San Antonio, TX | 4.0 | 2.0 | 1479 | $1,799 | $1.22 | 24d | 1 | 1.05mi |
| 311 E Evergreen St San Antonio, TX | 3.0 | 2.5 | 1382 | $2,295 | $1.66 | 45d | 1 | 1.18mi |
| 519 E Ashby Pl San Antonio, TX | 3.0 | 2.0 | 1218 | $2,500 | $2.05 | 45d | 1 | 1.19mi |
HOA detail
- Monthly dues
- $60 · $720/yr
Listing history 2 events
-
2026-04-10status Pending
-
2026-04-06$250,950 New
ⓘ Source: listings_history table (triggers on properties + properties_extension) + one-shot
backfill from property_details.listing_events for pre-trigger history.
Nearby sold comps map
Loading sold comps map…
Walkable amenities ~0.75 mi
Loading nearby amenities…
Taxation est. · year 1
- Rental income
- $28,557
- − Mortgage interest
- −$14,057
- − Property taxes
- −$3,764
- − Insurance
- −$1,255
- − Repairs & maintenance
- −$2,285
- − Management
- −$2,285
- − HOA
- −$720
- − Depreciation
- −$7,300
- Taxable loss
- −$3,108
- Est. tax savings @ 24.0%
- +$746
- After-tax cash flow
- $1,775/yr
For passive investors: Depreciation is non-cash, so a rental often shows a tax loss while cash-flowing — sheltering income. Rental losses are passive: they offset passive income freely, and up to $25,000/yr can offset ordinary (W-2) income if you actively participate and your MAGI is under $100k (phasing out to $0 by $150k); unused losses carry forward. On sale, claimed depreciation is recaptured at up to 25%, and gains may owe capital-gains tax (a 1031 exchange can defer both). Figures are a year-1 estimate at your 24.0% rate — not tax advice; consult a CPA.
Condition & rehab AI · 12 photos
This single-family home in San Antonio, TX is in good condition with a well-maintained exterior and interior. It offers a spacious floor plan with a gourmet kitchen and two bathrooms. The home is located in a desirable neighborhood with community amenities such as a pool and playground. The property is move-in ready and would benefit from some minor updates to the exterior and interior to further enhance its curb appeal and value.
Value-add opportunities
- Resale Painting exterior siding — Enhances curb appeal
- Resale Landscaping front yard — Improves curb appeal
- Resale Replace kitchen faucet — Modernizes kitchen and adds value
- Resale Replace bathroom faucet — Modernizes bathroom and adds value
Renovation cost estimate screening
Value-add ROI direction
- Resale Painting exterior siding — Enhances curb appeal ↑
- Resale Landscaping front yard — Improves curb appeal ↑
- Resale Replace kitchen faucet — Modernizes kitchen and adds value ↑
- Resale Replace bathroom faucet — Modernizes bathroom and adds value ↑
ⓘ Cost ranges are severity-bucket heuristics (US national rule-of-thumb). Get contractor quotes + a written scope before underwriting a rehab budget.
Schools (NCES district)
- District
- San Antonio ISD
- NCES district ID
- 4838730
- Math proficiency
- 12% ▼ -21.00%
- Reading proficiency
- 22% ▼ -7.00%
- Median HH income
- $30,952
- Composite
- 13.57/100
- National rank
- #9512
- State rank
- #805 of 826 in TX
Livability — San Antonio
- Score
- 80/100
- State rank
- #31
- US rank
- #1616
Category grades
Schools grade is shown separately in the Schools card above.
Census & demographics
- Census place
- San Antonio, TX
- County
- Bexar County · 1,990,555 people
- City population
- 1,806,925
- Metro
- San Antonio-New Braunfels, TX
- Population (ZIP)
- 69,282
- Household income
- $106,373
- Rent vs Own
- Severe rent burden
- 1496.0
Population outlook (Bexar County) Hauer SSP2
- Today (2025)
- 2,336,851 people
- By 2030
- 2,560,728 · +9.6%
- By 2040
- 3,020,569 · +29.3%
- By 2050
- 3,493,522 · +49.5%
- By 2075
- 4,668,459 · +99.8%
- By 2100
- 5,533,242 · +136.8%
Race, ethnicity, and origin ACS 2023
- Neighborhood character
- Diverse neighborhood (Simpson 0.65)
- Race & ethnicity
- Hispanic / Latino 47% White 34% Two or more races 27% Black 9% Asian 4% Native American 2%
- Hispanic origin (detail)
- Mexican 38% Puerto Rican 3%
- Common ancestry
- Italian 2% Lithuanian 1% Romanian 1%
- Foreign-born
- 9% · Canada
- Languages at home
- 73% English-only · Spanish 22% Other Asian/Pacific 1% Tagalog/Filipino 1%
Political lean MEDSL · Bexar
- 2024 margin
- Lean D (+9.8) · D 54.3% · R 44.6% · Other 1.1%
- 2008→2024 swing
- +4.2pp toward D · 2008: 5.6pp · 2024: 9.8pp
- All cycles
- 2024: D+9.8 2020: D+18.2 2016: D+13.5 2012: D+4.6 2008: D+5.6
Not yet ingested
- Civics
- —
Market trends
- HPI YoY
- ▼ -99.92%
- Current HPI
- 199.1827
- Rent YoY
- ▼ -1.10%
- Metro
- San Antonio-New Braunfels, TX
- State GDP YoY
- ▲ 3.95%
- F500 in state
- 110
Industry mix (Fortune 500 HQ in TX)
| Industry | F500 HQs | Revenue |
|---|---|---|
| Energy | 16 | $1,198B |
|
||
| Technology | 5 | $198B |
|
||
| Engineering / Construction | 4 | $72B |
|
||
| Energy Services | 3 | $60B |
|
||
| Utilities | 3 | $41B |
|
||
| Healthcare | 2 | $330B |
|
||
Price history
2 events — show timeline
- 2026-04-10 Pending — LERA
- 2026-04-06 Listed $250,950 LERA
Cash-flow waterfall
monthlySold comps — $/sqft
last 12 mo · ≤1 miLoading sold comps…