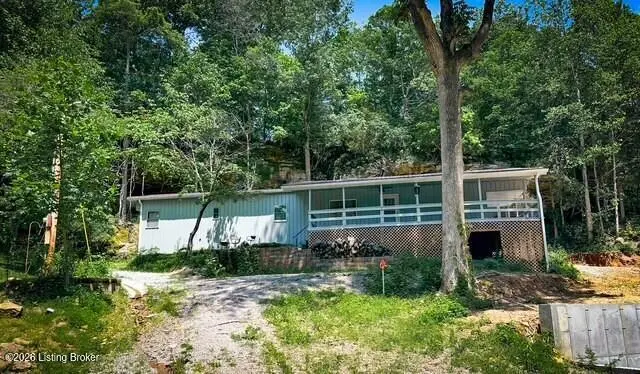
2199 Eveleigh Rd · Leitchfield, KY
Flood risk 1/10 · Minimal
- FEMA flood zone
- X (unshaded)
- Chance of flooding over 30 yrs
- 0.0%
- Est. flood insurance / yr
- $507 – $1,088
Fire risk 4/10 · Minor
- Est. fire insurance / yr
- $839 – $1,559
Heat risk 4/10 · Minor
- Hot days now (above 105°F)
- 7 days/yr
- Hot days in 30 yrs
- 18 days/yr
Wind risk 2/10 · Minimal
- Chance of severe wind over 30 yrs
- 4.0%
Air-quality risk 2/10 · Minimal
- Unhealthy air days now
- 1 days/yr
- Unhealthy air days in 30 yrs
- 1 days/yr
Risk factors via First Street. Map © Google.
Why this score? — see what drove the D- grade
The composite is a weighted blend of 9 inputs, each scored 0–100. Each bar is that input's sub-score; the figure is the points it added to the 100-point composite (weight × sub-score).
- Cash flow +11.2/30.0
- ARV discount +7.5/15.0
- Livability +3.6/5.0
- 1% rule +3.3/10.0
- DSCR +3.3/10.0
- Appreciation +3.1/10.0
- Schools +2.8/10.0
- Rent growth +2.5/5.0
- Condition / age +2.5/5.0
$179,900
🖨 Deal sheet 📄 Offer letter ✓ Due diligence
Listing remarks
Whether you're looking for a weekend getaway, full-time residence, or investment opportunity, this furnished and move-in-ready property checks all the boxes. Conveniently located just 1/8 mile from Eveleigh Boat Ramp, you'll enjoy quick and easy access to Rough River Lake for boating, fishing, and summer fun. The home offers 3 bedrooms plus a fourth bonus room that could serve as a small bedroom, home office, nursery, or flex space. Nestled in a peaceful, scenic setting surrounded by nature, it's the perfect place to relax after a day on the lake. All furnishings will remain, making this a true turn-key property with excellent short-term rental/Airbnb potential. Whether you're seeking perso
Key facts
- 0.43 acre lot
- Parking
- Built 1980
Property features AI
Finance
- Other: Lot size approximately 0.43 acres
- HOA & community: No association fee; Located in the Cascade Acres subdivision
Exterior
- Parking: Driveway
- Utilities: Electricity connected
- Home design: Single-family residence; Other architectural style; One-story home; Built in 1980
- Construction: Aluminum siding; Metal roof; Built in 1980
- Exterior features: Wooded lot; Additional land/acreage
Interior
- Kitchen: Kitchen on the first floor; Dining room on the first floor
- Bedrooms: 3 bedrooms (all on the first floor)
- Bathrooms: 1 full bathroom (on the first floor)
- Heating & cooling: Electric heating; Heat pump; Central air conditioning
- Interior features: 7 total rooms; No basement
- Laundry & utility: Laundry room on the first floor; First-floor laundry
Neighborhood map
What this means for you Summary
Snapshot
- This is a 3-bed/1.0-bath manufactured listed at $180k.
Deal economics
- At list price, monthly cash flow is $-69 ($-826/yr) — negative.
- To cash-flow at today's rent, offer at most $170k (5.5% below list).
- To meet the 1% rule (rent ≥ 1% of price), the offer needs to be $149k (17.4% below list).
- Recommended offer: $149k (17.4% below list) — sets the bar for 1% rule.
- Cap rate 5.8% vs local median 4.3% in Leitchfield — top-decile yield for the area; either an underpriced asset or a hidden risk that comps aren't pricing in. Stress-test before assuming the spread holds.
Location & tenants
- Location reads 71/100 on livability (#144 in KY) — a middle-class / working-renter tenant base. Strengths: crime A+, cost of living A+, housing A+; Watch: schools C-, amenities F, commute F.
- Grayson County (rural): math 27% / reading 40% proficiency, ranked #84 of 165 in KY (top 51%) — families likely to look elsewhere, expect single-tenant / working-renter base with shorter leases.
- Market conditions: 180 active listings in the ZIP; 23 units permitted in Grayson County in 2024 (12 in 5+ unit buildings).
Forward outlook
- Local home prices are declining (-3.0%/yr); year-one equity from $1k of loan paydown is wiped out by about $5k of value loss. Plan a longer hold.
Negotiation context
- Only 1 days on market — expect competitive offers; lowballing is unlikely to land.
- 2 sale attempts since 22y ago with the ask held roughly flat each time — persistent listings suggest the price (not the market) is what's stuck; bring a comps-based counter.
Questions for the listing agent
- What do current leases actually rent for vs. the listed asking? Can we see a recent rent roll and the last 12 months of T-12 income?
- Is there a deadline driving the sale (1031 exchange, divorce, estate, relocation)? That informs how much negotiation room exists.
- The area grade is low — what's the realistic commute time and amenity access for the typical tenant pool here? Any planned neighborhood developments (good or bad) we should know about?
- What's the average days-on-market for RENTAL listings here right now (not sales)? A rising rental-DOM trend means longer vacancies and softer asking-rent achievability than the comps imply.
- What's the recent tenant-quality profile in this submarket — average credit score on applications, eviction rate, late-payment / NSF rate, and stable-employment percentage? A property-management company in the area should have these aggregated.
- How much new for-sale + rental construction is in the pipeline within 1–3 miles? Heavy new supply typically softens prices + rents 12–24 months out; constrained supply supports both.
Investment metrics
- 1% rule
- 0.83% ✗
- Cap rate
- 5.83%
- Cash-on-cash
- -1.64%
- DSCR
- 0.93
- GRM
- 10.1
CMA / ARV
No comps found within radius.
Projected returns pro-forma
-3.0% appreciation · 3.0% rent growth · sell at horizon
- IRR
- -19.0%
- Equity multiple
- 0.33×
- Total profit
- $-33,511
- Equity at exit
- $26,824
- IRR
- -11.5%
- Equity multiple
- 0.31×
- Total profit
- $-34,731
- Equity at exit
- $15,554
Cash invested: $50,372 (down + closing). Projections, not guarantees.
Landlord ↔ Tenant lean methodology
- Overall (STATE)
- 83 Strongly Landlord-Friendly
- State Kentucky
- 83 Strongly Landlord-Friendly · R+16
- County
- — inherits STATE
- City
- — inherits STATE
ZIP-level market 42754
- Home prices YoY
- -1.3%
- Active inventory
- 180
- Price-to-rent
- 10.1×
Monthly cashflow live
- Estimated rent
- $1,487 medium interval (Pro) →
- Mortgage (P&I)
- −$943
- Tax est. 1.5%
- −$225 /mo · $2,698/yr
- Insurance
- −$75
- HOA
- −$0
- Vacancy / Maint / Mgmt
- −$312
- Net cashflow
- $-69
Break-even live
UW: 25.0% down · 7.5% · 30yr · 1.5% tax · 5.0% vac · 8.0% maint · 8.0% mgmt
Financing live
Cash to close
- Down payment
- $44,975
- Closing costs
- $5,397
- Reserves months
- —
- Total cash needed
- —
Loan-product check · same deal, 3 products live
Conventional
25% down · 7.5% · 30yr
- Down + closing
- —
- Monthly P&I
- —
- Monthly cashflow
- —
- DSCR
- —
- Eligible?
- —
Personal DTI + credit; lowest rate.
DSCR
20% down · 8.5% · 30yr
- Down + closing
- —
- Monthly P&I
- —
- Monthly cashflow
- —
- DSCR
- —
- Eligible?
- —
No personal income docs; deal must DSCR.
Hard money
10% down · 12.0% · 12mo
- Down + closing
- —
- Monthly P&I
- —
- Monthly cashflow
- —
- DSCR
- —
- Eligible?
- —
Short-term bridge; refi at stabilization.
Listing history 10 events
-
2026-06-18days on market $179,900 Active 1 DOM
-
2026-06-16days on market $179,900 Active 11 DOM
-
2026-06-15days on market $179,900 Active 10 DOM
-
2026-06-13days on market $179,900 Active 8 DOM
-
2026-06-12days on market $179,900 Active 7 DOM
-
2026-06-09days on market $179,900 Active 4 DOM
-
2026-06-08days on market $179,900 Active 3 DOM
-
2026-06-07days on market $179,900 Active 2 DOM
-
2026-06-07remarks 699-char remark
-
2026-06-07$179,900 Active 1 DOM
ⓘ Source: listings_history table (triggers on properties + properties_extension) + one-shot
backfill from property_details.listing_events for pre-trigger history.
Climate risk First Street
- Flood 1/10 Low FEMA zone X (unshaded) · 0% chance over 30 yrs
- Wildfire 4/10 Moderate
- Heat 4/10 Moderate 7 d/yr ≥105°F today · 18 d/yr by 30 yrs out
- Wind 2/10 Low 4% chance of damaging wind over 30 yrs
- Air quality 2/10 Low 1 unhealthy d/yr today · 1 by 30 yrs out
Nearby sold comps map
Loading sold comps map…
Walkable amenities ~0.75 mi
Loading nearby amenities…
Taxation est. · year 1
- Rental income
- $17,840
- − Mortgage interest
- −$10,077
- − Property taxes
- −$2,698
- − Insurance
- −$900
- − Repairs & maintenance
- −$1,427
- − Management
- −$1,427
- − Depreciation
- −$5,233
- Taxable loss
- −$3,923
- Est. tax savings @ 24.0%
- +$942
- After-tax cash flow
- $116/yr
For passive investors: Depreciation is non-cash, so a rental often shows a tax loss while cash-flowing — sheltering income. Rental losses are passive: they offset passive income freely, and up to $25,000/yr can offset ordinary (W-2) income if you actively participate and your MAGI is under $100k (phasing out to $0 by $150k); unused losses carry forward. On sale, claimed depreciation is recaptured at up to 25%, and gains may owe capital-gains tax (a 1031 exchange can defer both). Figures are a year-1 estimate at your 24.0% rate — not tax advice; consult a CPA.
Schools (NCES district)
- District
- Grayson County
- NCES district ID
- 2102300
- Math proficiency
- 27% ▼ -23.00%
- Reading proficiency
- 40% ▼ -17.00%
- Median HH income
- $34,256
- Composite
- 27.55/100
- National rank
- #6944
- State rank
- #84 of 165 in KY
Livability — Leitchfield
- Score
- 71/100
- State rank
- #144
- US rank
- #6810
Category grades
Schools grade is shown separately in the Schools card above.
Census & demographics
- City population
- 15,817
- Population (ZIP)
- 15,817
Population outlook (Grayson County) Hauer SSP2
- Today (2025)
- 26,840 people
- By 2030
- 27,032 · +0.7%
- By 2040
- 27,236 · +1.5%
- By 2050
- 27,076 · +0.9%
- By 2075
- 26,565 · -1.0%
- By 2100
- 24,007 · -10.6%
Race, ethnicity, and origin ACS 2023
- Neighborhood character
- Predominantly White (95%)
- Race & ethnicity
- White 95% Two or more races 3% Black 2%
- Common ancestry
- Slovak 4% Lithuanian 2% Romanian 1%
- Foreign-born
- 1%
- Languages at home
- 99% English-only · Spanish 1%
Political lean MEDSL · Grayson
- 2024 margin
- Solid R (+61.8) · D 18.5% · R 80.3% · Other 1.2%
- 2008→2024 swing
- -26.9pp toward R · 2008: -34.9pp · 2024: -61.8pp
- All cycles
- 2024: R+61.8 2020: R+58.8 2016: R+59.3 2012: R+39.5 2008: R+34.9
Not yet ingested
- Civics
- —
Market trends
- HPI YoY
- ▼ -3.82%
- Current HPI
- 283.0264
- Rent YoY
- —
- Metro
- —
- State GDP YoY
- ▲ 1.81%
- F500 in state
- 4
Industry mix (Fortune 500 HQ in KY)
| Industry | F500 HQs | Revenue |
|---|---|---|
| Healthcare | 1 | $118B |
|
||
| Food / Beverage | 1 | $7B |
|
||
Price history
+554.2% since first listed3 events — show timeline
- 2026-06-04 Listed $179,900 Metro Search MLS
- 2004-08-16 Listing Removed — Metro Search MLS
- 2004-02-16 Listed $27,500 Metro Search MLS
Cash-flow waterfall
monthlySold comps — $/sqft
last 12 mo · ≤1 miLoading sold comps…