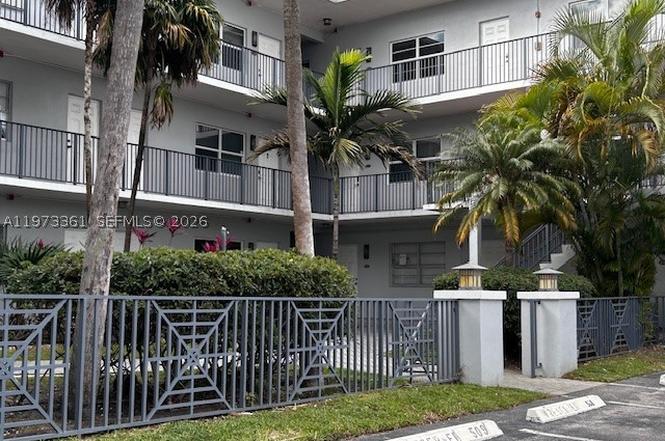
2200 S Ocean Dr Unit N102 · Hollywood, FL
Flood risk No data
- FEMA flood zone
- —
- Chance of flooding over 30 yrs
- —
- Est. flood insurance / yr
- —
Fire risk No data
- Est. fire insurance / yr
- —
Heat risk No data
- Hot days now (above threshold)
- —
- Hot days in 30 yrs
- —
Wind risk No data
- Chance of severe wind over 30 yrs
- —
Air-quality risk No data
- Unhealthy air days now
- —
- Unhealthy air days in 30 yrs
- —
Risk factors via First Street. Map © Google.
Why this score? — see what drove the C- grade
The composite is a weighted blend of 9 inputs, each scored 0–100. Each bar is that input's sub-score; the figure is the points it added to the 100-point composite (weight × sub-score).
- Cash flow +18.2/30.0
- 1% rule +8.3/10.0
- ARV discount +7.5/15.0
- DSCR +5.7/10.0
- Schools +4.1/10.0
- Livability +3.8/5.0
- Rent growth +3.2/5.0
- Condition / age +2.5/5.0
- Appreciation +0.0/10.0
$335,000
🖨 Deal sheet (PDF) 📄 Offer letter ✓ Due diligence
Listing remarks
Welcome to your dream condo in Hollywood! This stunning unit features 2 bedrooms, 2 bathrooms, and a plethora of luxurious amenities. Step inside to find granite counters, tile flooring, and stainless steel appliances in the completely remodeled kitchen. The spacious living area boasts a garden view and overlooks the Intracoastal, providing a serene and picturesque backdrop. Step outside to enjoy the in-ground pool, BBQ area, and lush landscaping that surrounds the property. Just steps from Hollywood beach, you can easily spend your days soaking up the sun and enjoying the ocean breeze. Stay active and fit in the on-site fitness center, or simply relax and unwind in this peaceful oasis. Wit
Key facts
- In-ground pool
- Garden view
- Bbq area
Tags
Property features AI
Finance
- Financial info: Pets allowed with restrictions or conditions
- HOA & community: Monthly association fee; Association fee includes management, amenities, common area maintenance, grounds maintenance, parking, pools, recreation facilities, reserve fund, sewer, and trash; Community amenities: Fitness center, laundry facilities, elevators
Exterior
- Parking: One assigned parking space
- Security: Complex is fenced
- Utilities: Sewer included in association; Trash service included in association; Electric service
- Home design: 3-story building; Entry level: 1; Resale property
- Construction: Block construction
- Exterior features: Courtyard; Barbecue area; Fenced property; Intracoastal access (waterfront)
Interior
- Kitchen: Dishwasher; Electric range; Microwave; Refrigerator; Icemaker
- Bedrooms: Bedroom on main level
- Flooring: Tile
- Bathrooms: 2 full bathrooms
- Heating & cooling: Central air; Ceiling fans; Electric heating
- Interior features: First-floor entry; Primary bedroom on main level; Split bedroom layout
- Laundry & utility: Common area laundry; Electric water heater
Neighborhood map
What this means for you Summary
Snapshot
- This is a 2-bed/2.0-bath condo listed at $335k.
Deal economics
- At list price, monthly cash flow is $302 ($4k/yr) — positive.
- The deal already cash-flows at list — no discount required.
- Meets the 1% rule at list price ($4k rent vs $335k).
- Recommended offer: $305k (9.0% below list) — sets the bar for market timing.
- Cap rate 7.4% vs local median 3.2% in Hollywood — top-decile yield for the area; either an underpriced asset or a hidden risk that comps aren't pricing in. Stress-test before assuming the spread holds.
Location & tenants
- Location reads 76/100 on livability (#232 in FL, #3,548 nationally) — a middle-class / working-renter tenant base. Strengths: commute A+, housing A+, crime B+; Watch: amenities D.
- Broward (suburban): math 42% / reading 53% proficiency, ranked #46 of 73 in FL (top 63%) — families likely to look elsewhere, expect single-tenant / working-renter base with shorter leases.
- Market conditions: Rents rising (+2.9%/yr); 828 active listings in the ZIP; 40 comparable units currently listed for rent nearby; rentals at typical pace (median 15d on market — plan ~3-4 weeks tenant-placement turnaround); solid renter incomes; 2,111 units permitted in Broward County in 2024 (1,265 in 5+ unit buildings).
- At $4,444/mo this rent would consume 55% of the median local household income ($96k/yr) (locally 563% of renters already pay >50% of income on rent) — very limited rent-growth headroom before tenants either downsize or default.
Forward outlook
- Local home prices are declining (-3.0%/yr); year-one equity from $2k of loan paydown is wiped out by about $10k of value loss. Plan a longer hold.
- Broward County population projected at +34% by 2050 — long-run rental-demand tailwind backs the buy-and-hold thesis.
Negotiation context
- It's been on market 111 days — a 9% lower offer ($305k) is reasonable based on typical stale-listing flexibility.
Questions for the listing agent
- It's been on market 111 days. Have you received any prior offers? Is the seller open to a 9% concession, seller financing, or rate buy-down credit?
- What does the HOA fee cover, when was the last increase, and are there any pending special assessments or reserve-fund shortfalls?
- Any open or pending special assessments — roof, HVAC, plumbing, elevator, façade? What's the per-unit balance and payoff schedule, and is the seller paying it off at close or rolling it to the buyer?
- Why hasn't it sold? Are there any deal-killer items the seller is aware of (foundation, flood, title, zoning, code violations)?
- Is there a deadline driving the sale (1031 exchange, divorce, estate, relocation)? That informs how much negotiation room exists.
- What's the average days-on-market for RENTAL listings here right now (not sales)? A rising rental-DOM trend means longer vacancies and softer asking-rent achievability than the comps imply.
- What's the recent tenant-quality profile in this submarket — average credit score on applications, eviction rate, late-payment / NSF rate, and stable-employment percentage? A property-management company in the area should have these aggregated.
- How much new apartment / multifamily construction is in the pipeline within 1–3 miles? Heavy new supply (>2% of stock underway) typically softens rents 12–24 months out; light construction supports rent growth.
Investment metrics
- 1% rule
- 1.33% ✓
- Cap rate
- 7.37%
- Cash-on-cash
- 3.86%
- DSCR
- 1.17
- GRM
- 6.3
CMA / ARV
No comps found within radius.
Projected returns pro-forma
-3.0% appreciation · 2.92% rent growth · sell at horizon
- IRR
- -10.2%
- Equity multiple
- 0.63×
- Total profit
- $-34,814
- Equity at exit
- $49,950
- IRR
- -0.7%
- Equity multiple
- 0.95×
- Total profit
- $-4,537
- Equity at exit
- $28,965
Cash invested: $93,800 (down + closing). Projections, not guarantees.
Landlord ↔ Tenant lean methodology
- Overall (STATE)
- 87 Strongly Landlord-Friendly
- State Florida
- 87 Strongly Landlord-Friendly · R+3
- County
- — inherits STATE
- City
- — inherits STATE
ZIP-level market 33019
- Rents YoY
- 2.9%
- Active inventory
- 828
- Price-to-rent
- 6.3×
Monthly cashflow live
- Estimated rent
- $4,444 high interval (Pro) →
- Mortgage (P&I)
- −$1,757
- Tax from tax record
- −$485 /mo · $5,819/yr
- Insurance
- −$140
- HOA
- −$828
- Vacancy / Maint / Mgmt
- −$933
- Net cashflow
- $302
Break-even live
Sensitivity live
| Price | -10% $491 | -5% $396 | +0% $302 | +5% $207 | +10% $112 |
|---|---|---|---|---|---|
| Rent | -10% $-49 | -5% $126 | +0% $302 | +5% $477 | +10% $653 |
| Rate | -1.0pp $470 | -0.5pp $387 | base $302 | +0.5pp $215 | +1.0pp $127 |
UW: 25.0% down · 7.5% · 30yr · 1.5% tax · 5.0% vac · 8.0% maint · 8.0% mgmt
Financing live
Cash to close
- Down payment
- $83,750
- Closing costs
- $10,050
- Reserves months
- —
- Total cash needed
- —
Loan-product check · same deal, 3 products live
Conventional
25% down · 7.5% · 30yr
- Down + closing
- —
- Monthly P&I
- —
- Monthly cashflow
- —
- DSCR
- —
- Eligible?
- —
Personal DTI + credit; lowest rate.
DSCR
20% down · 8.5% · 30yr
- Down + closing
- —
- Monthly P&I
- —
- Monthly cashflow
- —
- DSCR
- —
- Eligible?
- —
No personal income docs; deal must DSCR.
Hard money
10% down · 12.0% · 12mo
- Down + closing
- —
- Monthly P&I
- —
- Monthly cashflow
- —
- DSCR
- —
- Eligible?
- —
Short-term bridge; refi at stabilization.
Rent comps 40 comps
| Address | Beds | Baths | Sqft | Rent | $/sqft | DOM | Units | Dist |
|---|---|---|---|---|---|---|---|---|
| 2101 S Ocean Dr #1201 Hollywood, FL | 2.0 | 2.0 | 1270 | $4,200 | $3.31 | 24d | 1 | 0.08mi |
| 2401 S Ocean Dr #1405 Hollywood, FL | 2.0 | 2.0 | 1250 | $4,250 | $3.40 | 24d | 1 | 0.09mi |
| 2201 S Ocean Dr #1507 Hollywood, FL | 2.0 | 2.0 | 1350 | $5,000 | $3.70 | 24d | 1 | 0.10mi |
| 2201 S Ocean Dr #2001 Hollywood, FL | 2.0 | 2.0 | 1400 | $3,800 | $2.71 | 14d | 1 | 0.10mi |
| 2301 S Ocean Dr #2003 Hollywood, FL | 2.0 | 2.0 | 1400 | $5,500 | $3.93 | 24d | 1 | 0.14mi |
| 2301 S Ocean Dr #2507 Hollywood, FL | 2.0 | 2.0 | 1240 | $4,300 | $3.47 | 24d | 1 | 0.14mi |
| 2301 S Ocean Dr #607 Hollywood, FL | 2.0 | 2.0 | 1240 | $4,000 | $3.23 | 24d | 1 | 0.14mi |
| 2501 S Ocean Dr Hollywood, FL | 1.0–2.0 | 1.0–2.0 | 971 | $5,800 | $5.97 | 11d | 6 | 0.16mi |
| 2501 S Ocean Dr Hollywood, FL | 1.0–2.0 | 1.0–2.0 | 971 | $5,400 | $5.56 | 8d | 7 | 0.16mi |
| 2501 S Ocean Dr Hollywood, FL | 1.0–2.0 | 1.0–2.0 | 971 | $5,800 | $5.97 | 14d | 7 | 0.16mi |
| 2501 S Ocean Dr Hollywood, FL | 1.0–2.0 | 1.0–2.0 | 971 | $5,800 | $5.97 | 20d | 8 | 0.16mi |
| 2751 S Ocean Dr Unit 1706S Hollywood, FL | 2.0 | 2.0 | 1360 | $5,000 | $3.68 | 24d | 1 | 0.25mi |
| 2751 S Ocean Dr Unit 1705 Hollywood, FL | 2.0 | 2.0 | 1360 | $5,000 | $3.68 | 8d | 1 | 0.25mi |
| 3001 S Ocean Dr #1211 Hollywood, FL | 2.0 | 2.0 | 1208 | $4,750 | $3.93 | 8d | 1 | 0.31mi |
| 3001 S Ocean Dr #1211 Hollywood, FL | 2.0 | 2.0 | 1208 | $4,750 | $3.93 | 24d | 1 | 0.31mi |
| 3505 S Ocean Dr Hollywood, FL | 1.0–2.0 | 1.5–2.0 | 1085 | $6,500 | $5.99 | 13d | 17 | 0.40mi |
| 3505 S Ocean Dr Hollywood, FL | 1.0–2.0 | 1.5–2.0 | 1085 | $6,500 | $5.99 | 10d | 18 | 0.40mi |
| 3505 S Ocean Dr Unit 1049820P Hollywood, FL | 1.0 | 1.0 | 785 | $4,827 | $6.15 | 3d | 1 | 0.40mi |
| 2500 Parkview Dr #2518 Hallandale Beach, FL | 2.0 | 2.0 | 1280 | $4,000 | $3.12 | 14d | 1 | 0.55mi |
| 2500 Parkview Dr #2518 Hallandale Beach, FL | 2.0 | 2.0 | 1280 | $4,000 | $3.12 | 8d | 1 | 0.55mi |
| 809 S Ocean Dr Unit 1227349P Hollywood, FL | 2.0 | 1.0 | 990 | $3,768 | $3.81 | 14d | 1 | 0.58mi |
| 330 Madison St Hollywood, FL | 2.0 | 2.0 | 1200 | $3,500 | $2.92 | 24d | 1 | 0.60mi |
| 3725 S Ocean Dr Hollywood, FL | 2.0–3.0 | 2.0 | 1377 | $4,000 | $2.90 | 3d | 7 | 0.62mi |
| 3725 S Ocean Dr Hollywood, FL | 2.0–3.0 | 2.0 | 1377 | $4,000 | $2.90 | 14d | 8 | 0.62mi |
| 3725 S Ocean Dr Hollywood, FL | 2.0–3.0 | 2.0 | 1454 | $4,000 | $2.75 | 24d | 6 | 0.62mi |
| 3725 S Ocean Dr Unit 1339235P Hollywood, FL | 2.0 | 2.0 | 1248 | $5,429 | $4.35 | 3d | 1 | 0.62mi |
| 3801 S Ocean Dr Unit 4R Hollywood, FL | 1.0 | 1.0 | 812 | $3,850 | $4.74 | 24d | 1 | 0.68mi |
| 3801 S Ocean Dr Unit 7X Hollywood, FL | 2.0 | 1.5 | 1236 | $3,800 | $3.07 | 24d | 1 | 0.68mi |
| 3801 S Ocean Dr Unit 7O Hollywood, FL | 2.0 | 2.0 | 1173 | $5,000 | $4.26 | 24d | 1 | 0.68mi |
| 3801 S Ocean Dr Unit 10V Hollywood, FL | 2.0 | 2.0 | 1176 | $4,300 | $3.66 | 24d | 1 | 0.68mi |
| 3801 S Ocean Dr Unit 7O Hollywood, FL | 2.0 | 2.0 | 1173 | $5,000 | $4.26 | 5d | 1 | 0.68mi |
| 300 Oregon St #601 Hollywood, FL | 2.0 | 2.0 | 1050 | $4,000 | $3.81 | 24d | 1 | 0.68mi |
| 3800 S Ocean Dr Hollywood, FL | 2.0 | 2.0 | 1302 | $3,750 | $2.88 | 4d | 3 | 0.69mi |
| 3800 S Ocean Dr Hollywood, FL | 2.0 | 2.0 | 1301 | $3,775 | $2.90 | 5d | 2 | 0.69mi |
| 3800 S Ocean Dr #1818 Hollywood, FL | 2.0 | 2.0 | 1270 | $4,200 | $3.31 | 8d | 1 | 0.69mi |
| 3800 S Ocean Dr #1818 Hollywood, FL | 2.0 | 2.0 | 1270 | $3,800 | $2.99 | 5d | 1 | 0.69mi |
| 3901 S Ocean Dr Unit 8E Hollywood, FL | 2.0 | 2.0 | 1355 | $5,500 | $4.06 | 24d | 1 | 0.75mi |
| 3901 S Ocean Dr Unit 1227197P Hollywood, FL | 1.0–2.0 | 1.0–2.0 | 1054 | $3,820 | $3.62 | 2d | 2 | 0.75mi |
| 3901 S Ocean Dr Unit 10Z Hollywood, FL | 1.0 | 1.0 | 874 | $4,000 | $4.58 | 24d | 1 | 0.75mi |
| 3901 S Ocean Dr Unit 14E Hollywood, FL | 2.0 | 2.0 | 1355 | $4,500 | $3.32 | 24d | 1 | 0.75mi |
HOA detail condo
- Monthly dues
- $828 · $9,936/yr
- Likely covers
- landscapingpoolgym
- Assessments
- None detected in remarks — confirm with the listing agent.
Listing history 13 events
-
2026-06-18days on market $335,000 Active 111 DOM
-
2026-06-17days on market $335,000 Active 110 DOM
-
2026-06-16days on market $335,000 Active 109 DOM
-
2026-06-15days on market $335,000 Active 108 DOM
-
2026-06-13days on market $335,000 Active 106 DOM
-
2026-06-09days on market $335,000 Active 102 DOM
-
2026-06-07pricedays on market $335,000 Active 100 DOM
-
2026-06-04days on market $350,000 Active 97 DOM
-
2026-06-03days on market $350,000 Active 96 DOM
-
2026-06-02days on market $350,000 Active 95 DOM
-
2026-06-01days on market $350,000 Active 94 DOM
-
2026-05-31days on market $350,000 Active 93 DOM
-
2026-02-27$350,000 Active
ⓘ Source: listings_history table (triggers on properties + properties_extension) + one-shot
backfill from property_details.listing_events for pre-trigger history.
Tax reassessment forecast FL · Resets to sale price
- Current annual tax
- $5,819 · $485/mo
- Projected year-2 tax
- $5,819 · $485/mo
- Expected delta
- $0/yr ($0/mo · 0.0%)
ⓘ Screening estimate from a state-policy table — verify with the county assessor before closing.
Nearby sold comps map
Loading sold comps map…
Walkable amenities ~0.75 mi
Loading nearby amenities…
Taxation est. · year 1
- Rental income
- $53,330
- − Mortgage interest
- −$18,765
- − Property taxes
- −$5,819
- − Insurance
- −$1,675
- − Repairs & maintenance
- −$4,266
- − Management
- −$4,266
- − HOA
- −$9,936
- − Depreciation
- −$9,745
- Taxable loss
- −$1,143
- Est. tax savings @ 24.0%
- +$274
- After-tax cash flow
- $3,894/yr
For passive investors: Depreciation is non-cash, so a rental often shows a tax loss while cash-flowing — sheltering income. Rental losses are passive: they offset passive income freely, and up to $25,000/yr can offset ordinary (W-2) income if you actively participate and your MAGI is under $100k (phasing out to $0 by $150k); unused losses carry forward. On sale, claimed depreciation is recaptured at up to 25%, and gains may owe capital-gains tax (a 1031 exchange can defer both). Figures are a year-1 estimate at your 24.0% rate — not tax advice; consult a CPA.
Schools (NCES district)
- District
- Broward
- NCES district ID
- 1200180
- Math proficiency
- 42% ▼ -18.00%
- Reading proficiency
- 53% ▼ -5.00%
- Median HH income
- $52,139
- Composite
- 40.88/100
- National rank
- #3621
- State rank
- #46 of 73 in FL
Livability — Hollywood
- Score
- 76/100
- State rank
- #232
- US rank
- #3548
Category grades
Schools grade is shown separately in the Schools card above.
Census & demographics
- Census place
- Hollywood, FL
- County
- Broward County · 1,963,430 people
- City population
- 109,079
- Metro
- Miami-Fort Lauderdale-Pompano Beach, FL
- Population (ZIP)
- 14,293
- Household income
- $96,497
- Rent vs Own
- Severe rent burden
- 563.0
Population outlook (Broward County) Hauer SSP2
- Today (2025)
- 2,207,033 people
- By 2030
- 2,360,704 · +7.0%
- By 2040
- 2,661,208 · +20.6%
- By 2050
- 2,946,698 · +33.5%
- By 2075
- 3,602,273 · +63.2%
- By 2100
- 3,970,984 · +79.9%
Race, ethnicity, and origin ACS 2023
- Neighborhood character
- Majority White (61%)
- Race & ethnicity
- White 61% Hispanic / Latino 32% Two or more races 25% Black 2%
- Hispanic origin (detail)
- Puerto Rican 2% Cuban 6% Salvadoran 2%
- Common ancestry
- Scotch-Irish 7% Romanian 4% Lithuanian 4%
- Foreign-born
- 43% · Canada, Jamaica, Dominican Republic
- Languages at home
- 53% English-only · Spanish 30% Russian/Polish/Slavic 6% Other Indo-European 4%
Political lean MEDSL · Broward
- 2024 margin
- D (+17.0) · D 58.0% · R 41.0%
- 2008→2024 swing
- -17.8pp toward R · 2008: 34.7pp · 2024: 17.0pp
- All cycles
- 2024: D+17.0 2020: D+29.8 2016: D+35.0 2012: D+34.9 2008: D+34.7
Not yet ingested
- Civics
- —
Market trends
- HPI YoY
- ▼ -434.82%
- Current HPI
- 307.2922
- Rent YoY
- ▲ 2.92%
- Metro
- Miami-Fort Lauderdale-Pompano Beach, FL
- State GDP YoY
- ▲ 3.28%
- F500 in state
- 36
Industry mix (Fortune 500 HQ in FL)
| Industry | F500 HQs | Revenue |
|---|---|---|
| Industrial Technology | 2 | $29B |
|
||
| Insurance | 2 | $17B |
|
||
| Retail | 1 | $60B |
|
||
| Technology Distribution | 1 | $58B |
|
||
| Homebuilding | 1 | $35B |
|
||
| Technology Manufacturing | 1 | $35B |
|
||
Price history
1 event — show timeline
- 2026-02-27 Listed $350,000 MARMLS
Property tax history
+8.9%/yrLatest (2025): $5,819 · +2.0% YoY. Source: county tax records.
Cash-flow waterfall
monthlySold comps — $/sqft
last 12 mo · ≤1 miLoading sold comps…