485 idyllwild Dr #25 · San Jacinto, CA
Flood risk 3/10 · Minor
- FEMA flood zone
- X
- Chance of flooding over 30 yrs
- 0.2%
- Est. flood insurance / yr
- $507 – $1,088
Fire risk 7/10 · Major
- Est. fire insurance / yr
- $659 – $1,223
Heat risk 8/10 · Major
- Hot days now (above 103°F)
- 7 days/yr
- Hot days in 30 yrs
- 19 days/yr
Wind risk 1/10 · Minimal
- Chance of severe wind over 30 yrs
- —
Air-quality risk 6/10 · Moderate
- Unhealthy air days now
- 12 days/yr
- Unhealthy air days in 30 yrs
- 14 days/yr
Risk factors via First Street. Map © Google.
Why this score? — see what drove the B- grade
The composite is a weighted blend of 9 inputs, each scored 0–100. Each bar is that input's sub-score; the figure is the points it added to the 100-point composite (weight × sub-score).
- Cash flow +30.0/30.0
- 1% rule +10.0/10.0
- DSCR +10.0/10.0
- ARV discount +7.5/15.0
- Condition / age +4.0/5.0
- Rent growth +3.2/5.0
- Livability +3.2/5.0
- Schools +2.1/10.0
- Appreciation +0.0/10.0
$135,000
🖨 Deal sheet (PDF) 📄 Offer letter ✓ Due diligence
Listing remarks
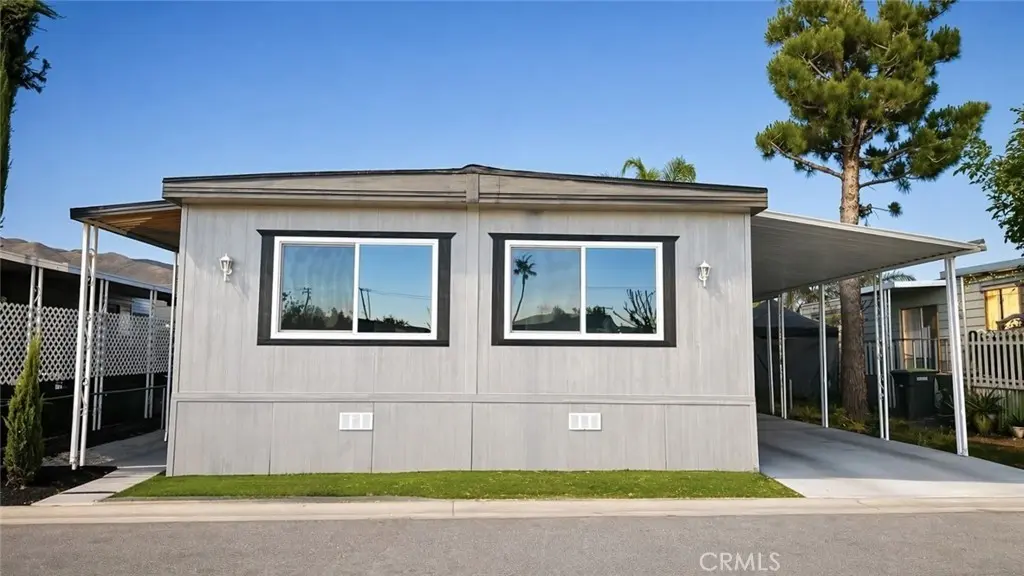
Welcome to this beautifully updated manufactured home located in a desirable all-ages community directly across from San Jacinto High School. This spacious home features 3 bedrooms and 2 bathrooms, a comfortable and functional layout. Recent upgrades include newly renovated flooring and fresh interior paint, giving the home a clean, modern feel. The kitchen opens to the living area and showcases a beautiful center island, ample cabinetry, and updated finishes—perfect for cooking, entertaining, and everyday living. Additional highlights include an indoor laundry area for added convenience. The community offers a basketball court and is pet-friendly. Conveniently located near shopping c
Key facts
- Indoor laundry area
- Basketball court
- Fresh interior paint
Tags
Property features AI
Finance
- Other: Manager approval required for tenancy; Pets: contact for rules
- Financial info: Rent includes gas, electric, trash and water
- HOA & community: Land lease community (Mountain View Mobil Park); Land lease approximately $1,000 monthly (seller provided)
Exterior
- Parking: Carport; Parked within Mountain View Mobil Park
- Utilities: Public sewer; District/Public water
- Home design: Single-story mobile home (Double body type); Mobile home remains on property; Entry at level 1; Facing and entry location not specified
- Construction: Mobile home approximately 24 ft by 65 ft; Built year source: public records
- Exterior features: Community pool; Gutters
Interior
- Bathrooms: 2 full bathrooms
- Interior features: One-level home
- Laundry & utility: Washer hookup; Laundry available
Neighborhood map
What this means for you Summary
Snapshot
- This is a 3-bed/2.0-bath manufactured listed at $135k. Condition is rated good.
Deal economics
- At list price, monthly cash flow is $1k ($14k/yr) — positive.
- The deal already cash-flows at list — no discount required.
- Meets the 1% rule at list price ($3k rent vs $135k).
- Recommended offer: $131k (3.0% below list) — sets the bar for market timing.
- Cap rate 16.4% vs local median 3.8% in San Jacinto — top-decile yield for the area; either an underpriced asset or a hidden risk that comps aren't pricing in. Stress-test before assuming the spread holds.
Location & tenants
- Location reads 63/100 on livability (#467 in CA) — a middle-class / working-renter tenant base. Strengths: housing A+; Watch: employment D+, amenities F, cost of living F.
- San Jacinto Unified (suburban): math 13% / reading 36% proficiency, ranked #421 of 517 in CA (top 81%) — low school quality limits family demand, transient renter base, plan for 1-2y turnover; 68% free/reduced lunch — lower-income household profile, screen leases tightly.
- Zoned schools: Clayton A. Record Jr. Elementary (math 10% / reading 30%, grade F, #1,242 of 1,571 statewide, top 80%, 551 students, 81% FRL); Monte Vista Middle (math 24% / reading 24%, grade F, #277 of 498 statewide, top 73%, 913 students, 87% FRL); San Jacinto High (math 14% / reading 38%, grade F, #807 of 1,170 statewide, top 69%, 2,617 students, 85% FRL) — zoned schools average 84% FRL vs 68% district-wide (17 pts higher); higher-poverty schools than district average — tighter screening recommended.
- Market conditions: Rents rising (+2.6%/yr); 160 active listings in the ZIP; 14 comparable units currently listed for rent nearby; rentals at typical pace (median 27d on market — plan ~3-4 weeks tenant-placement turnaround); 9,195 units permitted in Riverside County in 2024 (1,512 in 5+ unit buildings).
- At $2,623/mo this rent would consume 46% of the median local household income ($68k/yr) (locally 747% of renters already pay >50% of income on rent) — very limited rent-growth headroom before tenants either downsize or default.
Forward outlook
- Local home prices are declining (-3.0%/yr); year-one equity from $933 of loan paydown is wiped out by about $4k of value loss. Plan a longer hold.
- Riverside County population projected at +22% by 2050 — long-run rental-demand tailwind backs the buy-and-hold thesis.
- At projected returns (-3.0% appreciation + 2.6% rent growth), your $38k cash investment doubles in ~4 years — after that, you're playing with house money.
Negotiation context
- It's been on market 60 days — a 3% lower offer ($131k) is reasonable based on typical stale-listing flexibility.
Risks & watch-outs
- Climate carrying-cost: major wildfire risk; extreme-heat days projected 7→19/yr by 2055 (HVAC capex compounding) — expect insurance premiums to compound above CPI over the hold.
Questions for the listing agent
- It's been on market 60 days. Have you received any prior offers? Is the seller open to a 3% concession, seller financing, or rate buy-down credit?
- Built in 1970 — when were the roof, HVAC, electrical panel, plumbing, and water heater last replaced?
- Is there a deadline driving the sale (1031 exchange, divorce, estate, relocation)? That informs how much negotiation room exists.
- Schools are D-rated, which usually means shorter tenancies and higher turnover. Who's the typical renter profile here, and what's been the actual vacancy rate?
- What's the average days-on-market for RENTAL listings here right now (not sales)? A rising rental-DOM trend means longer vacancies and softer asking-rent achievability than the comps imply.
- What's the recent tenant-quality profile in this submarket — average credit score on applications, eviction rate, late-payment / NSF rate, and stable-employment percentage? A property-management company in the area should have these aggregated.
- How much new for-sale + rental construction is in the pipeline within 1–3 miles? Heavy new supply typically softens prices + rents 12–24 months out; constrained supply supports both.
Investment metrics
- 1% rule
- 1.94% ✓
- Cap rate
- 16.42%
- Cash-on-cash
- 36.16%
- DSCR
- 2.61
- GRM
- 4.3
CMA / ARV
- ARV (median comp)
- $384,232
- List price
- $135,000
- Delta
- -64.86%
- Verdict
- UNDERPRICED
- Comps
- 5 within 1.0 mi
Show comp detail 8 sales within ~0.75 mi
| Address | Dist | Beds/Ba | Sqft | Sold | Price | $/sf | Match |
|---|---|---|---|---|---|---|---|
| 485 Idyllwild Dr #57 | 0.07mi | 4/2.0 (+1) | 1,440 (-8%) | 10mo | $172,000 | $119 | 70 |
| 770 Porterfield Dr | 0.60mi | 3/2.0 | 1,554 (-0%) | 10mo | $390,000 | $251 | 63 |
| 927 Marcy | 0.61mi | 3/2.0 | 1,500 (-4%) | 3mo | $402,900 | $269 | 63 |
| 335 E Mead | 0.71mi | 3/2.0 | 1,426 (-9%) | 5mo | $385,000 | $270 | 48 |
| 204 N La Paloma Ave | 0.71mi | 2/2.0 (-1) | 1,440 (-8%) | 6mo | $224,000 | $156 | 44 |
| 207 Flora Vista St | 0.71mi | 3/2.0 | 1,340 (-14%) | 17mo | $229,850 | $172 | 29 |
| 750 Porterfield Dr | 0.61mi | 2/2.0 (-1) | 1,344 (-14%) | 22mo | $314,000 | $234 | 25 |
| 350 Potrero St | 0.74mi | 2/2.0 (-1) | 1,344 (-14%) | 24mo | $227,000 | $169 | 18 |
Match score weights: distance 35% · size 25% · config 20% · recency 20%. Top-matched comps best support the ARV.
Projected returns pro-forma
-3.0% appreciation · 2.61% rent growth · sell at horizon
- IRR
- 31.5%
- Equity multiple
- 2.31×
- Total profit
- $49,692
- Equity at exit
- $20,129
- IRR
- 38.4%
- Equity multiple
- 4.51×
- Total profit
- $132,681
- Equity at exit
- $11,672
Cash invested: $37,800 (down + closing). Projections, not guarantees.
Landlord ↔ Tenant lean methodology
- Overall (STATE)
- 18 Strongly Tenant-Friendly
- State California
- 18 Strongly Tenant-Friendly · D+13
- County
- — inherits STATE
- City
- — inherits STATE
ZIP-level market 92583
- Home prices YoY
- -14.8%
- Rents YoY
- 2.6%
- Active inventory
- 160
- Price-to-rent
- 4.3×
Monthly cashflow live
- Estimated rent
- $2,623 high interval (Pro) →
- Mortgage (P&I)
- −$708
- Tax est. 1.5%
- −$169 /mo · $2,025/yr
- Insurance
- −$56
- HOA
- −$0
- Vacancy / Maint / Mgmt
- −$551
- Net cashflow
- $1,139
Break-even live
Sensitivity live
| Price | -10% $1,232 | -5% $1,186 | +0% $1,139 | +5% $1,093 | +10% $1,046 |
|---|---|---|---|---|---|
| Rent | -10% $932 | -5% $1,036 | +0% $1,139 | +5% $1,243 | +10% $1,346 |
| Rate | -1.0pp $1,207 | -0.5pp $1,173 | base $1,139 | +0.5pp $1,104 | +1.0pp $1,069 |
UW: 25.0% down · 7.5% · 30yr · 1.5% tax · 5.0% vac · 8.0% maint · 8.0% mgmt
Financing live
Cash to close
- Down payment
- $33,750
- Closing costs
- $4,050
- Reserves months
- —
- Total cash needed
- —
Loan-product check · same deal, 3 products live
Conventional
25% down · 7.5% · 30yr
- Down + closing
- —
- Monthly P&I
- —
- Monthly cashflow
- —
- DSCR
- —
- Eligible?
- —
Personal DTI + credit; lowest rate.
DSCR
20% down · 8.5% · 30yr
- Down + closing
- —
- Monthly P&I
- —
- Monthly cashflow
- —
- DSCR
- —
- Eligible?
- —
No personal income docs; deal must DSCR.
Hard money
10% down · 12.0% · 12mo
- Down + closing
- —
- Monthly P&I
- —
- Monthly cashflow
- —
- DSCR
- —
- Eligible?
- —
Short-term bridge; refi at stabilization.
Rent comps 14 comps
| Address | Beds | Baths | Sqft | Rent | $/sqft | DOM | Units | Dist |
|---|---|---|---|---|---|---|---|---|
| 643 Laxford Rd San Jacinto, CA | 3.0 | 2.5 | 1967 | $2,600 | $1.32 | 17d | 1 | 0.08mi |
| 165 Tiger Ln San Jacinto, CA | 2.0 | 2.0 | 1339 | $2,150 | $1.61 | 5d | 1 | 0.26mi |
| 475 W Camellia Way San Jacinto, CA | 4.0 | 2.5 | 1933 | $3,275 | $1.69 | 45d | 1 | 0.49mi |
| 289 Brown St San Jacinto, CA | 2.0 | 1.0 | 1400 | $2,300 | $1.64 | 45d | 1 | 0.69mi |
| 1344 Sierra Seneca Dr San Jacinto, CA | 2.0 | 2.0 | 1100 | $2,000 | $1.82 | 7d | 1 | 0.74mi |
| 148 N Palomar Ave San Jacinto, CA | 2.0 | 2.0 | 1368 | $1,152 | $0.84 | 26d | 1 | 0.75mi |
| 646 Field Maple Pl GLMN HOT SPGS, CA | 3.0–4.0 | 2.0–3.0 | 1825 | $2,850 | $1.56 | 0d | 9 | 0.79mi |
| 492 Foursquare Pl San Jacinto, CA | 3.0 | 2.0 | 1573 | $3,500 | $2.23 | 0d | 1 | 0.92mi |
| 1066 Birch Ln San Jacinto, CA | 3.0 | 2.0 | 1785 | $2,600 | $1.46 | 7d | 1 | 1.12mi |
| 994 Autumn Mist Ln San Jacinto, CA | 4.0 | 3.0 | 1973 | $2,850 | $1.44 | 26d | 1 | 1.14mi |
| 621 S Mistletoe Ave San Jacinto, CA | 2.0 | 2.0 | 1500 | $2,000 | $1.33 | 45d | 1 | 1.15mi |
| 1106 Don Carlos Ct San Jacinto, CA | 3.0 | 2.0 | 1389 | $2,999 | $2.16 | 45d | 1 | 1.21mi |
| 1410 Cottonwood Ave San Jacinto, CA | 2.0 | 1.5 | 1257 | $2,300 | $1.83 | 45d | 1 | 1.41mi |
| 640 E Shaver St San Jacinto, CA | 4.0 | 3.0 | 2160 | $2,750 | $1.27 | 26d | 1 | 1.47mi |
Listing history 17 events
-
2026-06-21days on market $135,000 Active 60 DOM
-
2026-06-18days on market $135,000 Active 57 DOM
-
2026-06-17days on market $135,000 Active 56 DOM
-
2026-06-16days on market $135,000 Active 55 DOM
-
2026-06-15days on market $135,000 Active 54 DOM
-
2026-06-13days on market $135,000 Active 52 DOM
-
2026-06-13days on market $135,000 Active 51 DOM
-
2026-06-09days on market $135,000 Active 48 DOM
-
2026-06-08days on market $135,000 Active 47 DOM
-
2026-06-07days on market $135,000 Active 46 DOM
-
2026-06-04days on market $135,000 Active 43 DOM
-
2026-06-03days on market $135,000 Active 42 DOM
-
2026-06-02days on market $135,000 Active 41 DOM
-
2026-06-02price $135,000 Active 40 DOM
-
2026-06-01days on market $145,000 Active 40 DOM
-
2026-05-31days on market $145,000 Active 39 DOM
-
2026-04-22$145,000 Active 887-char remark
ⓘ Source: listings_history table (triggers on properties + properties_extension) + one-shot
backfill from property_details.listing_events for pre-trigger history.
Climate risk First Street
- Flood 3/10 Moderate FEMA zone X · 20% chance over 30 yrs
- Wildfire 7/10 Severe
- Heat 8/10 Severe 7 d/yr ≥103°F today · 19 d/yr by 30 yrs out
- Wind 1/10 Low
- Air quality 6/10 Major 12 unhealthy d/yr today · 14 by 30 yrs out
Nearby sold comps map
Loading sold comps map…
Walkable amenities ~0.75 mi
Loading nearby amenities…
Taxation est. · year 1
- Rental income
- $31,475
- − Mortgage interest
- −$7,562
- − Property taxes
- −$2,025
- − Insurance
- −$675
- − Repairs & maintenance
- −$2,518
- − Management
- −$2,518
- − Depreciation
- −$3,927
- Taxable income
- $12,250
- Est. tax owed @ 24.0%
- −$2,940
- After-tax cash flow
- $10,730/yr
For passive investors: Depreciation is non-cash, so a rental often shows a tax loss while cash-flowing — sheltering income. Rental losses are passive: they offset passive income freely, and up to $25,000/yr can offset ordinary (W-2) income if you actively participate and your MAGI is under $100k (phasing out to $0 by $150k); unused losses carry forward. On sale, claimed depreciation is recaptured at up to 25%, and gains may owe capital-gains tax (a 1031 exchange can defer both). Figures are a year-1 estimate at your 24.0% rate — not tax advice; consult a CPA.
Condition & rehab AI · 4 photos
This beautifully updated manufactured home in a desirable community offers a good condition with recent renovations and a clean, modern aesthetic. It is move-in ready with minor updates that could further enhance its value.
Value-add opportunities
- Both Painting exterior and interior walls — Fresh paint enhances curb appeal and interior aesthetics.
- Both Landscaping improvements — Enhances curb appeal and adds value to the property.
- Resale Kitchen appliances — Modern appliances improve functionality and attract potential buyers.
- Resale Bathroom fixtures — Upgraded fixtures enhance the bathroom's appeal and functionality.
Renovation cost estimate screening
Value-add ROI direction
- Both Painting exterior and interior walls — Fresh paint enhances curb appeal and interior aesthetics. ↑
- Both Landscaping improvements — Enhances curb appeal and adds value to the property. ↑
- Resale Kitchen appliances — Modern appliances improve functionality and attract potential buyers. ↑
- Resale Bathroom fixtures — Upgraded fixtures enhance the bathroom's appeal and functionality. ↑
ⓘ Cost ranges are severity-bucket heuristics (US national rule-of-thumb). Get contractor quotes + a written scope before underwriting a rehab budget.
Schools (NCES district)
- District
- San Jacinto Unified
- NCES district ID
- 0634440
- Math proficiency
- 13% ▼ -9.00%
- Reading proficiency
- 36% ▬ 0.00%
- Median HH income
- $43,560
- Composite
- 20.94/100
- National rank
- #8478
- State rank
- #421 of 517 in CA
Livability — San Jacinto
- Score
- 63/100
- State rank
- #467
- US rank
- #15889
Category grades
Schools grade is shown separately in the Schools card above.
Census & demographics
- Census place
- San Jacinto, CA
- County
- Riverside County · 2,287,001 people
- City population
- 33,778
- Metro
- Riverside-San Bernardino-Ontario, CA
- Population (ZIP)
- 33,778
- Household income
- $68,351
- Rent vs Own
- Severe rent burden
- 747.0
Population outlook (Riverside County) Hauer SSP2
- Today (2025)
- 2,664,475 people
- By 2030
- 2,802,692 · +5.2%
- By 2040
- 3,050,904 · +14.5%
- By 2050
- 3,256,783 · +22.2%
- By 2075
- 3,655,058 · +37.2%
- By 2100
- 3,766,594 · +41.4%
Race, ethnicity, and origin ACS 2023
- Neighborhood character
- Diverse neighborhood (Simpson 0.57)
- Race & ethnicity
- Hispanic / Latino 60% White 26% Two or more races 23% Black 5% Asian 3% Native American 3%
- Hispanic origin (detail)
- Mexican 52%
- Common ancestry
- Lithuanian 1% Iranian 1% Portuguese 1%
- Foreign-born
- 20% · Canada
- Languages at home
- 56% English-only · Spanish 40% Tagalog/Filipino 2% Other Asian/Pacific 1%
Political lean MEDSL · Riverside
- 2024 margin
- Toss-up / Even · D 48.0% · R 49.3% · Other 2.6%
- 2008→2024 swing
- -3.6pp toward R · 2008: 2.3pp · 2024: -1.3pp
- All cycles
- 2024: R+1.3 2020: D+8.0 2016: D+4.3 2012: R+0.4 2008: D+2.3
Not yet ingested
- Civics
- —
Market trends
- HPI YoY
- ▼ -71.15%
- Current HPI
- 407.8584
- Rent YoY
- ▲ 2.61%
- Metro
- Riverside-San Bernardino-Ontario, CA
- State GDP YoY
- ▲ 3.21%
- F500 in state
- 116
Industry mix (Fortune 500 HQ in CA)
| Industry | F500 HQs | Revenue |
|---|---|---|
| Technology | 27 | $1,492B |
|
||
| Financial Services | 3 | $174B |
|
||
| Retail | 3 | $44B |
|
||
| Insurance | 3 | $26B |
|
||
| Media / Entertainment | 2 | $115B |
|
||
| Pharmaceuticals / Biotech | 2 | $62B |
|
||
Price history
-6.9% since first listed2 events — show timeline
- 2026-06-02 Price Changed $135,000 CRMLS
- 2026-04-22 Listed $145,000 CRMLS
Cash-flow waterfall
monthlySold comps — $/sqft
last 12 mo · ≤1 miLoading sold comps…