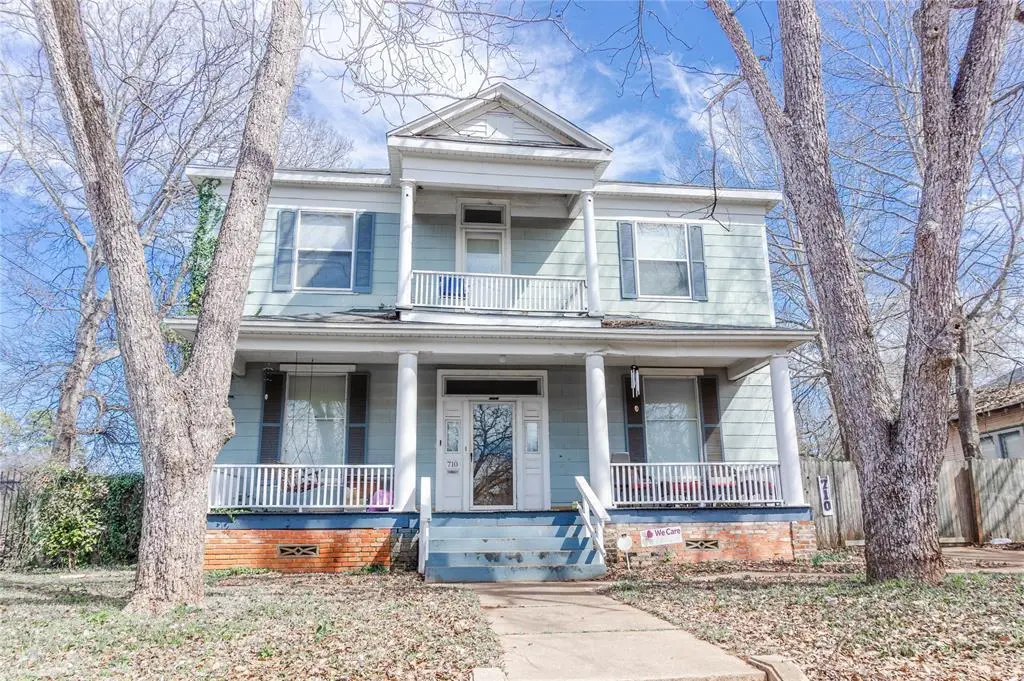
710 S Magnolia St · Palestine, TX
Flood risk 1/10 · Minimal
- FEMA flood zone
- X (unshaded)
- Chance of flooding over 30 yrs
- 0.0%
- Est. flood insurance / yr
- $507 – $1,088
Fire risk 4/10 · Minor
- Est. fire insurance / yr
- $1,222 – $2,270
Heat risk 7/10 · Major
- Hot days now (above 111°F)
- 7 days/yr
- Hot days in 30 yrs
- 26 days/yr
Wind risk 6/10 · Moderate
- Chance of severe wind over 30 yrs
- 74.0%
Air-quality risk 1/10 · Minimal
- Unhealthy air days now
- 0 days/yr
- Unhealthy air days in 30 yrs
- 0 days/yr
Risk factors via First Street. Map © Google.
Why this score? — see what drove the D grade
The composite is a weighted blend of 9 inputs, each scored 0–100. Each bar is that input's sub-score; the figure is the points it added to the 100-point composite (weight × sub-score).
- ARV discount +15.0/15.0
- Cash flow +9.9/30.0
- 1% rule +4.5/10.0
- Livability +3.3/5.0
- Schools +3.0/10.0
- DSCR +2.8/10.0
- Rent growth +2.5/5.0
- Condition / age +2.5/5.0
- Appreciation +0.0/10.0
$208,000
🖨 Deal sheet (PDF) 📄 Offer letter ✓ Due diligence
Listing remarks MLS
Motivated to sell (Seller Financing is Available) this 5-bedroom, 2-bathroom home is being offered below market value, presenting a great opportunity for homeowners or investors! The home features mostly original hardwood floors, adding warmth and character to the space. Enjoy a spacious backyard, perfect for outdoor gatherings, gardening, or creating your own private retreat. With five bedrooms, there is plenty of room to spread out and make this home your own. Opportunities like this don't come around often - schedule your showing today before its gone! Excludes: Piano, dining table and items in the garage.
Key facts
- Spacious backyard
- 0.38 acre lot
- 3 garage spots
Tags
Neighborhood map
What this means for you Summary
Snapshot
- This is a 5-bed/2.5-bath single-family listed at $208k.
Deal economics
- At list price, monthly cash flow is $-129 ($-2k/yr) — negative.
- To cash-flow at today's rent, offer at most $185k (11.0% below list).
- To meet the 1% rule (rent ≥ 1% of price), the offer needs to be $197k (5.1% below list).
- Recommended offer: $183k (12.0% below list) — sets the bar for market timing.
- Cap rate 5.5% vs local median 3.9% in Palestine — top-decile yield for the area; either an underpriced asset or a hidden risk that comps aren't pricing in. Stress-test before assuming the spread holds.
Location & tenants
- Location reads 66/100 on livability (#657 in TX) — a middle-class / working-renter tenant base. Strengths: cost of living A+, housing A+; Watch: crime D+, employment D, amenities F.
- Palestine ISD (town): math 36% / reading 37% proficiency, ranked #509 of 826 in TX (top 62%) — families likely to look elsewhere, expect single-tenant / working-renter base with shorter leases; 67% free/reduced lunch — lower-income household profile, screen leases tightly.
- Zoned schools: Northside Pri (465 students, 80% FRL); Story Int (math 32% / reading 31%, grade F, #997 of 1,662 statewide, top 61%, 673 students, 80% FRL); Palestine H S (math 44% / reading 41%, grade F, #721 of 1,632 statewide, top 45%, 998 students, 77% FRL).
- Market conditions: 201 active listings in the ZIP; 29 units permitted in Anderson County in 2024 (0 in 5+ unit buildings).
- This rent runs 42% of the median local income ($57k/yr) — at the standard rent-burdened threshold; future hikes will face affordability resistance.
Forward outlook
- Local home prices are declining (-3.0%/yr); year-one equity from $1k of loan paydown is wiped out by about $6k of value loss. Plan a longer hold.
- Anderson County population projected at +4% by 2050 — modest demand growth; plan on rents tracking national, not racing it.
Negotiation context
- It's been on market 263 days — a 12% lower offer ($183k) is reasonable based on typical stale-listing flexibility.
- 2 sale attempts; this cycle's ask has dropped $17k (8%) from the opening price — seller is motivated, your offer sets the floor, not the list.
Risks & watch-outs
- Watch-outs: property tax is 2.9% of price; built in 1910 — expect roof / HVAC / electrical / plumbing capex.
- Climate carrying-cost: major wind risk, 74% chance of damaging wind over 30y; extreme-heat days projected 7→26/yr by 2055 (HVAC capex compounding) — expect insurance premiums to compound above CPI over the hold.
Questions for the listing agent
- What do current leases actually rent for vs. the listed asking? Can we see a recent rent roll and the last 12 months of T-12 income?
- It's been on market 263 days. Have you received any prior offers? Is the seller open to a 12% concession, seller financing, or rate buy-down credit?
- Built in 1910 — when were the roof, HVAC, electrical panel, plumbing, and water heater last replaced?
- Property tax is high relative to price — has the assessment been appealed recently, and will the sale trigger a re-assessment?
- Why hasn't it sold? Are there any deal-killer items the seller is aware of (foundation, flood, title, zoning, code violations)?
- Is there a deadline driving the sale (1031 exchange, divorce, estate, relocation)? That informs how much negotiation room exists.
- Schools are D-rated, which usually means shorter tenancies and higher turnover. Who's the typical renter profile here, and what's been the actual vacancy rate?
- Crime grade is D in this area — have there been break-ins, vandalism, or insurance claims at this property in the last 3 years? What carrier currently insures it and at what premium?
- The area grade is low — what's the realistic commute time and amenity access for the typical tenant pool here? Any planned neighborhood developments (good or bad) we should know about?
- What's the average days-on-market for RENTAL listings here right now (not sales)? A rising rental-DOM trend means longer vacancies and softer asking-rent achievability than the comps imply.
- What's the recent tenant-quality profile in this submarket — average credit score on applications, eviction rate, late-payment / NSF rate, and stable-employment percentage? A property-management company in the area should have these aggregated.
- How much new for-sale + rental construction is in the pipeline within 1–3 miles? Heavy new supply typically softens prices + rents 12–24 months out; constrained supply supports both.
Investment metrics
- 1% rule
- 0.95% ✗
- Cap rate
- 5.55%
- Cash-on-cash
- -2.66%
- DSCR
- 0.88
- GRM
- 8.8
CMA / ARV
- ARV (median comp)
- $265,900
- List price
- $208,000
- Delta
- -21.78%
- Verdict
- UNDERPRICED
- Comps
- 7 within 1.0 mi
Projected returns pro-forma
-3.0% appreciation · 3.0% rent growth · sell at horizon
- IRR
- -20.6%
- Equity multiple
- 0.28×
- Total profit
- $-41,735
- Equity at exit
- $31,013
- IRR
- -13.6%
- Equity multiple
- 0.21×
- Total profit
- $-46,172
- Equity at exit
- $17,984
Cash invested: $58,240 (down + closing). Projections, not guarantees.
Landlord ↔ Tenant lean methodology
- Overall (STATE)
- 87 Strongly Landlord-Friendly
- State Texas
- 87 Strongly Landlord-Friendly · R+5
- County
- — inherits STATE
- City
- — inherits STATE
ZIP-level market 75801
- Home prices YoY
- -35.0%
- Active inventory
- 201
- Price-to-rent
- 8.8×
Monthly cashflow live
- Estimated rent
- $1,974 medium interval (Pro) →
- Mortgage (P&I)
- −$1,091
- Tax from tax record
- −$511 /mo · $6,131/yr
- Insurance
- −$87
- HOA
- −$0
- Vacancy / Maint / Mgmt
- −$415
- Net cashflow
- $-129
Break-even live
Sensitivity live
| Price | -10% $-11 | -5% $-70 | +0% $-129 | +5% $-188 | +10% $-247 |
|---|---|---|---|---|---|
| Rent | -10% $-285 | -5% $-207 | +0% $-129 | +5% $-51 | +10% $27 |
| Rate | -1.0pp $-24 | -0.5pp $-76 | base $-129 | +0.5pp $-183 | +1.0pp $-238 |
UW: 25.0% down · 7.5% · 30yr · 1.5% tax · 5.0% vac · 8.0% maint · 8.0% mgmt
Financing live
Cash to close
- Down payment
- $52,000
- Closing costs
- $6,240
- Reserves months
- —
- Total cash needed
- —
Loan-product check · same deal, 3 products live
Conventional
25% down · 7.5% · 30yr
- Down + closing
- —
- Monthly P&I
- —
- Monthly cashflow
- —
- DSCR
- —
- Eligible?
- —
Personal DTI + credit; lowest rate.
DSCR
20% down · 8.5% · 30yr
- Down + closing
- —
- Monthly P&I
- —
- Monthly cashflow
- —
- DSCR
- —
- Eligible?
- —
No personal income docs; deal must DSCR.
Hard money
10% down · 12.0% · 12mo
- Down + closing
- —
- Monthly P&I
- —
- Monthly cashflow
- —
- DSCR
- —
- Eligible?
- —
Short-term bridge; refi at stabilization.
Listing history 24 events
-
2026-06-22days on market $208,000 Active 263 DOM
-
2026-06-21days on market $208,000 Active 262 DOM
-
2026-06-19days on market $208,000 Active 260 DOM
-
2026-06-18days on market $208,000 Active 259 DOM
-
2026-06-17days on market $208,000 Active 258 DOM
-
2026-06-16days on market $208,000 Active 257 DOM
-
2026-06-15days on market $208,000 Active 256 DOM
-
2026-06-14days on market $208,000 Active 254 DOM
-
2026-06-12days on market $208,000 Active 253 DOM
-
2026-06-09days on market $208,000 Active 250 DOM
-
2026-06-08days on market $208,000 Active 249 DOM
-
2026-06-07pricedays on market $208,000 Active 248 DOM
-
2026-06-04days on market $225,000 Active 244 DOM
-
2026-06-02days on market $225,000 Active 243 DOM
-
2026-06-01days on market $225,000 Active 242 DOM
-
2026-05-31days on market $225,000 Active 241 DOM
-
2026-05-31days on market $225,000 Active 240 DOM
-
2025-10-02$225,000 Active 617-char remark
Show marketing remark (617 chars)
Motivated to sell (Seller Financing is Available) this 5-bedroom, 2-bathroom home is being offered below market value, presenting a great opportunity for homeowners or investors! The home features mostly original hardwood floors, adding warmth and character to the space. Enjoy a spacious backyard, perfect for outdoor gatherings, gardening, or creating your own private retreat. With five bedrooms, there is plenty of room to spread out and make this home your own. Opportunities like this don't come around often - schedule your showing today before its gone! Excludes: Piano, dining table and items in the garage.
-
2025-07-17price $325,000
-
2025-06-16price $345,000
-
2025-03-08$355,000 Active
-
2021-06-25soldstatus
-
2015-06-19soldstatus
-
1974-09-20soldstatus
ⓘ Source: listings_history table (triggers on properties + properties_extension) + one-shot
backfill from property_details.listing_events for pre-trigger history.
Tax reassessment forecast TX · Resets to sale price
- Current annual tax
- $6,131 · $511/mo
- Projected year-2 tax
- $6,131 · $511/mo
- Expected delta
- $0/yr ($0/mo · 0.0%)
ⓘ Screening estimate from a state-policy table — verify with the county assessor before closing.
Climate risk First Street
- Flood 1/10 Low FEMA zone X (unshaded) · 0% chance over 30 yrs
- Wildfire 4/10 Moderate
- Heat 7/10 Severe 7 d/yr ≥111°F today · 26 d/yr by 30 yrs out
- Wind 6/10 Major 74% chance of damaging wind over 30 yrs
- Air quality 1/10 Low 0 unhealthy d/yr today · 0 by 30 yrs out
Nearby sold comps map
Loading sold comps map…
Walkable amenities ~0.75 mi
Loading nearby amenities…
Taxation est. · year 1
- Rental income
- $23,686
- − Mortgage interest
- −$11,651
- − Property taxes
- −$6,131
- − Insurance
- −$1,040
- − Repairs & maintenance
- −$1,895
- − Management
- −$1,895
- − Depreciation
- −$6,051
- Taxable loss
- −$4,976
- Est. tax savings @ 24.0%
- +$1,194
- After-tax cash flow
- $-353/yr
For passive investors: Depreciation is non-cash, so a rental often shows a tax loss while cash-flowing — sheltering income. Rental losses are passive: they offset passive income freely, and up to $25,000/yr can offset ordinary (W-2) income if you actively participate and your MAGI is under $100k (phasing out to $0 by $150k); unused losses carry forward. On sale, claimed depreciation is recaptured at up to 25%, and gains may owe capital-gains tax (a 1031 exchange can defer both). Figures are a year-1 estimate at your 24.0% rate — not tax advice; consult a CPA.
Schools (NCES district)
- District
- Palestine ISD
- NCES district ID
- 4834050
- Math proficiency
- 36% ▼ -12.00%
- Reading proficiency
- 37% ▼ -1.00%
- Median HH income
- $36,881
- Composite
- 30.34/100
- National rank
- #6267
- State rank
- #509 of 826 in TX
Livability — Palestine
- Score
- 66/100
- State rank
- #657
- US rank
- #12357
Category grades
Schools grade is shown separately in the Schools card above.
Census & demographics
- Census place
- Palestine, TX
- County
- Anderson County · 17,531 people
- City population
- 17,531
- Metro
- Palestine, TX
- Population (ZIP)
- 17,531
- Household income
- $56,787
- Rent vs Own
- Severe rent burden
- 609.0
Population outlook (Anderson County) Hauer SSP2
- Today (2025)
- 56,663 people
- By 2030
- 57,373 · +1.3%
- By 2040
- 58,960 · +4.1%
- By 2050
- 59,073 · +4.3%
- By 2075
- 53,737 · -5.2%
- By 2100
- 42,516 · -25.0%
Race, ethnicity, and origin ACS 2023
- Neighborhood character
- Diverse neighborhood (Simpson 0.67)
- Race & ethnicity
- White 48% Black 27% Hispanic / Latino 17% Two or more races 15% Native American 3%
- Hispanic origin (detail)
- Mexican 12%
- Common ancestry
- Lithuanian 2% Iranian 1% Slovak 1%
- Foreign-born
- 8% · Canada
- Languages at home
- 85% English-only · Spanish 12%
Political lean MEDSL · Anderson
- 2024 margin
- Solid R (+61.8) · D 18.8% · R 80.6%
- 2008→2024 swing
- -18.3pp toward R · 2008: -43.5pp · 2024: -61.8pp
- All cycles
- 2024: R+61.8 2020: R+58.0 2016: R+58.1 2012: R+52.2 2008: R+43.5
Not yet ingested
- Civics
- —
Market trends
- HPI YoY
- ▼ -83.17%
- Current HPI
- 154.6138
- Rent YoY
- —
- Metro
- Palestine, TX
- State GDP YoY
- ▲ 3.95%
- F500 in state
- 110
Industry mix (Fortune 500 HQ in TX)
| Industry | F500 HQs | Revenue |
|---|---|---|
| Energy | 16 | $1,198B |
|
||
| Technology | 5 | $198B |
|
||
| Engineering / Construction | 4 | $72B |
|
||
| Energy Services | 3 | $60B |
|
||
| Utilities | 3 | $41B |
|
||
| Healthcare | 2 | $330B |
|
||
Price history
-36.6% since first listed7 events — show timeline
- 2025-10-02 Listed $225,000 NTREIS
- 2025-07-17 Price Changed $325,000 NTREIS
- 2025-06-16 Price Changed $345,000 NTREIS
- 2025-03-08 Listed $355,000 NTREIS
- 2021-06-25 Sold (Public Records) — Public Records
- 2015-06-19 Sold (Public Records) — Public Records
- 1974-09-20 Sold (Public Records) — Public Records
Property tax history
+2.9%/yrLatest (2025): $6,131 · +9.7% YoY. Source: county tax records.
Cash-flow waterfall
monthlySold comps — $/sqft
last 12 mo · ≤1 miLoading sold comps…