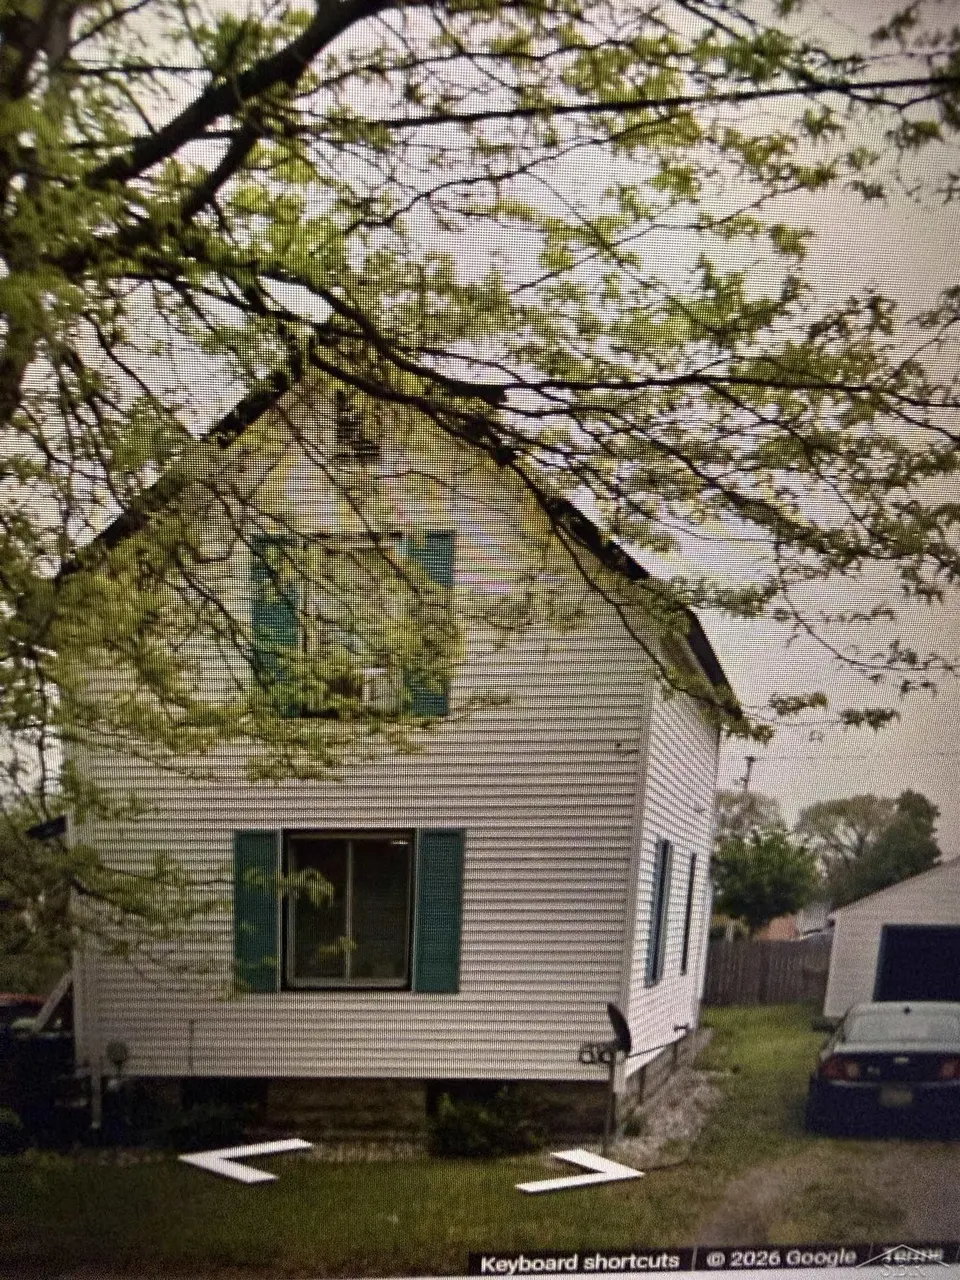
505 S Dean St · Bay City, MI
Flood risk 4/10 · Minor
- FEMA flood zone
- X (unshaded)
- Chance of flooding over 30 yrs
- 0.22%
- Est. flood insurance / yr
- $473 – $860
Fire risk 1/10 · Minimal
- Est. fire insurance / yr
- $784 – $1,456
Heat risk 3/10 · Minor
- Hot days now (above 97°F)
- 7 days/yr
- Hot days in 30 yrs
- 14 days/yr
Wind risk 1/10 · Minimal
- Chance of severe wind over 30 yrs
- —
Air-quality risk 2/10 · Minimal
- Unhealthy air days now
- 1 days/yr
- Unhealthy air days in 30 yrs
- 2 days/yr
Risk factors via First Street. Map © Google.
Why this score? — see what drove the C+ grade
The composite is a weighted blend of 9 inputs, each scored 0–100. Each bar is that input's sub-score; the figure is the points it added to the 100-point composite (weight × sub-score).
- Cash flow +23.7/30.0
- ARV discount +15.0/15.0
- DSCR +7.6/10.0
- 1% rule +6.1/10.0
- Livability +3.4/5.0
- Schools +2.8/10.0
- Rent growth +2.5/5.0
- Condition / age +2.5/5.0
- Appreciation +0.0/10.0
$105,000
🖨 Deal sheet 📄 Offer letter ✓ Due diligence
Listing remarks MLS
MULTI UNIT OFFERED AS PART OF A LARGER PORTFOLIO
Key facts
- 5,000 sq ft lot
- Garage
- Built 1900
Neighborhood map
What this means for you Summary
Snapshot
- This is a 3-bed/2.0-bath single-family listed at $105k.
Deal economics
- At list price, monthly cash flow is $200 ($2k/yr) — positive.
- The deal already cash-flows at list — no discount required.
- Meets the 1% rule at list price ($1k rent vs $105k).
- Cap rate 8.6% vs local median 5.5% in Bay City — top-decile yield for the area; either an underpriced asset or a hidden risk that comps aren't pricing in. Stress-test before assuming the spread holds.
Location & tenants
- Location reads 68/100 on livability (#360 in MI) — a middle-class / working-renter tenant base. Strengths: cost of living A+, housing A+, health & safety A+; Watch: schools D+, amenities D, crime F.
- Bay City School District (urban): math 27% / reading 40% proficiency, ranked #317 of 540 in MI (top 59%) — families likely to look elsewhere, expect single-tenant / working-renter base with shorter leases.
- Market conditions: 246 active listings in the ZIP; 3 comparable units currently listed for rent nearby; rentals lingering (median 44d on market — plan ~5-8 weeks vacancy on turnover, expect pricing pressure); 100% of comp listings sitting > 30 days — soft ceiling on asking rent; 39 units permitted in Bay County in 2024 (0 in 5+ unit buildings).
Forward outlook
- Local home prices are declining (-3.0%/yr); year-one equity from $726 of loan paydown is wiped out by about $3k of value loss. Plan a longer hold.
- Bay County population projected at -21% by 2050 — secular population decline; favor cash flow + early exit over multi-decade hold.
Negotiation context
- Only 1 days on market — expect competitive offers; lowballing is unlikely to land.
- 3 sale attempts since 8y ago with the ask held roughly flat each time — persistent listings suggest the price (not the market) is what's stuck; bring a comps-based counter.
- Current owner paid $30k; list at $105k implies a 250% gain — meaningful room to come down on a strong offer.
Risks & watch-outs
- Watch-outs: built in 1900 — expect roof / HVAC / electrical / plumbing capex.
Questions for the listing agent
- Built in 1900 — when were the roof, HVAC, electrical panel, plumbing, and water heater last replaced?
- Is there a deadline driving the sale (1031 exchange, divorce, estate, relocation)? That informs how much negotiation room exists.
- Schools are D-rated, which usually means shorter tenancies and higher turnover. Who's the typical renter profile here, and what's been the actual vacancy rate?
- Crime grade is F in this area — have there been break-ins, vandalism, or insurance claims at this property in the last 3 years? What carrier currently insures it and at what premium?
- What's the average days-on-market for RENTAL listings here right now (not sales)? A rising rental-DOM trend means longer vacancies and softer asking-rent achievability than the comps imply.
- What's the recent tenant-quality profile in this submarket — average credit score on applications, eviction rate, late-payment / NSF rate, and stable-employment percentage? A property-management company in the area should have these aggregated.
- How much new for-sale + rental construction is in the pipeline within 1–3 miles? Heavy new supply typically softens prices + rents 12–24 months out; constrained supply supports both.
Investment metrics
- 1% rule
- 1.11% ✓
- Cap rate
- 8.58%
- Cash-on-cash
- 8.17%
- DSCR
- 1.36
- GRM
- 7.5
CMA / ARV
- ARV (on-the-fly)
- $134,288
- Comps found
- 12
Show comp detail 12 sales within ~0.75 mi
| Address | Dist | Beds/Ba | Sqft | Sold | Price | $/sf | Match |
|---|---|---|---|---|---|---|---|
| 509 S Dewitt St | 0.10mi | 3/1.0 | 1,200 (-3%) | 7mo | $104,000 | $87 | 81 |
| 203 W Jenny St | 0.28mi | 3/2.5 | 1,233 (+0%) | 7mo | $190,000 | $154 | 79 |
| 207 Main St | 0.39mi | 3/1.0 | 1,200 (-3%) | 5mo | $148,900 | $124 | 69 |
| 607 W Jenny St | 0.51mi | 3/1.0 | 1,236 (+0%) | 3mo | $100,000 | $81 | 69 |
| 309 W Fisher St | 0.35mi | 4/2.5 (+1) | 1,248 (+1%) | 9mo | $140,000 | $112 | 67 |
| 315 S Alp St | 0.51mi | 2/2.0 (-1) | 1,223 (-1%) | 6mo | $130,000 | $106 | 65 |
| 301 S Alp St | 0.53mi | 3/2.0 | 1,196 (-3%) | 9mo | $129,950 | $109 | 63 |
| 600 S Wenona Ave | 0.19mi | 3/1.0 | 1,376 (+12%) | 8mo | $42,000 | $31 | 61 |
| 401 E Florence St | 0.75mi | 3/2.0 | 1,248 (+1%) | 4mo | $125,000 | $100 | 59 |
| 1306 S Erie St | 0.70mi | 2/1.0 (-1) | 1,219 (-1%) | 2mo | $163,900 | $134 | 55 |
| 312 S Barclay St | 0.64mi | 2/1.0 (-1) | 1,271 (+3%) | 7mo | $160,000 | $126 | 50 |
| 104 W Ionia St | 0.57mi | 3/1.5 | 1,096 (-11%) | 5mo | $106,000 | $97 | 48 |
Match score weights: distance 35% · size 25% · config 20% · recency 20%. Top-matched comps best support the ARV.
Projected returns pro-forma
-3.0% appreciation · 3.0% rent growth · sell at horizon
- IRR
- -3.9%
- Equity multiple
- 0.86×
- Total profit
- $-4,246
- Equity at exit
- $15,656
- IRR
- 5.8%
- Equity multiple
- 1.43×
- Total profit
- $12,778
- Equity at exit
- $9,078
Cash invested: $29,400 (down + closing). Projections, not guarantees.
Landlord ↔ Tenant lean methodology
- Overall (STATE)
- 62 Landlord-Friendly
- State Michigan
- 62 Landlord-Friendly · EVEN
- County
- — inherits STATE
- City
- — inherits STATE
ZIP-level market 48706
- Active inventory
- 246
- Price-to-rent
- 7.5×
Monthly cashflow live
- Estimated rent
- $1,161 medium interval (Pro) →
- Mortgage (P&I)
- −$551
- Tax from tax record
- −$123 /mo · $1,473/yr
- Insurance
- −$44
- HOA
- −$0
- Vacancy / Maint / Mgmt
- −$244
- Net cashflow
- $200
Break-even live
UW: 25.0% down · 7.5% · 30yr · 1.5% tax · 5.0% vac · 8.0% maint · 8.0% mgmt
Financing live
Cash to close
- Down payment
- $26,250
- Closing costs
- $3,150
- Reserves months
- —
- Total cash needed
- —
Loan-product check · same deal, 3 products live
Conventional
25% down · 7.5% · 30yr
- Down + closing
- —
- Monthly P&I
- —
- Monthly cashflow
- —
- DSCR
- —
- Eligible?
- —
Personal DTI + credit; lowest rate.
DSCR
20% down · 8.5% · 30yr
- Down + closing
- —
- Monthly P&I
- —
- Monthly cashflow
- —
- DSCR
- —
- Eligible?
- —
No personal income docs; deal must DSCR.
Hard money
10% down · 12.0% · 12mo
- Down + closing
- —
- Monthly P&I
- —
- Monthly cashflow
- —
- DSCR
- —
- Eligible?
- —
Short-term bridge; refi at stabilization.
Rent comps 3 comps
| Address | Beds | Baths | Sqft | Rent | $/sqft | DOM | Units | Dist |
|---|---|---|---|---|---|---|---|---|
| 1305 Washington Ave Bay City, MI | 2.0 | 1.0 | 635 | $1,675 | $2.64 | 44d | 1 | 0.86mi |
| 800 McKinley St Bay City, MI | 2.0 | 1.0 | 796 | $925 | $1.16 | 44d | 1 | 0.99mi |
| 600 18th St Bay City, MI | 2.0 | 1.0 | 1000 | $950 | $0.95 | 44d | 1 | 1.10mi |
Listing history 6 events
-
2026-03-15status Pending
Show marketing remark (48 chars)
MULTI UNIT OFFERED AS PART OF A LARGER PORTFOLIO
-
2026-03-15status Pending 48-char remark
Show marketing remark (48 chars)
MULTI UNIT OFFERED AS PART OF A LARGER PORTFOLIO
-
2026-03-14$105,000 Active
Show marketing remark (48 chars)
MULTI UNIT OFFERED AS PART OF A LARGER PORTFOLIO
-
2026-03-14$105,000 Active 48-char remark
Show marketing remark (48 chars)
MULTI UNIT OFFERED AS PART OF A LARGER PORTFOLIO
-
2019-01-11soldstatus $30,000 419-char remark
Show marketing remark (419 chars)
City Certified Two Unit could easily be converted to a Single Family Home. Unit A rented for $500. Unit B rented for $600. Owner paid all utilities, no separate meters. Both are vacant, unit B has refinished hardwood flooring and 2 bedrooms upstairs. Apartment A has Ceramic Tile in the kitchen, Bedroom closet is near the bathroom, not in the bedroom. No appliances and no laundry hook up, Renters used the Laundromat.
-
2018-10-20$34,900 419-char remark
Show marketing remark (419 chars)
City Certified Two Unit could easily be converted to a Single Family Home. Unit A rented for $500. Unit B rented for $600. Owner paid all utilities, no separate meters. Both are vacant, unit B has refinished hardwood flooring and 2 bedrooms upstairs. Apartment A has Ceramic Tile in the kitchen, Bedroom closet is near the bathroom, not in the bedroom. No appliances and no laundry hook up, Renters used the Laundromat.
ⓘ Source: listings_history table (triggers on properties + properties_extension) + one-shot
backfill from property_details.listing_events for pre-trigger history.
Tax reassessment forecast MI · Partial reset (capped growth)
- Current annual tax
- $1,473 · $123/mo
- Projected year-2 tax
- $1,545 · $129/mo
- Expected delta
- +$72/yr (+$6/mo · 4.9%)
ⓘ Screening estimate from a state-policy table — verify with the county assessor before closing.
Climate risk First Street
- Flood 4/10 Moderate FEMA zone X (unshaded) · 22% chance over 30 yrs
- Wildfire 1/10 Low
- Heat 3/10 Moderate 7 d/yr ≥97°F today · 14 d/yr by 30 yrs out
- Wind 1/10 Low
- Air quality 2/10 Low 1 unhealthy d/yr today · 2 by 30 yrs out
Nearby sold comps map
Loading sold comps map…
Walkable amenities ~0.75 mi
Loading nearby amenities…
Taxation est. · year 1
- Rental income
- $13,935
- − Mortgage interest
- −$5,882
- − Property taxes
- −$1,473
- − Insurance
- −$525
- − Repairs & maintenance
- −$1,115
- − Management
- −$1,115
- − Depreciation
- −$3,055
- Taxable income
- $772
- Est. tax owed @ 24.0%
- −$185
- After-tax cash flow
- $2,218/yr
For passive investors: Depreciation is non-cash, so a rental often shows a tax loss while cash-flowing — sheltering income. Rental losses are passive: they offset passive income freely, and up to $25,000/yr can offset ordinary (W-2) income if you actively participate and your MAGI is under $100k (phasing out to $0 by $150k); unused losses carry forward. On sale, claimed depreciation is recaptured at up to 25%, and gains may owe capital-gains tax (a 1031 exchange can defer both). Figures are a year-1 estimate at your 24.0% rate — not tax advice; consult a CPA.
Schools (NCES district)
- District
- Bay City School District
- NCES district ID
- 2604260
- Math proficiency
- 27% ▼ -8.00%
- Reading proficiency
- 40% ▼ -4.00%
- Median HH income
- $43,833
- Composite
- 28.47/100
- National rank
- #6743
- State rank
- #317 of 540 in MI
Livability — Bay City
- Score
- 68/100
- State rank
- #360
- US rank
- #8912
Category grades
Schools grade is shown separately in the Schools card above.
Census & demographics
- Census place
- Bay City, MI
- City population
- 25,635
- Population (ZIP)
- 38,756
Population outlook (Bay County) Hauer SSP2
- Today (2025)
- 101,476 people
- By 2030
- 98,152 · -3.3%
- By 2040
- 89,711 · -11.6%
- By 2050
- 80,614 · -20.6%
- By 2075
- 60,544 · -40.3%
- By 2100
- 41,603 · -59.0%
Race, ethnicity, and origin ACS 2023
- Neighborhood character
- Predominantly White (90%)
- Race & ethnicity
- White 90% Hispanic / Latino 5% Two or more races 4%
- Common ancestry
- Romanian 16% Lithuanian 9% Slovak 2%
- Foreign-born
- 1%
- Languages at home
- 98% English-only · Spanish 1%
Political lean MEDSL · Bay
- 2024 margin
- R (+14.7) · D 42.0% · R 56.7% · Other 1.3%
- 2008→2024 swing
- -30.0pp toward R · 2008: 15.3pp · 2024: -14.7pp
- All cycles
- 2024: R+14.7 2020: R+11.6 2016: R+12.6 2012: D+6.0 2008: D+15.3
Not yet ingested
- Civics
- —
Market trends
- HPI YoY
- ▼ -133.29%
- Current HPI
- 203.6444
- Rent YoY
- —
- Metro
- —
- State GDP YoY
- ▲ 1.37%
- F500 in state
- 28
Industry mix (Fortune 500 HQ in MI)
| Industry | F500 HQs | Revenue |
|---|---|---|
| Automotive Parts | 3 | $48B |
|
||
| Automotive | 2 | $372B |
|
||
| Chemicals | 1 | $45B |
|
||
| Automotive Retail | 1 | $29B |
|
||
| Healthcare / Medical Devices | 1 | $23B |
|
||
| Automotive Technology | 1 | $20B |
|
||
Price history
+200.9% since first listed6 events — show timeline
- 2026-03-15 Pending — REALCOMP
- 2026-03-15 Pending — MiRealSource-MiMLS
- 2026-03-14 Listed $105,000 MiRealSource-MiMLS
- 2026-03-14 Listed $105,000 REALCOMP
- 2019-01-11 Sold (MLS) $30,000 MiRealSource-MiMLS
- 2018-10-20 Listed $34,900 MiRealSource-MiMLS
Property tax history
+1.0%/yrLatest (2025): $1,473 · -10.1% YoY. Source: county tax records.
Cash-flow waterfall
monthlySold comps — $/sqft
last 12 mo · ≤1 miLoading sold comps…