 🌊 Lakefront
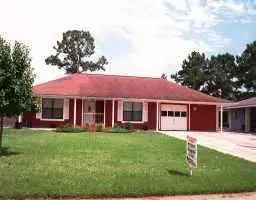
3046 S Palm Dr · Slidell, LA
Flood risk No data
- FEMA flood zone
- —
- Chance of flooding over 30 yrs
- —
- Est. flood insurance / yr
- —
Fire risk No data
- Est. fire insurance / yr
- —
Heat risk No data
- Hot days now (above threshold)
- —
- Hot days in 30 yrs
- —
Wind risk No data
- Chance of severe wind over 30 yrs
- —
Air-quality risk No data
- Unhealthy air days now
- —
- Unhealthy air days in 30 yrs
- —
Risk factors via First Street. Map © Google.
Why this score? — see what drove the D grade
The composite is a weighted blend of 9 inputs, each scored 0–100. Each bar is that input's sub-score; the figure is the points it added to the 100-point composite (weight × sub-score).
- ARV discount +12.8/15.0
- Cash flow +9.7/30.0
- Schools +4.3/10.0
- Livability +3.5/5.0
- Rent growth +2.9/5.0
- DSCR +2.7/10.0
- Condition / age +2.5/5.0
- 1% rule +2.3/10.0
- Appreciation +0.0/10.0
$249,000
🖨 Deal sheet (PDF) 📄 Offer letter ✓ Due diligence
Listing remarks MLS
WATERFRONT LIVING AT IT'S BEST. BOAT DOCK AND HOIST IS CONVENIENT FOR A SCENIC BOAT RIDE TO LAKE PONCHARTRAIN BY WAY OF BAYOU BONFOUCA AND BAYOU LIBERTY. LINGER ON THE WRAP AROUND COVERED DECK TO SIP YOUR MORNING COFFEE OR UNWIND AT SUNSET WITH PEACEFUL VIEWS. THIS RAISED HOME FEATURES 4 BEDROOMS AND 3 FULL BATHS. AN INVITING OPEN FLOOR PLAN DESIGNED FOR ENTERTAINING AND EVERYDAY COMFORT. THE AIRY MAIN LIVING SPACE OFFERS WARM LAMINATE WOOD FLOORING WITH COZY WOOD BURNING FIREPLACE. THE GALLEY KITCHEN HAS A SEAMLESS FLOW AND CONVENIENT BREAKFAST BAR. ATTACHED TO GARAGE IS A LARGE STORAGE AREA WHICH CAN HIDE LARGE WATER TOYS, SEAFOOD POTS, AND FISHING SUPPLIES. NICE SHED/SHOP ALSO IN BACKYARD.MINUTES FROM SLIDELL'S DOWNTOWN DINING, SHOPPING, PARKS, AND ENTERTAINMENT. I-10 AND I-12 ARE CLOSE FOR COMMUNTING.
Key facts
- Large storage area
- Open floor plan
- Boat dock
Tags
Property features AI
Finance
- HOA & community: Community features: Water access
Exterior
- Parking: Attached garage with two spaces; Boat parking; RV access/parking
- Utilities: Public water; Public sewer
- Home design: Single-story house; Raised foundation and slab; Very good condition; Shingle roof; Brick and vinyl siding construction; Built/updated in 2010 (house was raised and updated)
- Construction: Brick and vinyl siding; Shingle roof; Raised foundation and slab; Built/updated in 2010
- Exterior features: Covered porch; Balcony; Dock; Workshop; Water access and canal access; City lot, rectangular
Interior
- Kitchen: Microwave; Oven; Range
- Bedrooms: Total of 8 rooms (includes bedrooms and living spaces)
- Bathrooms: 3 full bathrooms
- Heating & cooling: Central heating (multiple heating units); Central air conditioning
- Interior features: Ceiling fan(s); Wood-burning fireplace
- Laundry & utility: Washer hookup; Dryer hookup
Neighborhood map
What this means for you Summary
Snapshot
- This is a 4-bed/3.0-bath single-family listed at $249k.
Deal economics
- At list price, monthly cash flow is $-164 ($-2k/yr) — negative.
- To cash-flow at today's rent, offer at most $220k (11.7% below list).
- To meet the 1% rule (rent ≥ 1% of price), the offer needs to be $182k (26.8% below list).
- Recommended offer: $182k (26.8% below list) — sets the bar for 1% rule.
Location & tenants
- Location reads 70/100 on livability (#57 in LA) — a middle-class / working-renter tenant base. Strengths: cost of living A+, housing A+, health & safety A+; Watch: amenities F, commute F.
- St. Tammany Parish (suburban): math 43% / reading 55% proficiency, ranked #11 of 98 in LA (top 11%) — families likely to look elsewhere, expect single-tenant / working-renter base with shorter leases.
- Zoned schools: Glynn H. Brock Elementary School (math 32% / reading 42%, grade F, #251 of 646 statewide, top 41%, 320 students, 79% FRL); St. Tammany Junior High School (math 19% / reading 41%, grade F, #114 of 218 statewide, top 53%, 793 students, 68% FRL); Salmen High School (math 15% / reading 27%, grade F, #179 of 265 statewide, top 68%, 1,216 students, 62% FRL) — zoned schools average 70% FRL vs 40% district-wide (30 pts higher); higher-poverty schools than district average — tighter screening recommended.
- Zoned-school proficiency averages 29% at this address vs 49% district-wide (-20 pts) — the specific schools serving this property underperform the St. Tammany Parish average; the district grade overstates school quality for this exact location.
- Market conditions: Rents rising (+1.5%/yr); 489 active listings in the ZIP; 10 comparable units currently listed for rent nearby; rentals lingering (median 46d on market — plan ~5-8 weeks vacancy on turnover, expect pricing pressure); 60% of comp listings sitting > 30 days — soft ceiling on asking rent; 1,064 units permitted in St. Tammany Parish in 2024 (0 in 5+ unit buildings).
- This rent runs 30% of the median local income ($73k/yr) — at the standard rent-burdened threshold; future hikes will face affordability resistance.
Forward outlook
- Local home prices are declining (-3.0%/yr); year-one equity from $2k of loan paydown is wiped out by about $7k of value loss. Plan a longer hold.
- St. Tammany County population projected at +27% by 2050 — long-run rental-demand tailwind backs the buy-and-hold thesis.
Negotiation context
- Only 9 days on market — expect competitive offers; lowballing is unlikely to land.
- 6 sale attempts since 30y ago with the ask held roughly flat each time — persistent listings suggest the price (not the market) is what's stuck; bring a comps-based counter.
- Current owner paid $95k; list at $249k implies a 162% gain — meaningful room to come down on a strong offer.
Questions for the listing agent
- What do current leases actually rent for vs. the listed asking? Can we see a recent rent roll and the last 12 months of T-12 income?
- Built in 1976 — when were the roof, HVAC, electrical panel, plumbing, and water heater last replaced?
- Is there a deadline driving the sale (1031 exchange, divorce, estate, relocation)? That informs how much negotiation room exists.
- Schools are B-rated — typically a magnet for longer-tenancy family renters. What's the average tenant stay here, and is there a school-zone premium baked into asking?
- The area grade is low — what's the realistic commute time and amenity access for the typical tenant pool here? Any planned neighborhood developments (good or bad) we should know about?
- This sits on a lake — are riparian / water-frontage rights deeded with the parcel? Any dock permits, shoreline easements, or HOA water-use restrictions?
- What's the documented flood / surge / shoreline-erosion history here (FEMA AND non-FEMA — e.g., storm surge, creek backup, septic-field saturation)?
- Any water-quality or seasonal algae-bloom issues that affect tenant satisfaction or short-term-rental demand?
- What's the average days-on-market for RENTAL listings here right now (not sales)? A rising rental-DOM trend means longer vacancies and softer asking-rent achievability than the comps imply.
- What's the recent tenant-quality profile in this submarket — average credit score on applications, eviction rate, late-payment / NSF rate, and stable-employment percentage? A property-management company in the area should have these aggregated.
- How much new for-sale + rental construction is in the pipeline within 1–3 miles? Heavy new supply typically softens prices + rents 12–24 months out; constrained supply supports both.
Investment metrics
- 1% rule
- 0.73% ✗
- Cap rate
- 5.50%
- Cash-on-cash
- -2.83%
- DSCR
- 0.87
- GRM
- 11.4
CMA / ARV
- ARV (median comp)
- $282,508
- List price
- $249,000
- Delta
- -7.97%
- Verdict
- FAIR
- Comps
- 20 within 1.0 mi
Show comp detail 12 sales within ~0.75 mi
| Address | Dist | Beds/Ba | Sqft | Sold | Price | $/sf | Match |
|---|---|---|---|---|---|---|---|
| 145 Southpark Dr | 0.22mi | 5/2.5 (+1) | 1,690 (+2%) | 3mo | $180,000 | $107 | 76 |
| 127 Whitehall Dr | 0.27mi | 4/2.0 | 1,475 (-11%) | 5mo | $145,000 | $98 | 61 |
| 3638 Meadowdale Dr | 0.20mi | 3/1.5 (-1) | 1,815 (+10%) | 3mo | $176,800 | $97 | 61 |
| 156 Southpark Dr | 0.25mi | 4/2.0 | 1,849 (+12%) | 6mo | $195,500 | $106 | 60 |
| 3738 Arrowhead Dr | 0.35mi | 3/2.0 (-1) | 1,580 (-4%) | 11mo | $168,000 | $106 | 58 |
| 365 Hickory Dr | 0.71mi | 4/2.0 | 1,595 (-4%) | 2mo | $68,500 | $43 | 55 |
| 176 Southpark Dr | 0.29mi | 3/2.0 (-1) | 1,442 (-13%) | 8mo | $170,000 | $118 | 50 |
| 179 Lizana St | 0.23mi | 3/2.0 (-1) | 1,434 (-13%) | 10mo | $41,000 | $29 | 49 |
| 3109 Bayou View Pl | 0.40mi | 3/2.0 (-1) | 1,450 (-12%) | 7mo | $240,000 | $166 | 46 |
| 140 Greencrest Dr | 0.66mi | 3/2.0 (-1) | 1,480 (-10%) | 1mo | $176,000 | $119 | 42 |
| 3844 Riviera Dr | 0.52mi | 3/1.5 (-1) | 1,466 (-11%) | 6mo | $150,000 | $102 | 41 |
| 3039 College St | 0.46mi | 3/2.0 (-1) | 1,406 (-15%) | 10mo | $190,000 | $135 | 36 |
Match score weights: distance 35% · size 25% · config 20% · recency 20%. Top-matched comps best support the ARV.
Projected returns pro-forma
-3.0% appreciation · 1.47% rent growth · sell at horizon
- IRR
- -22.6%
- Equity multiple
- 0.23×
- Total profit
- $-53,626
- Equity at exit
- $37,127
- IRR
- -21.0%
- Equity multiple
- -0.02×
- Total profit
- $-71,351
- Equity at exit
- $21,529
Cash invested: $69,720 (down + closing). Projections, not guarantees.
Landlord ↔ Tenant lean methodology
- Overall (STATE)
- 90 Strongly Landlord-Friendly
- State Louisiana
- 90 Strongly Landlord-Friendly · R+12
- County
- — inherits STATE
- City
- — inherits STATE
ZIP-level market 70458
- Rents YoY
- 1.5%
- Active inventory
- 489
- Price-to-rent
- 11.4×
Monthly cashflow live
- Estimated rent
- $1,822 high interval (Pro) →
- Mortgage (P&I)
- −$1,306
- Tax from tax record
- −$194 /mo · $2,327/yr
- Insurance
- −$104
- HOA
- −$0
- Vacancy / Maint / Mgmt
- −$383
- Net cashflow
- $-164
Break-even live
Sensitivity live
| Price | -10% $-23 | -5% $-94 | +0% $-164 | +5% $-235 | +10% $-305 |
|---|---|---|---|---|---|
| Rent | -10% $-308 | -5% $-236 | +0% $-164 | +5% $-92 | +10% $-20 |
| Rate | -1.0pp $-39 | -0.5pp $-101 | base $-164 | +0.5pp $-229 | +1.0pp $-295 |
UW: 25.0% down · 7.5% · 30yr · 1.5% tax · 5.0% vac · 8.0% maint · 8.0% mgmt
Financing live
Cash to close
- Down payment
- $62,250
- Closing costs
- $7,470
- Reserves months
- —
- Total cash needed
- —
Loan-product check · same deal, 3 products live
Conventional
25% down · 7.5% · 30yr
- Down + closing
- —
- Monthly P&I
- —
- Monthly cashflow
- —
- DSCR
- —
- Eligible?
- —
Personal DTI + credit; lowest rate.
DSCR
20% down · 8.5% · 30yr
- Down + closing
- —
- Monthly P&I
- —
- Monthly cashflow
- —
- DSCR
- —
- Eligible?
- —
No personal income docs; deal must DSCR.
Hard money
10% down · 12.0% · 12mo
- Down + closing
- —
- Monthly P&I
- —
- Monthly cashflow
- —
- DSCR
- —
- Eligible?
- —
Short-term bridge; refi at stabilization.
Rent comps 10 comps
| Address | Beds | Baths | Sqft | Rent | $/sqft | DOM | Units | Dist |
|---|---|---|---|---|---|---|---|---|
| 172 South St Slidell, LA | 4.0 | 2.0 | 1486 | $1,800 | $1.21 | 23d | 1 | 0.21mi |
| 3152 College St Slidell, LA | 3.0 | 1.0 | 1373 | $1,750 | $1.27 | 45d | 1 | 0.40mi |
| 3839 Oxford St Slidell, LA | 3.0 | 2.0 | 1660 | $1,700 | $1.02 | 45d | 1 | 0.79mi |
| 3046 Slidell Ave Slidell, LA | 4.0 | 1.0 | 1253 | $1,850 | $1.48 | 5d | 1 | 0.88mi |
| 3304 Bridge Dr Slidell, LA | 3.0 | 2.0 | 1250 | $1,700 | $1.36 | 45d | 1 | 1.04mi |
| 102 Spartan Trace Blvd Slidell, LA | 3.0 | 2.0 | 1516 | $2,000 | $1.32 | 25d | 1 | 1.16mi |
| 96 Chamale Cv Slidell, LA | 3.0 | 2.5 | 1432 | $1,500 | $1.05 | 45d | 1 | 1.19mi |
| 58019 Carroll Rd Slidell, LA | 4.0 | 2.0 | 1400 | $1,695 | $1.21 | 45d | 1 | 1.45mi |
| 517 Erlanger Ave Unit A Slidell, LA | 3.0 | 2.0 | 1134 | $1,400 | $1.23 | 45d | 1 | 1.47mi |
| 517 Erlanger Ave Unit A Slidell, LA | 3.0 | 2.0 | 1134 | $1,375 | $1.21 | 16d | 1 | 1.47mi |
Listing history 18 events
-
2026-06-21days on market $249,000 Active 9 DOM
-
2026-06-18days on market $249,000 Active 6 DOM
-
2026-06-17days on market $249,000 Active 5 DOM
-
2026-06-16days on market $249,000 Active 4 DOM
-
2026-06-15days on market $249,000 Active 3 DOM
-
2026-06-13pricestatusdays on market $249,000 Active 1 DOM
-
2026-04-10$260,000 Active
-
2026-01-18price $269,000
-
2026-01-18price $269,000
-
2025-10-06price $275,000
-
2025-10-06price $275,000
-
2025-08-01price $280,000
-
2025-08-01price $280,000
-
2025-06-04$310,000 Active
-
2006-08-11soldstatus $95,000
-
1997-02-20soldstatus $114,500
-
1996-08-20$119,900
-
1996-08-20$119,900
ⓘ Source: listings_history table (triggers on properties + properties_extension) + one-shot
backfill from property_details.listing_events for pre-trigger history.
Tax reassessment forecast LA · Resets to sale price
- Current annual tax
- $2,327 · $194/mo
- Projected year-2 tax
- $2,327 · $194/mo
- Expected delta
- $0/yr ($0/mo · 0.0%)
ⓘ Screening estimate from a state-policy table — verify with the county assessor before closing.
Nearby sold comps map
Loading sold comps map…
Walkable amenities ~0.75 mi
Loading nearby amenities…
Taxation est. · year 1
- Rental income
- $21,859
- − Mortgage interest
- −$13,948
- − Property taxes
- −$2,327
- − Insurance
- −$1,245
- − Repairs & maintenance
- −$1,749
- − Management
- −$1,749
- − Depreciation
- −$7,244
- Taxable loss
- −$6,402
- Est. tax savings @ 24.0%
- +$1,536
- After-tax cash flow
- $-436/yr
For passive investors: Depreciation is non-cash, so a rental often shows a tax loss while cash-flowing — sheltering income. Rental losses are passive: they offset passive income freely, and up to $25,000/yr can offset ordinary (W-2) income if you actively participate and your MAGI is under $100k (phasing out to $0 by $150k); unused losses carry forward. On sale, claimed depreciation is recaptured at up to 25%, and gains may owe capital-gains tax (a 1031 exchange can defer both). Figures are a year-1 estimate at your 24.0% rate — not tax advice; consult a CPA.
Schools (NCES district)
- District
- St. Tammany Parish
- NCES district ID
- 2201650
- Math proficiency
- 43% ▼ -32.00%
- Reading proficiency
- 55% ▼ -26.00%
- Median HH income
- $61,752
- Composite
- 43.04/100
- National rank
- #3098
- State rank
- #11 of 98 in LA
Livability — Slidell
- Score
- 70/100
- State rank
- #57
- US rank
- #7673
Category grades
Schools grade is shown separately in the Schools card above.
Census & demographics
- Census place
- Slidell, LA
- County
- Saint Tammany Parish · 228,296 people
- City population
- 95,511
- Metro
- New Orleans-Metairie, LA
- Population (ZIP)
- 39,034
- Household income
- $72,843
- Rent vs Own
- Severe rent burden
- 1331.0
Population outlook (St. Tammany County) Hauer SSP2
- Today (2025)
- 286,725 people
- By 2030
- 304,175 · +6.1%
- By 2040
- 336,203 · +17.3%
- By 2050
- 364,590 · +27.2%
- By 2075
- 433,362 · +51.1%
- By 2100
- 470,333 · +64.0%
Race, ethnicity, and origin ACS 2023
- Neighborhood character
- Predominantly White (66%)
- Race & ethnicity
- White 66% Black 17% Two or more races 10% Hispanic / Latino 9% Native American 2% Asian 1%
- Hispanic origin (detail)
- Mexican 3% Puerto Rican 1%
- Common ancestry
- Lithuanian 15% Slovak 2% Romanian 1%
- Foreign-born
- 3% · Canada, Vietnam
- Languages at home
- 93% English-only · Spanish 5% Vietnamese 1%
Political lean MEDSL · St. Tammany
- 2024 margin
- Solid R (+43.8) · D 27.3% · R 71.1% · Other 1.6%
- 2008→2024 swing
- +9.6pp toward D · 2008: -53.4pp · 2024: -43.8pp
- All cycles
- 2024: R+43.8 2020: R+44.2 2016: R+50.8 2012: R+52.2 2008: R+53.4
Not yet ingested
- Civics
- —
Market trends
- HPI YoY
- ▼ -173.60%
- Current HPI
- 147.4749
- Rent YoY
- ▲ 1.47%
- Metro
- New Orleans-Metairie, LA
- State GDP YoY
- ▲ 3.29%
- F500 in state
- 10
Industry mix (Fortune 500 HQ in LA)
| Industry | F500 HQs | Revenue |
|---|---|---|
| Telecommunications | 2 | $23B |
|
||
| Utilities | 1 | $12B |
|
||
| Wholesale / Distribution | 1 | $5B |
|
||
| Advertising | 1 | $2B |
|
||
Price history
+107.7% since first listed14 events — show timeline
- 2026-06-11 Listed $249,000 AcadianaMLS
- 2026-06-11 Listed $249,000 GSREIN
- 2026-04-10 Listed $260,000 AcadianaMLS
- 2026-01-18 Price Changed $269,000 AcadianaMLS
- 2026-01-18 Price Changed $269,000 GSREIN
- 2025-10-06 Price Changed $275,000 AcadianaMLS
- 2025-10-06 Price Changed $275,000 GSREIN
- 2025-08-01 Price Changed $280,000 AcadianaMLS
- 2025-08-01 Price Changed $280,000 GSREIN
- 2025-06-04 Listed $310,000 AcadianaMLS
- 2006-08-11 Sold (Public Records) $95,000 Public Records
- 1997-02-20 Sold (MLS) $114,500 GSREIN
- 1996-08-20 Listed $119,900 GSREIN
- 1996-08-20 Listed $119,900 AcadianaMLS
Property tax history
+0.7%/yrLatest (2025): $2,327 · -6.2% YoY. Source: county tax records.
Cash-flow waterfall
monthlySold comps — $/sqft
last 12 mo · ≤1 miLoading sold comps…