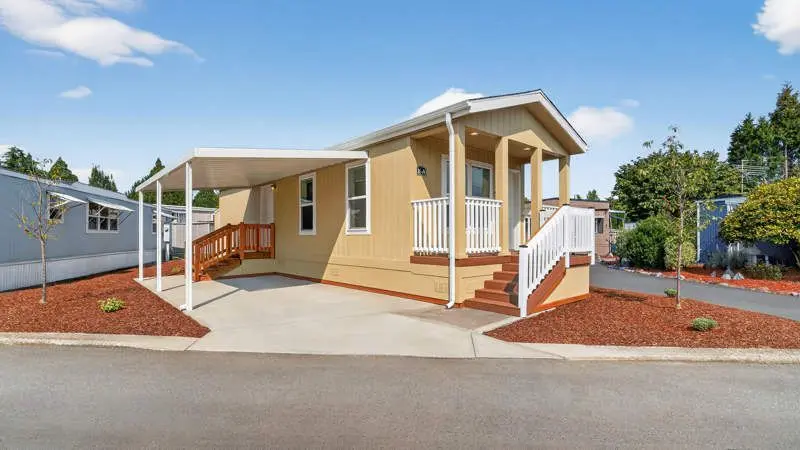
2200 Lancaster Dr SE Unit 16A · Salem, OR
Flood risk 1/10 · Minimal
- FEMA flood zone
- X
- Chance of flooding over 30 yrs
- 0.0%
- Est. flood insurance / yr
- $435 – $905
Fire risk 1/10 · Minimal
- Est. fire insurance / yr
- $498 – $926
Heat risk 4/10 · Minor
- Hot days now (above threshold)
- 7 days/yr
- Hot days in 30 yrs
- 15 days/yr
Wind risk No data
- Chance of severe wind over 30 yrs
- —
Air-quality risk No data
- Unhealthy air days now
- —
- Unhealthy air days in 30 yrs
- —
Risk factors via First Street. Map © Google.
Why this score? — see what drove the B grade
The composite is a weighted blend of 9 inputs, each scored 0–100. Each bar is that input's sub-score; the figure is the points it added to the 100-point composite (weight × sub-score).
- Cash flow +30.0/30.0
- DSCR +10.0/10.0
- 1% rule +9.5/10.0
- ARV discount +7.5/15.0
- Livability +4.0/5.0
- Condition / age +4.0/5.0
- Schools +3.7/10.0
- Rent growth +3.2/5.0
- Appreciation +0.0/10.0
$84,900
🖨 Deal sheet (PDF) 📄 Offer letter ✓ Due diligence
Listing remarks MLS
Brand new 2024 1 bedroom 1 bathroom home with 560 sq. ft. is now available at Sundial! The living room and kitchen are open and bright. The kitchen has brand-new stainless-steel appliances and a deep kitchen sink! There is recessed lighting throughout the home and washer/dryer hookups. Outside you have a front porch, carport, storage shed and low maintenance landscaping! Space rent: $1,200/month Sundial MHP is a beautiful 55+ community in the heart of the Willamette Valley. The community is pet-friendly and boasts a calendar of activities, a neighborhood atmosphere and an impressive lineup of social amenities such as a club house, indoor pool/spa, library & billiard room.
Key facts
- Front porch
- Carport
- Storage shed
Tags
Neighborhood map
What this means for you Summary
Snapshot
- This is a 1-bed/1.0-bath manufactured listed at $85k. Condition is rated good.
Deal economics
- At list price, monthly cash flow is $387 ($5k/yr) — positive.
- The deal already cash-flows at list — no discount required.
- Meets the 1% rule at list price ($1k rent vs $85k).
- Recommended offer: $75k (12.0% below list) — sets the bar for market timing.
- Cap rate 11.8% vs local median 2.9% in Salem — top-decile yield for the area; either an underpriced asset or a hidden risk that comps aren't pricing in. Stress-test before assuming the spread holds.
Location & tenants
- Location reads 79/100 on livability (#59 in OR, #2,084 nationally) — a middle-class / working-renter tenant base. Strengths: amenities A+, commute A+, housing A+; Watch: schools D, crime F.
- Salem-Keizer SD 24J (urban): math 34% / reading 47% proficiency, ranked #103 of 183 in OR (top 56%) — families likely to look elsewhere, expect single-tenant / working-renter base with shorter leases.
- Market conditions: Rents rising (+2.6%/yr); 135 active listings in the ZIP; 8 comparable units currently listed for rent nearby; rentals at typical pace (median 15d on market — plan ~3-4 weeks tenant-placement turnaround); solid renter incomes; 1,591 units permitted in Marion County in 2024 (716 in 5+ unit buildings).
- This rent is only 18% of the median local income ($84k/yr) — well below the 30% rent-burden line; pricing power to push rent on renewal without tenant pushback.
Forward outlook
- Local home prices are declining (-3.0%/yr); year-one equity from $587 of loan paydown is wiped out by about $3k of value loss. Plan a longer hold.
- Marion County population projected at +17% by 2050 — long-run rental-demand tailwind backs the buy-and-hold thesis.
- At projected returns (-3.0% appreciation + 2.6% rent growth), your $24k cash investment doubles in ~7 years — after that, you're playing with house money.
Negotiation context
- It's been on market 219 days — a 12% lower offer ($75k) is reasonable based on typical stale-listing flexibility.
Questions for the listing agent
- It's been on market 219 days. Have you received any prior offers? Is the seller open to a 12% concession, seller financing, or rate buy-down credit?
- Why hasn't it sold? Are there any deal-killer items the seller is aware of (foundation, flood, title, zoning, code violations)?
- Is there a deadline driving the sale (1031 exchange, divorce, estate, relocation)? That informs how much negotiation room exists.
- Schools are D-rated, which usually means shorter tenancies and higher turnover. Who's the typical renter profile here, and what's been the actual vacancy rate?
- Crime grade is F in this area — have there been break-ins, vandalism, or insurance claims at this property in the last 3 years? What carrier currently insures it and at what premium?
- What's the average days-on-market for RENTAL listings here right now (not sales)? A rising rental-DOM trend means longer vacancies and softer asking-rent achievability than the comps imply.
- What's the recent tenant-quality profile in this submarket — average credit score on applications, eviction rate, late-payment / NSF rate, and stable-employment percentage? A property-management company in the area should have these aggregated.
- How much new for-sale + rental construction is in the pipeline within 1–3 miles? Heavy new supply typically softens prices + rents 12–24 months out; constrained supply supports both.
Investment metrics
- 1% rule
- 1.45% ✓
- Cap rate
- 11.77%
- Cash-on-cash
- 19.55%
- DSCR
- 1.87
- GRM
- 5.7
CMA / ARV
- ARV (median comp)
- $14,500
- List price
- $84,900
- Delta
- 485.52%
- Verdict
- OVERPRICED
- Comps
- 1 within 2.0 mi
Projected returns pro-forma
-3.0% appreciation · 2.62% rent growth · sell at horizon
- IRR
- 11.2%
- Equity multiple
- 1.44×
- Total profit
- $10,458
- Equity at exit
- $12,659
- IRR
- 19.9%
- Equity multiple
- 2.64×
- Total profit
- $39,032
- Equity at exit
- $7,341
Cash invested: $23,772 (down + closing). Projections, not guarantees.
Landlord ↔ Tenant lean methodology
- Overall (STATE)
- 28 Tenant-Leaning
- State Oregon
- 28 Tenant-Leaning · D+6
- County
- — inherits STATE
- City
- — inherits STATE
ZIP-level market 97317
- Rents YoY
- 2.6%
- Active inventory
- 135
- Price-to-rent
- 5.7×
Monthly cashflow live
- Estimated rent
- $1,233 high interval (Pro) →
- Mortgage (P&I)
- −$445
- Tax est. 1.5%
- −$106 /mo · $1,274/yr
- Insurance
- −$35
- HOA
- −$0
- Vacancy / Maint / Mgmt
- −$259
- Net cashflow
- $387
Break-even live
Sensitivity live
| Price | -10% $446 | -5% $417 | +0% $387 | +5% $358 | +10% $329 |
|---|---|---|---|---|---|
| Rent | -10% $290 | -5% $339 | +0% $387 | +5% $436 | +10% $485 |
| Rate | -1.0pp $430 | -0.5pp $409 | base $387 | +0.5pp $365 | +1.0pp $343 |
UW: 25.0% down · 7.5% · 30yr · 1.5% tax · 5.0% vac · 8.0% maint · 8.0% mgmt
Financing live
Cash to close
- Down payment
- $21,225
- Closing costs
- $2,547
- Reserves months
- —
- Total cash needed
- —
Loan-product check · same deal, 3 products live
Conventional
25% down · 7.5% · 30yr
- Down + closing
- —
- Monthly P&I
- —
- Monthly cashflow
- —
- DSCR
- —
- Eligible?
- —
Personal DTI + credit; lowest rate.
DSCR
20% down · 8.5% · 30yr
- Down + closing
- —
- Monthly P&I
- —
- Monthly cashflow
- —
- DSCR
- —
- Eligible?
- —
No personal income docs; deal must DSCR.
Hard money
10% down · 12.0% · 12mo
- Down + closing
- —
- Monthly P&I
- —
- Monthly cashflow
- —
- DSCR
- —
- Eligible?
- —
Short-term bridge; refi at stabilization.
Rent comps 8 comps
| Address | Beds | Baths | Sqft | Rent | $/sqft | DOM | Units | Dist |
|---|---|---|---|---|---|---|---|---|
| 4665 Campbell Dr SE Salem, OR | 1.0–3.0 | 1.0–2.0 | 923 | $1,299 | $1.41 | 15d | 1 | 0.58mi |
| 1569 Whitaker Dr SE Salem, OR | 1.0–3.0 | 1.0–2.0 | 933 | $1,299 | $1.39 | 15d | 1 | 0.90mi |
| 3897 Meadowlawn Loop SE Salem, OR | 1.0–3.0 | 1.0–2.0 | 962 | $1,280 | $1.33 | 15d | 26 | 1.10mi |
| 5192 Caplinger Rd SE Salem, OR | 1.0–3.0 | 1.0–2.0 | 927 | $1,305 | $1.41 | 15d | 25 | 1.25mi |
| 4433 Mahrt Ave SE Unit 4433-205 Salem, OR | 1.0 | 1.0 | 688 | $1,225 | $1.78 | 45d | 1 | 1.34mi |
| 4242 State St Salem, OR | 1.0 | 1.0 | 684 | $1,325 | $1.94 | 24d | 1 | 1.42mi |
| 143 Connecticut Ave SE Unit 143 Salem, OR | 1.0 | 1.0 | 705 | $950 | $1.35 | 15d | 1 | 1.45mi |
| 4265 State St Unit 2 Salem, OR | 1.0 | 1.0 | 500 | $995 | $1.99 | 45d | 1 | 1.48mi |
Listing history 16 events
-
2026-06-21days on market $84,900 Active 219 DOM
-
2026-06-18days on market $84,900 Active 216 DOM
-
2026-06-17days on market $84,900 Active 215 DOM
-
2026-06-16days on market $84,900 Active 214 DOM
-
2026-06-15days on market $84,900 Active 213 DOM
-
2026-06-14days on market $84,900 Active 211 DOM
-
2026-06-10days on market $84,900 Active 208 DOM
-
2026-06-09days on market $84,900 Active 207 DOM
-
2026-06-08days on market $84,900 Active 206 DOM
-
2026-06-07days on market $84,900 Active 205 DOM
-
2026-06-03days on market $84,900 Active 201 DOM
-
2026-06-02days on market $84,900 Active 200 DOM
-
2026-06-01days on market $84,900 Active 199 DOM
-
2026-05-31days on market $84,900 Active 198 DOM
-
2026-05-30days on market $84,900 Active 197 DOM
-
2025-11-14$109,900 Active 687-char remark
Show marketing remark (687 chars)
Brand new 2024 1 bedroom 1 bathroom home with 560 sq. ft. is now available at Sundial! The living room and kitchen are open and bright. The kitchen has brand-new stainless-steel appliances and a deep kitchen sink! There is recessed lighting throughout the home and washer/dryer hookups. Outside you have a front porch, carport, storage shed and low maintenance landscaping! Space rent: $1,200/month Sundial MHP is a beautiful 55+ community in the heart of the Willamette Valley. The community is pet-friendly and boasts a calendar of activities, a neighborhood atmosphere and an impressive lineup of social amenities such as a club house, indoor pool/spa, library & billiard room.
ⓘ Source: listings_history table (triggers on properties + properties_extension) + one-shot
backfill from property_details.listing_events for pre-trigger history.
Climate risk First Street
- Flood 1/10 Low FEMA zone X · 0% chance over 30 yrs
- Wildfire 1/10 Low
- Heat 4/10 Moderate
Nearby sold comps map
Loading sold comps map…
Walkable amenities ~0.75 mi
Loading nearby amenities…
Taxation est. · year 1
- Rental income
- $14,795
- − Mortgage interest
- −$4,756
- − Property taxes
- −$1,274
- − Insurance
- −$424
- − Repairs & maintenance
- −$1,184
- − Management
- −$1,184
- − Depreciation
- −$2,470
- Taxable income
- $3,504
- Est. tax owed @ 24.0%
- −$841
- After-tax cash flow
- $3,806/yr
For passive investors: Depreciation is non-cash, so a rental often shows a tax loss while cash-flowing — sheltering income. Rental losses are passive: they offset passive income freely, and up to $25,000/yr can offset ordinary (W-2) income if you actively participate and your MAGI is under $100k (phasing out to $0 by $150k); unused losses carry forward. On sale, claimed depreciation is recaptured at up to 25%, and gains may owe capital-gains tax (a 1031 exchange can defer both). Figures are a year-1 estimate at your 24.0% rate — not tax advice; consult a CPA.
Condition & rehab AI · 12 photos
This 2024 manufactured home is in excellent condition with no visible repairs needed. It offers a fresh, move-in-ready living space with potential for minor updates to enhance its resale and rental value.
Value-add opportunities
- Both Paint interior walls — Fresh paint enhances curb appeal and interior aesthetics
- Both Replace carpet with hardwood flooring — Hardwood flooring is more durable and adds value
- Both Install smart home devices — Smart home devices improve convenience and energy efficiency
Renovation cost estimate screening
Value-add ROI direction
- Both Paint interior walls — Fresh paint enhances curb appeal and interior aesthetics ↑
- Both Replace carpet with hardwood flooring — Hardwood flooring is more durable and adds value ↑
- Both Install smart home devices — Smart home devices improve convenience and energy efficiency ↑
ⓘ Cost ranges are severity-bucket heuristics (US national rule-of-thumb). Get contractor quotes + a written scope before underwriting a rehab budget.
Schools (NCES district)
- District
- Salem-Keizer SD 24J
- NCES district ID
- 4110820
- Math proficiency
- 34% ▼ -1.00%
- Reading proficiency
- 47% ▼ -2.00%
- Median HH income
- $48,632
- Composite
- 37.16/100
- National rank
- #9017
- State rank
- #103 of 183 in OR
Livability — Salem
- Score
- 79/100
- State rank
- #59
- US rank
- #2084
Category grades
Schools grade is shown separately in the Schools card above.
Census & demographics
- Census place
- Salem, OR
- County
- Marion County · 258,219 people
- City population
- 193,601
- Metro
- Salem, OR
- Population (ZIP)
- 25,966
- Household income
- $84,393
- Rent vs Own
- Severe rent burden
- 395.0
Population outlook (Marion County) Hauer SSP2
- Today (2025)
- 360,940 people
- By 2030
- 375,178 · +3.9%
- By 2040
- 400,914 · +11.1%
- By 2050
- 422,187 · +17.0%
- By 2075
- 460,305 · +27.5%
- By 2100
- 464,025 · +28.6%
Race, ethnicity, and origin ACS 2023
- Neighborhood character
- Majority White (61%)
- Race & ethnicity
- White 61% Hispanic / Latino 28% Two or more races 17% Asian 2% Pacific Islander 2%
- Hispanic origin (detail)
- Mexican 26%
- Common ancestry
- Portuguese 4% Italian 2% Lithuanian 2%
- Foreign-born
- 11% · Canada, Vietnam
- Languages at home
- 74% English-only · Spanish 22% Russian/Polish/Slavic 2% German/W. Germanic 1%
Political lean MEDSL · Marion
- 2024 margin
- Toss-up / Even · D 47.5% · R 49.5% · Other 3.0%
- 2008→2024 swing
- -4.2pp toward R · 2008: 2.2pp · 2024: -2.0pp
- All cycles
- 2024: R+2.0 2020: D+1.1 2016: R+5.0 2012: R+3.5 2008: D+2.2
Not yet ingested
- Civics
- —
Market trends
- HPI YoY
- ▼ -471.73%
- Current HPI
- 307.3264
- Rent YoY
- ▲ 2.62%
- Metro
- Salem, OR
- State GDP YoY
- ▲ 2.05%
- F500 in state
- 2
Industry mix (Fortune 500 HQ in OR)
| Industry | F500 HQs | Revenue |
|---|---|---|
| Consumer Goods | 1 | $51B |
|
||
Price history
1 event — show timeline
- 2025-11-14 Listed $109,900 Zillow
Cash-flow waterfall
monthlySold comps — $/sqft
last 12 mo · ≤1 miLoading sold comps…