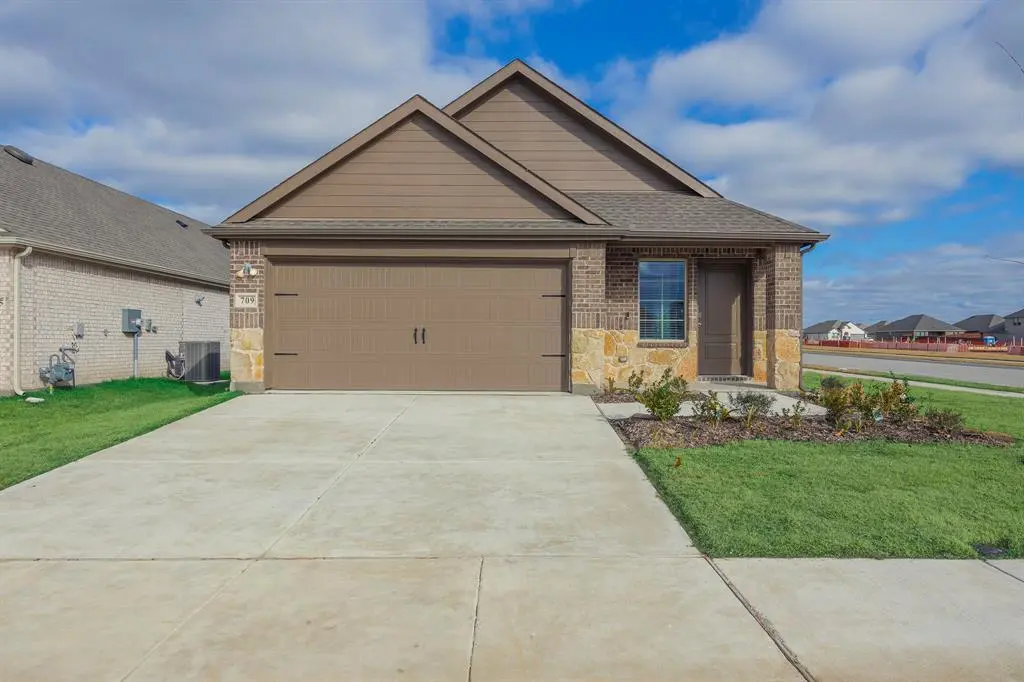
709 Chipper Trl · Lavon, TX
Flood risk 1/10 · Minimal
- FEMA flood zone
- X (unshaded)
- Chance of flooding over 30 yrs
- 0.0%
- Est. flood insurance / yr
- $507 – $1,088
Fire risk 3/10 · Minor
- Est. fire insurance / yr
- $1,222 – $2,270
Heat risk 8/10 · Major
- Hot days now (above 109°F)
- 7 days/yr
- Hot days in 30 yrs
- 24 days/yr
Wind risk 6/10 · Moderate
- Chance of severe wind over 30 yrs
- 27.0%
Air-quality risk 2/10 · Minimal
- Unhealthy air days now
- 2 days/yr
- Unhealthy air days in 30 yrs
- 2 days/yr
Risk factors via First Street. Map © Google.
Why this score? — see what drove the D grade
The composite is a weighted blend of 9 inputs, each scored 0–100. Each bar is that input's sub-score; the figure is the points it added to the 100-point composite (weight × sub-score).
- ARV discount +14.4/15.0
- Cash flow +8.5/30.0
- Condition / age +4.0/5.0
- 1% rule +3.3/10.0
- Livability +3.3/5.0
- Schools +3.2/10.0
- Rent growth +2.5/5.0
- DSCR +2.3/10.0
- Appreciation +0.0/10.0
$274,900
🖨 Deal sheet (PDF) 📄 Offer letter ✓ Due diligence
Listing remarks MLS
Welcome home to easy, comfortable living at 709 Chipper Trail in Lavon, TX. This nearly new 2025 ranch-style home is perfect for first-time buyers or anyone looking to downsize without giving up space or comfort. With 3 bedrooms, 2 full bathrooms, and 1,606 square feet, the layout is thoughtfully designed to be both functional and easy to maintain. The single-story design means no stairs and effortless day-to-day living. An open, light-filled living area flows smoothly into the kitchen and dining space, making it ideal for quiet nights at home or hosting family and friends. The 2-car garage offers plenty of room for parking and storage, while the private, fully fenced backyard is just right for pets, gardening, or relaxing outdoors. Built in 2025, this home gives you the peace of mind of modern construction, energy efficiency, and minimal maintenance—perfect if you’re buying your first home or simplifying your lifestyle. Located in a growing Lavon community with convenient access to shopping, dining, and major roads, this home offers comfort, value, and long-term ease. Priced at $274,900, this move-in-ready home is an excellent opportunity to start your next chapter with confidence.
Key facts
- Modern construction
- Single story design
- Ranch style home
Tags
Neighborhood map
What this means for you Summary
Snapshot
- This is a 3-bed/2.0-bath single-family listed at $275k. Condition is rated good.
Deal economics
- At list price, monthly cash flow is $-242 ($-3k/yr) — negative.
- To cash-flow at today's rent, offer at most $240k (12.7% below list).
- To meet the 1% rule (rent ≥ 1% of price), the offer needs to be $229k (16.5% below list).
- Recommended offer: $229k (16.5% below list) — sets the bar for 1% rule.
Location & tenants
- Location reads 66/100 on livability (#588 in TX) — a middle-class / working-renter tenant base. Strengths: employment A+, housing A+, cost of living B; Watch: amenities F, commute F, health & safety F.
- Community ISD (rural): math 30% / reading 38% proficiency, ranked #479 of 826 in TX (top 58%) — families likely to look elsewhere, expect single-tenant / working-renter base with shorter leases.
- Zoned schools: Leland E Edge Middle (math 25% / reading 35%, grade F, #1,056 of 1,662 statewide, top 65%, 931 students, 53% FRL) — zoned schools average 53% FRL vs 36% district-wide (18 pts higher); higher-poverty schools than district average — tighter screening recommended.
- Market conditions: 640 active listings in the ZIP; 40 comparable units currently listed for rent nearby; rentals at typical pace (median 26d on market — plan ~3-4 weeks tenant-placement turnaround); 42% of comp listings sitting > 30 days — soft ceiling on asking rent; high-income renter base; 19,194 units permitted in Collin County in 2024 (3,988 in 5+ unit buildings).
Forward outlook
- Local home prices are declining (-3.0%/yr); year-one equity from $2k of loan paydown is wiped out by about $8k of value loss. Plan a longer hold.
- Collin County population projected at +60% by 2050 — long-run rental-demand tailwind backs the buy-and-hold thesis.
Negotiation context
- It's been on market 161 days — a 12% lower offer ($242k) is reasonable based on typical stale-listing flexibility.
Risks & watch-outs
- Climate carrying-cost: major wind risk, 27% chance of damaging wind over 30y; extreme-heat days projected 7→24/yr by 2055 (HVAC capex compounding) — expect insurance premiums to compound above CPI over the hold.
Questions for the listing agent
- What do current leases actually rent for vs. the listed asking? Can we see a recent rent roll and the last 12 months of T-12 income?
- It's been on market 161 days. Have you received any prior offers? Is the seller open to a 17% concession, seller financing, or rate buy-down credit?
- What does the HOA fee cover, when was the last increase, and are there any pending special assessments or reserve-fund shortfalls?
- Why hasn't it sold? Are there any deal-killer items the seller is aware of (foundation, flood, title, zoning, code violations)?
- Is there a deadline driving the sale (1031 exchange, divorce, estate, relocation)? That informs how much negotiation room exists.
- The area grade is low — what's the realistic commute time and amenity access for the typical tenant pool here? Any planned neighborhood developments (good or bad) we should know about?
- What's the average days-on-market for RENTAL listings here right now (not sales)? A rising rental-DOM trend means longer vacancies and softer asking-rent achievability than the comps imply.
- What's the recent tenant-quality profile in this submarket — average credit score on applications, eviction rate, late-payment / NSF rate, and stable-employment percentage? A property-management company in the area should have these aggregated.
- How much new for-sale + rental construction is in the pipeline within 1–3 miles? Heavy new supply typically softens prices + rents 12–24 months out; constrained supply supports both.
Investment metrics
- 1% rule
- 0.83% ✗
- Cap rate
- 5.24%
- Cash-on-cash
- -3.77%
- DSCR
- 0.83
- GRM
- 10.0
CMA / ARV
- ARV (median comp)
- $324,949
- List price
- $274,900
- Delta
- -15.40%
- Verdict
- UNDERPRICED
- Comps
- 20 within 1.0 mi
Show comp detail 12 sales within ~0.75 mi
| Address | Dist | Beds/Ba | Sqft | Sold | Price | $/sf | Match |
|---|---|---|---|---|---|---|---|
| 946 Olive Dr | 0.11mi | 3/2.0 | 1,628 (+1%) | 1mo | $306,990 | $189 | 92 |
| 529 Epiphany Ln | 0.32mi | 3/2.0 | 1,604 (-0%) | 2mo | $319,990 | $199 | 83 |
| 424 Epiphany Ln | 0.40mi | 3/2.0 | 1,631 (+2%) | 1mo | $333,990 | $205 | 78 |
| 653 Glee Stem Rd | 0.32mi | 3/2.0 | 1,537 (-4%) | 2mo | $314,990 | $205 | 77 |
| 532 Lucas Ln | 0.47mi | 3/2.0 | 1,675 (+4%) | 0mo | $305,000 | $182 | 71 |
| 549 Epiphany Ln | 0.32mi | 3/2.0 | 1,429 (-11%) | 2mo | $268,990 | $188 | 65 |
| 881 River Ln | 0.54mi | 3/2.0 | 1,503 (-6%) | 1mo | $282,990 | $188 | 63 |
| 822 Sunflower | 0.49mi | 3/2.0 | 1,472 (-8%) | 0mo | $269,854 | $183 | 63 |
| 858 River Ln | 0.55mi | 3/2.0 | 1,504 (-6%) | 1mo | $282,990 | $188 | 63 |
| 868 Sunflower Rd | 0.54mi | 3/2.0 | 1,504 (-6%) | 2mo | $282,990 | $188 | 63 |
| 521 Epiphany Ln | 0.42mi | 3/2.0 | 1,429 (-11%) | 2mo | $259,990 | $182 | 61 |
| 416 Epiphany Ln | 0.40mi | 4/2.0 (+1) | 1,845 (+15%) | 1mo | $309,990 | $168 | 51 |
Match score weights: distance 35% · size 25% · config 20% · recency 20%. Top-matched comps best support the ARV.
Projected returns pro-forma
-3.0% appreciation · 3.0% rent growth · sell at horizon
- IRR
- -22.6%
- Equity multiple
- 0.22×
- Total profit
- $-59,827
- Equity at exit
- $40,988
- IRR
- -16.7%
- Equity multiple
- 0.07×
- Total profit
- $-71,414
- Equity at exit
- $23,768
Cash invested: $76,972 (down + closing). Projections, not guarantees.
Landlord ↔ Tenant lean methodology
- Overall (STATE)
- 87 Strongly Landlord-Friendly
- State Texas
- 87 Strongly Landlord-Friendly · R+5
- County
- — inherits STATE
- City
- — inherits STATE
ZIP-level market 75166
- Home prices YoY
- -9.9%
- Active inventory
- 640
- Price-to-rent
- 10.0×
Monthly cashflow live
- Estimated rent
- $2,295 high interval (Pro) →
- Mortgage (P&I)
- −$1,442
- Tax est. 1.5%
- −$344 /mo · $4,124/yr
- Insurance
- −$115
- HOA
- −$155
- Vacancy / Maint / Mgmt
- −$482
- Net cashflow
- $-242
Break-even live
Sensitivity live
| Price | -10% $-52 | -5% $-147 | +0% $-242 | +5% $-337 | +10% $-432 |
|---|---|---|---|---|---|
| Rent | -10% $-423 | -5% $-333 | +0% $-242 | +5% $-151 | +10% $-61 |
| Rate | -1.0pp $-104 | -0.5pp $-172 | base $-242 | +0.5pp $-313 | +1.0pp $-386 |
UW: 25.0% down · 7.5% · 30yr · 1.5% tax · 5.0% vac · 8.0% maint · 8.0% mgmt
Financing live
Cash to close
- Down payment
- $68,725
- Closing costs
- $8,247
- Reserves months
- —
- Total cash needed
- —
Loan-product check · same deal, 3 products live
Conventional
25% down · 7.5% · 30yr
- Down + closing
- —
- Monthly P&I
- —
- Monthly cashflow
- —
- DSCR
- —
- Eligible?
- —
Personal DTI + credit; lowest rate.
DSCR
20% down · 8.5% · 30yr
- Down + closing
- —
- Monthly P&I
- —
- Monthly cashflow
- —
- DSCR
- —
- Eligible?
- —
No personal income docs; deal must DSCR.
Hard money
10% down · 12.0% · 12mo
- Down + closing
- —
- Monthly P&I
- —
- Monthly cashflow
- —
- DSCR
- —
- Eligible?
- —
Short-term bridge; refi at stabilization.
Rent comps 40 comps
| Address | Beds | Baths | Sqft | Rent | $/sqft | DOM | Units | Dist |
|---|---|---|---|---|---|---|---|---|
| 536 London Dr Lavon, TX | 3.0 | 2.0 | 1589 | $1,950 | $1.23 | 17d | 1 | 0.03mi |
| 509 London Dr Lavon, TX | 3.0 | 2.0 | 1769 | $2,000 | $1.13 | 45d | 1 | 0.06mi |
| 557 London Dr Unit 557LD Lavon, TX | 3.0 | 2.0 | 1769 | $2,000 | $1.13 | 9d | 1 | 0.07mi |
| 946 Olive Dr Lavon, TX | 3.0 | 2.0 | 1628 | $2,650 | $1.63 | 9d | 1 | 0.09mi |
| 575 London Dr Lavon, TX | 3.0 | 2.0 | 1589 | $1,950 | $1.23 | 17d | 1 | 0.09mi |
| 592 Crestridge Dr Lavon, TX | 4.0 | 2.5 | 2095 | $2,195 | $1.05 | 45d | 1 | 0.11mi |
| 600 Crestridge Dr Lavon, TX | 4.0 | 2.0 | 1827 | $2,300 | $1.26 | 45d | 1 | 0.13mi |
| 772 Wellington Dr Lavon, TX | 3.0 | 2.0 | 1459 | $1,850 | $1.27 | 45d | 1 | 0.14mi |
| 787 Wellington Dr Lavon, TX | 3.0 | 2.0 | 1429 | $1,900 | $1.33 | 45d | 1 | 0.14mi |
| 778 Camden Dr Lavon, TX | 3.0 | 2.0 | 1636 | $1,750 | $1.07 | 14d | 1 | 0.15mi |
| 760 Richmond Dr Lavon, TX | 4.0 | 2.0 | 1779 | $3,000 | $1.69 | 45d | 1 | 0.15mi |
| 766 Camden Dr Lavon, TX | 3.0 | 2.0 | 1802 | $6,200 | $3.44 | 4d | 1 | 0.16mi |
| 736 Richmond Dr Lavon, TX | 4.0 | 2.0 | 1884 | $2,400 | $1.27 | 26d | 1 | 0.18mi |
| 684 Crestridge Dr Lavon, TX | 3.0 | 2.0 | 1634 | $1,850 | $1.13 | 45d | 1 | 0.18mi |
| 739 Wellington Dr Lavon, TX | 4.0 | 2.0 | 1884 | $1,950 | $1.04 | 45d | 1 | 0.19mi |
| 744 Devonshire Dr Lavon, TX | 3.0 | 2.0 | 1589 | $1,849 | $1.16 | 8d | 1 | 0.19mi |
| 759 Crestridge Dr Lavon, TX | 3.0 | 2.0 | 1827 | $2,000 | $1.09 | 14d | 1 | 0.25mi |
| 902 Tulip TRL Lavon, TX | 4.0 | 2.5 | 2087 | $2,500 | $1.20 | 45d | 1 | 0.28mi |
| 755 Revere Ln Lavon, TX | 3.0 | 2.0 | 1829 | $2,100 | $1.15 | 26d | 1 | 0.48mi |
| 865 River Ln Lavon, TX | 4.0 | 2.5 | 2068 | $2,400 | $1.16 | 7d | 1 | 0.52mi |
| 872 Sunflower Rd Lavon, TX | 3.0 | 2.0 | 1237 | $2,000 | $1.62 | 9d | 1 | 0.54mi |
| 858 River Ln Lavon, TX | 3.0 | 2.0 | 1504 | $2,200 | $1.46 | 18d | 1 | 0.54mi |
| 471 Harding Ln Lavon, TX | 4.0 | 2.0 | 1645 | $1,950 | $1.19 | 45d | 1 | 0.79mi |
| 453 Harding Ln Lavon, TX | 4.0 | 2.5 | 2155 | $2,200 | $1.02 | 45d | 1 | 0.81mi |
| 436 Grant Ln Lavon, TX | 3.0 | 2.0 | 1755 | $2,299 | $1.31 | 5d | 1 | 0.85mi |
| 476 Eisenhower Ln Lavon, TX | 3.0 | 2.0 | 1544 | $1,875 | $1.21 | 22d | 1 | 0.86mi |
| 590 Arthur Dr Lavon, TX | 3.0 | 2.0 | 1556 | $1,850 | $1.19 | 45d | 1 | 0.94mi |
| 382 Armstrong Ln Lavon, TX | 3.0 | 2.5 | 1308 | $1,795 | $1.37 | 22d | 1 | 0.96mi |
| 393 Orbit Dr Lavon, TX | 3.0 | 2.0 | 1268 | $1,750 | $1.38 | 20d | 1 | 0.97mi |
| 366 Armstrong Ln Lavon, TX | 3.0 | 2.0 | 1268 | $1,750 | $1.38 | 26d | 1 | 0.97mi |
| 387 Orbit Dr Lavon, TX | 3.0 | 2.5 | 1361 | $1,775 | $1.30 | 18d | 1 | 0.98mi |
| 355 Armstrong Ln Lavon, TX | 3.0 | 2.0 | 1268 | $1,695 | $1.34 | 26d | 1 | 1.01mi |
| 365 Orbit Dr Lavon, TX | 3.0 | 2.5 | 1361 | $1,795 | $1.32 | 4d | 1 | 1.01mi |
| 366 Schirra Ct Lavon, TX | 3.0 | 2.0 | 1165 | $1,650 | $1.42 | 45d | 1 | 1.02mi |
| 332 Schirra Ct Lavon, TX | 3.0 | 2.0 | 1202 | $1,695 | $1.41 | 26d | 1 | 1.05mi |
| 332 Schirra Ct Lavon, TX | 3.0 | 2.0 | 1202 | $1,695 | $1.41 | 22d | 1 | 1.05mi |
| 345 Orbit Dr Lavon, TX | 3.0 | 2.0 | 1268 | $1,685 | $1.33 | 45d | 1 | 1.05mi |
| 341 Orbit Dr Lavon, TX | 3.0 | 2.5 | 1361 | $1,795 | $1.32 | 45d | 1 | 1.06mi |
| 339 Orbit Dr Lavon, TX | 3.0 | 2.5 | 1361 | $1,795 | $1.32 | 45d | 1 | 1.06mi |
| 315 Orbit Dr Lavon, TX | 3.0 | 2.0 | 1268 | $1,750 | $1.38 | 45d | 1 | 1.11mi |
HOA detail
- Monthly dues
- $155 · $1,860/yr
Listing history 16 events
-
2026-06-21days on market $274,900 Active 161 DOM
-
2026-06-18days on market $274,900 Active 158 DOM
-
2026-06-17days on market $274,900 Active 157 DOM
-
2026-06-16days on market $274,900 Active 156 DOM
-
2026-06-15days on market $274,900 Active 155 DOM
-
2026-06-13days on market $274,900 Active 153 DOM
-
2026-06-13days on market $274,900 Active 152 DOM
-
2026-06-09days on market $274,900 Active 149 DOM
-
2026-06-08days on market $274,900 Active 148 DOM
-
2026-06-07days on market $274,900 Active 147 DOM
-
2026-06-04days on market $274,900 Active 144 DOM
-
2026-06-03days on market $274,900 Active 143 DOM
-
2026-06-02days on market $274,900 Active 142 DOM
-
2026-06-01days on market $274,900 Active 141 DOM
-
2026-05-31days on market $274,900 Active 140 DOM
-
2026-01-07$274,900 Active 1222-char remark
Show marketing remark (1222 chars)
Welcome home to easy, comfortable living at 709 Chipper Trail in Lavon, TX. This nearly new 2025 ranch-style home is perfect for first-time buyers or anyone looking to downsize without giving up space or comfort. With 3 bedrooms, 2 full bathrooms, and 1,606 square feet, the layout is thoughtfully designed to be both functional and easy to maintain. The single-story design means no stairs and effortless day-to-day living. An open, light-filled living area flows smoothly into the kitchen and dining space, making it ideal for quiet nights at home or hosting family and friends. The 2-car garage offers plenty of room for parking and storage, while the private, fully fenced backyard is just right for pets, gardening, or relaxing outdoors. Built in 2025, this home gives you the peace of mind of modern construction, energy efficiency, and minimal maintenance—perfect if you’re buying your first home or simplifying your lifestyle. Located in a growing Lavon community with convenient access to shopping, dining, and major roads, this home offers comfort, value, and long-term ease. Priced at $274,900, this move-in-ready home is an excellent opportunity to start your next chapter with confidence.
ⓘ Source: listings_history table (triggers on properties + properties_extension) + one-shot
backfill from property_details.listing_events for pre-trigger history.
Climate risk First Street
- Flood 1/10 Low FEMA zone X (unshaded) · 0% chance over 30 yrs
- Wildfire 3/10 Moderate
- Heat 8/10 Severe 7 d/yr ≥109°F today · 24 d/yr by 30 yrs out
- Wind 6/10 Major 27% chance of damaging wind over 30 yrs
- Air quality 2/10 Low 2 unhealthy d/yr today · 2 by 30 yrs out
Nearby sold comps map
Loading sold comps map…
Walkable amenities ~0.75 mi
Loading nearby amenities…
Taxation est. · year 1
- Rental income
- $27,536
- − Mortgage interest
- −$15,399
- − Property taxes
- −$4,124
- − Insurance
- −$1,374
- − Repairs & maintenance
- −$2,203
- − Management
- −$2,203
- − HOA
- −$1,860
- − Depreciation
- −$7,997
- Taxable loss
- −$7,623
- Est. tax savings @ 24.0%
- +$1,830
- After-tax cash flow
- $-1,074/yr
For passive investors: Depreciation is non-cash, so a rental often shows a tax loss while cash-flowing — sheltering income. Rental losses are passive: they offset passive income freely, and up to $25,000/yr can offset ordinary (W-2) income if you actively participate and your MAGI is under $100k (phasing out to $0 by $150k); unused losses carry forward. On sale, claimed depreciation is recaptured at up to 25%, and gains may owe capital-gains tax (a 1031 exchange can defer both). Figures are a year-1 estimate at your 24.0% rate — not tax advice; consult a CPA.
Condition & rehab AI · 12 photos
This nearly new ranch-style home is in good condition with modern finishes and a well-maintained exterior. It's ideal for first-time buyers or downsizers looking for a comfortable living space.
Value-add opportunities
- Resale Paint exterior trim — Enhances curb appeal
- Rental Clean gutters — Keeps home in good condition
Renovation cost estimate screening
Value-add ROI direction
- Resale Paint exterior trim — Enhances curb appeal ↑
- Rental Clean gutters — Keeps home in good condition ↑
ⓘ Cost ranges are severity-bucket heuristics (US national rule-of-thumb). Get contractor quotes + a written scope before underwriting a rehab budget.
Schools (NCES district)
- District
- Community ISD
- NCES district ID
- 4814850
- Math proficiency
- 30% ▼ -23.00%
- Reading proficiency
- 38% ▼ -11.00%
- Median HH income
- $71,841
- Composite
- 31.58/100
- National rank
- #5951
- State rank
- #479 of 826 in TX
Livability — Lavon
- Score
- 66/100
- State rank
- #588
- US rank
- #11230
Category grades
Schools grade is shown separately in the Schools card above.
Census & demographics
- Census place
- Lavon, TX
- County
- Collin County · 1,159,394 people
- City population
- 6,989
- Metro
- Dallas-Fort Worth-Arlington, TX
- Population (ZIP)
- 6,989
- Household income
- $132,101
- Rent vs Own
- Severe rent burden
- 41.0
Population outlook (Collin County) Hauer SSP2
- Today (2025)
- 1,210,074 people
- By 2030
- 1,358,201 · +12.2%
- By 2040
- 1,654,061 · +36.7%
- By 2050
- 1,937,359 · +60.1%
- By 2075
- 2,567,039 · +112.1%
- By 2100
- 2,952,048 · +144.0%
Race, ethnicity, and origin ACS 2023
- Neighborhood character
- Diverse neighborhood (Simpson 0.63)
- Race & ethnicity
- White 55% Hispanic / Latino 24% Two or more races 15% Black 7% Asian 4% Native American 2% Pacific Islander 1%
- Hispanic origin (detail)
- Mexican 15% Puerto Rican 3%
- Common ancestry
- Slovak 2% Serbian 2% Lithuanian 2%
- Foreign-born
- 8% · Canada
- Languages at home
- 84% English-only · Spanish 11% Other Indo-European 3% Arabic 1%
Political lean MEDSL · Collin
- 2024 margin
- R (+11.1) · D 43.1% · R 54.3% · Other 2.6%
- 2008→2024 swing
- +14.4pp toward D · 2008: -25.6pp · 2024: -11.1pp
- All cycles
- 2024: R+11.1 2020: R+4.3 2016: R+17.0 2012: R+31.6 2008: R+25.6
Not yet ingested
- Civics
- —
Market trends
- HPI YoY
- ▼ -24.22%
- Current HPI
- 221.0
- Rent YoY
- —
- Metro
- Dallas-Fort Worth-Arlington, TX
- State GDP YoY
- ▲ 3.95%
- F500 in state
- 110
Industry mix (Fortune 500 HQ in TX)
| Industry | F500 HQs | Revenue |
|---|---|---|
| Energy | 16 | $1,198B |
|
||
| Technology | 5 | $198B |
|
||
| Engineering / Construction | 4 | $72B |
|
||
| Energy Services | 3 | $60B |
|
||
| Utilities | 3 | $41B |
|
||
| Healthcare | 2 | $330B |
|
||
Price history
1 event — show timeline
- 2026-01-07 Listed $274,900 NTREIS
Cash-flow waterfall
monthlySold comps — $/sqft
last 12 mo · ≤1 miLoading sold comps…