 Triplex
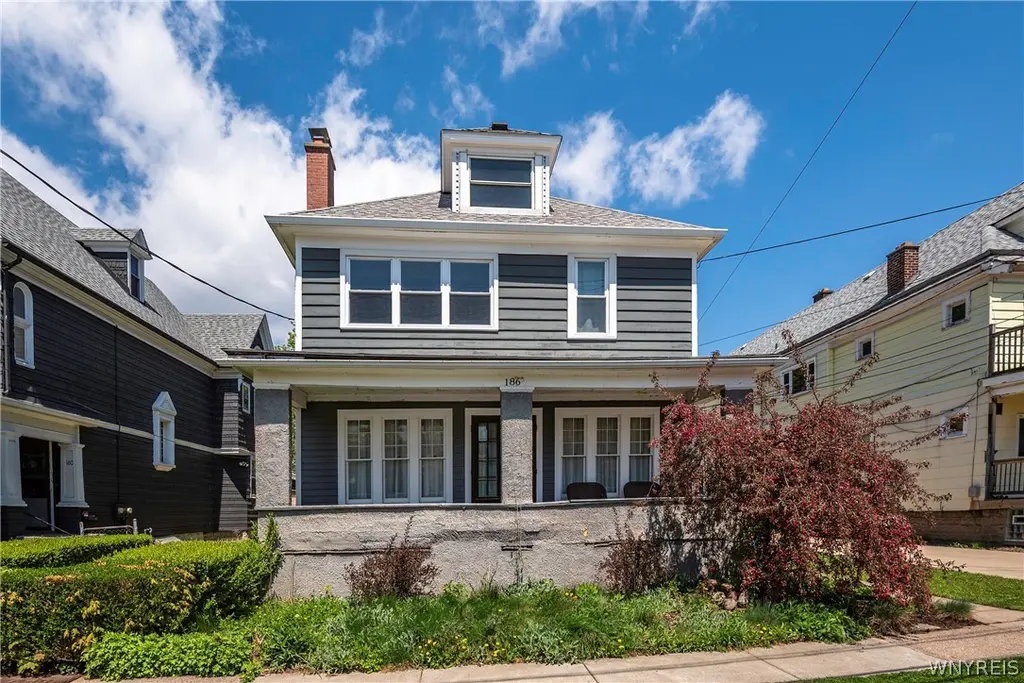
186 Bird Ave · Buffalo, NY
Flood risk 1/10 · Minimal
- FEMA flood zone
- X (unshaded)
- Chance of flooding over 30 yrs
- 0.0%
- Est. flood insurance / yr
- $473 – $860
Fire risk 1/10 · Minimal
- Est. fire insurance / yr
- $691 – $1,283
Heat risk 3/10 · Minor
- Hot days now (above 92°F)
- 7 days/yr
- Hot days in 30 yrs
- 15 days/yr
Wind risk 1/10 · Minimal
- Chance of severe wind over 30 yrs
- —
Air-quality risk 4/10 · Minor
- Unhealthy air days now
- 4 days/yr
- Unhealthy air days in 30 yrs
- 9 days/yr
Risk factors via First Street. Map © Google.
Why this score? — see what drove the D+ grade
The composite is a weighted blend of 9 inputs, each scored 0–100. Each bar is that input's sub-score; the figure is the points it added to the 100-point composite (weight × sub-score).
- Cash flow +15.3/30.0
- Appreciation +8.8/10.0
- DSCR +4.7/10.0
- 1% rule +4.2/10.0
- Livability +3.9/5.0
- Schools +3.3/10.0
- Condition / age +2.5/5.0
- Rent growth +2.4/5.0
- ARV discount +0.0/15.0
$489,900
🖨 Deal sheet (PDF) 📄 Offer letter ✓ Due diligence
Multi-family units
County records classify this as Multi-Family (2-4 Unit). Listing-text estimate: 3 units. confirmed
Listing remarks
Welcome to 186 Bird Ave. A rare opportunity on historic Bird Avenue, is one of Buffalo’s West Side hidden gems. This beautifully restored 3-unit property blends timeless character with modern updates, creating a truly move-in-ready investment or owner-occupant dream. One of the standout features is the incredible detached 5-bay garage offering an additional 1,127 sq ft. Whether you need parking for 5 vehicles, a workshop, studio, storage, or future creative use, the possibilities are endless. Major improvements include repointed brick, insulated garage doors, tear-off roof, glass block windows, and immaculate concrete floors. An equally well-maintained attached 1-car garage, privacy f
Key facts
- Repointed brick
- Glass block windows
- Tear-off roof
Tags
Property features AI
Finance
- Other: Operating expense details: see remarks
- Financial info: Owner pays trash collection and water; Rent includes trash collection and water; Three separate electric meters; Three separate gas meters; Three total units with separate utilities; Unit rents reported: one 3-bed unit $850, one 2-bed unit $850, one 1-bed unit $750 (actual rents listed)
Exterior
- Parking: Attached garage (concrete); 6 garage spaces
- Utilities: Electricity connected (circuit breakers); Sewer connected; Public water connected; Cable available
- Home design: 2-story building; Existing (previously built) condition
- Construction: Composite siding; Copper plumbing; Stone foundation; Attic/crawl hatchway(s) insulated
- Exterior features: Balcony; Covered and open porch; Fully fenced yard; Near public transit; Rectangular lot; City street frontage
Interior
- Kitchen: Eat-in kitchens in units; Oven/range; Refrigerator; Dishwasher (in one unit)
- Bedrooms: One 3-bedroom unit; One 2-bedroom unit; One 1-bedroom unit
- Flooring: Hardwood flooring; Tile flooring; Varies by area/unit
- Bathrooms: Three full bathrooms (in building total); One half bathroom (in building total)
- Heating & cooling: Gas heating; Baseboard heating; Radiator heating
- Interior features: Attic; Ceiling fans; Natural woodwork; Storm windows; Thermal windows
- Laundry & utility: Washer and dryer in units (washer/dryer present in units; washer hookup also noted); Gas water heater
Neighborhood map
What this means for you Summary
Snapshot
- This is a 3 × 2-bed/1.2-bath units multifamily listed at $490k.
Deal economics
- At list price, monthly cash flow is $183 ($2k/yr) — positive. Per door: $61/mo.
- The deal already cash-flows at list — no discount required.
- To meet the 1% rule (rent ≥ 1% of price), the offer needs to be $452k (7.8% below list).
- Recommended offer: $452k (7.8% below list) — sets the bar for 1% rule.
Location & tenants
- Location reads 77/100 on livability (#195 in NY, #3,011 nationally) — a middle-class / working-renter tenant base. Strengths: commute A+, housing A+, health & safety A+; Watch: crime F, employment D-.
- Buffalo City School District (urban): math 41% / reading 40% proficiency, ranked #535 of 590 in NY (top 91%) — families likely to look elsewhere, expect single-tenant / working-renter base with shorter leases; 75% free/reduced lunch — lower-income household profile, screen leases tightly.
- Zoned schools: International School (math 8% / reading 17%, grade F, #2,048 of 2,108 statewide, top 97%, 981 students, 92% FRL); Hutchinson Central Technical High School (math 96% / reading 32%, grade B-, #807 of 1,100 statewide, top 73%, 1,175 students, 78% FRL).
- Market conditions: Rents soft (-0.5%/yr); 138 active listings in the ZIP; 1,244 units permitted in Erie County in 2024 (563 in 5+ unit buildings).
- At $4,517/mo this rent would consume 101% of the median local household income ($54k/yr) (locally 1501% of renters already pay >50% of income on rent) — very limited rent-growth headroom before tenants either downsize or default.
Forward outlook
- In year one you build about $40k of equity ($3k loan paydown + $37k appreciation (7.5% local appreciation)).
- At projected returns (7.5% appreciation + 0.0% rent growth), your $137k cash investment doubles in ~4 years — after that, you're playing with house money.
- By year 2, paydown + projected appreciation supports a ~$64k cash-out refi (75% LTV) — recoverable capital for the next deal without selling this one.
Negotiation context
- It's been on market 18 days — a 2% lower offer ($483k) is reasonable based on typical stale-listing flexibility.
- 2 sale attempts since 13y ago with the ask held roughly flat each time — persistent listings suggest the price (not the market) is what's stuck; bring a comps-based counter.
- Current owner paid $87k; list at $490k implies a 463% gain — meaningful room to come down on a strong offer.
Risks & watch-outs
- Watch-outs: built in 1880 — expect roof / HVAC / electrical / plumbing capex.
Questions for the listing agent
- Can we see the unit-by-unit rent roll, current vacancy, and any below-market leases? What's the average tenancy length?
- What capital expenditures (roof, boiler, parking lot, exteriors) have been made in the last 5 years, and what's planned in the next 2?
- Built in 1880 — when were the roof, HVAC, electrical panel, plumbing, and water heater last replaced?
- Is there a deadline driving the sale (1031 exchange, divorce, estate, relocation)? That informs how much negotiation room exists.
- Crime grade is F in this area — have there been break-ins, vandalism, or insurance claims at this property in the last 3 years? What carrier currently insures it and at what premium?
- The area grade is low — what's the realistic commute time and amenity access for the typical tenant pool here? Any planned neighborhood developments (good or bad) we should know about?
- What's the average days-on-market for RENTAL listings here right now (not sales)? A rising rental-DOM trend means longer vacancies and softer asking-rent achievability than the comps imply.
- What's the recent tenant-quality profile in this submarket — average credit score on applications, eviction rate, late-payment / NSF rate, and stable-employment percentage? A property-management company in the area should have these aggregated.
- How much new apartment / multifamily construction is in the pipeline within 1–3 miles? Heavy new supply (>2% of stock underway) typically softens rents 12–24 months out; light construction supports rent growth.
Investment metrics
- 1% rule
- 0.92% ✗
- Cap rate
- 6.74%
- Cash-on-cash
- 1.60%
- DSCR
- 1.07
- GRM
- 9.0
CMA / ARV
- ARV (median comp)
- $379,554
- List price
- $489,900
- Delta
- 29.07%
- Verdict
- OVERPRICED
- Comps
- 20 within 1.0 mi
Show comp detail 10 sales within ~0.75 mi
| Address | Dist | Beds/Ba | Sqft | Sold | Price | $/sf | Match |
|---|---|---|---|---|---|---|---|
| 330 Potomac Ave | 0.28mi | 6/4.0 | 2,896 (-10%) | 6mo | $263,000 | $91 | 65 |
| 640 Grant St | 0.40mi | 6/3.0 | 2,858 (-11%) | 12mo | $275,000 | $96 | 51 |
| 417 W Delavan Ave | 0.50mi | 6/3.0 | 3,566 (+12%) | 5mo | $451,000 | $126 | 51 |
| 452 Potomac Ave | 0.49mi | 6/2.0 | 2,976 (-7%) | 11mo | $450,000 | $151 | 50 |
| 153 Dearborn St | 0.67mi | 6/2.0 | 2,920 (-9%) | 4mo | $266,000 | $91 | 44 |
| 147 Parkdale Ave | 0.51mi | 6/4.0 | 2,850 (-11%) | 16mo | $330,000 | $116 | 42 |
| 61 Claremont Ave | 0.65mi | 6/2.0 | 2,912 (-9%) | 8mo | $411,000 | $141 | 42 |
| 610 Ashland Ave | 0.74mi | 6/2.0 | 3,050 (-5%) | 16mo | $450,000 | $148 | 39 |
| 1040 Elmwood Ave | 0.75mi | 6/4.0 | 2,840 (-11%) | 16mo | $460,000 | $162 | 31 |
| 50 Arnold St | 0.70mi | 7/2.0 (+1) | 2,905 (-9%) | 15mo | $204,000 | $70 | 29 |
Match score weights: distance 35% · size 25% · config 20% · recency 20%. Top-matched comps best support the ARV.
Projected returns pro-forma
7.51% appreciation · 0.0% rent growth · sell at horizon
- IRR
- 19.0%
- Equity multiple
- 2.35×
- Total profit
- $185,112
- Equity at exit
- $356,046
- IRR
- 17.0%
- Equity multiple
- 4.68×
- Total profit
- $504,214
- Equity at exit
- $691,883
Cash invested: $137,172 (down + closing). Projections, not guarantees.
Landlord ↔ Tenant lean methodology
- Overall (STATE)
- 15 Strongly Tenant-Friendly
- State New York
- 15 Strongly Tenant-Friendly · D+10
- County
- — inherits STATE
- City
- — inherits STATE
ZIP-level market 14213
- Home prices YoY
- 1.7%
- Rents YoY
- -0.5%
- Active inventory
- 138
- Price-to-rent
- 27.1×
Monthly cashflow live
- Estimated rent
- $4,517 high interval (Pro) →
- Mortgage (P&I)
- −$2,569
- Tax est. 1.5%
- −$612 /mo · $7,348/yr
- Insurance
- −$204
- HOA
- −$0
- Vacancy / Maint / Mgmt
- −$949
- Net cashflow
- $183
Break-even live
Sensitivity live
| Price | -10% $521 | -5% $352 | +0% $183 | +5% $14 | +10% $-156 |
|---|---|---|---|---|---|
| Rent | -10% $-174 | -5% $4 | +0% $183 | +5% $361 | +10% $540 |
| Rate | -1.0pp $430 | -0.5pp $307 | base $183 | +0.5pp $56 | +1.0pp $-73 |
3-unit breakdown (identical units grouped — click to expand)
| Units | Beds | Baths | Est. rent |
|---|---|---|---|
| 3× units | 2 | 1.2 | $4,518 |
| #1 | 2 | 1.2 | $1,506 |
| #2 | 2 | 1.2 | $1,506 |
| #3 | 2 | 1.2 | $1,506 |
| Total (3 units) | $4,517 | ||
UW: 25.0% down · 7.5% · 30yr · 1.5% tax · 5.0% vac · 8.0% maint · 8.0% mgmt
Financing live
Cash to close
- Down payment
- $122,475
- Closing costs
- $14,697
- Reserves months
- —
- Total cash needed
- —
Loan-product check · same deal, 3 products live
Conventional
25% down · 7.5% · 30yr
- Down + closing
- —
- Monthly P&I
- —
- Monthly cashflow
- —
- DSCR
- —
- Eligible?
- —
Personal DTI + credit; lowest rate.
DSCR
20% down · 8.5% · 30yr
- Down + closing
- —
- Monthly P&I
- —
- Monthly cashflow
- —
- DSCR
- —
- Eligible?
- —
No personal income docs; deal must DSCR.
Hard money
10% down · 12.0% · 12mo
- Down + closing
- —
- Monthly P&I
- —
- Monthly cashflow
- —
- DSCR
- —
- Eligible?
- —
Short-term bridge; refi at stabilization.
Listing history 5 events
-
2026-05-11$489,900 Active 2190-char remark
-
2013-07-08soldstatus $87,000
-
2013-07-03soldstatus $87,000
-
2013-07-03soldstatus $87,000
-
2013-03-26$90,000
ⓘ Source: listings_history table (triggers on properties + properties_extension) + one-shot
backfill from property_details.listing_events for pre-trigger history.
Climate risk First Street
- Flood 1/10 Low FEMA zone X (unshaded) · 0% chance over 30 yrs
- Wildfire 1/10 Low
- Heat 3/10 Moderate 7 d/yr ≥92°F today · 15 d/yr by 30 yrs out
- Wind 1/10 Low
- Air quality 4/10 Moderate 4 unhealthy d/yr today · 9 by 30 yrs out
Nearby sold comps map
Loading sold comps map…
Walkable amenities ~0.75 mi
Loading nearby amenities…
Taxation est. · year 1
- Rental income
- $54,204
- − Mortgage interest
- −$27,442
- − Property taxes
- −$7,348
- − Insurance
- −$2,450
- − Repairs & maintenance
- −$4,336
- − Management
- −$4,336
- − Depreciation
- −$14,252
- Taxable loss
- −$5,960
- Est. tax savings @ 24.0%
- +$1,430
- After-tax cash flow
- $3,625/yr
For passive investors: Depreciation is non-cash, so a rental often shows a tax loss while cash-flowing — sheltering income. Rental losses are passive: they offset passive income freely, and up to $25,000/yr can offset ordinary (W-2) income if you actively participate and your MAGI is under $100k (phasing out to $0 by $150k); unused losses carry forward. On sale, claimed depreciation is recaptured at up to 25%, and gains may owe capital-gains tax (a 1031 exchange can defer both). Figures are a year-1 estimate at your 24.0% rate — not tax advice; consult a CPA.
Schools (NCES district)
- District
- Buffalo City School District
- NCES district ID
- 3605850
- Math proficiency
- 41% ▲ 11.00%
- Reading proficiency
- 40% ▲ 7.00%
- Median HH income
- $31,665
- Composite
- 33.17/100
- National rank
- #5544
- State rank
- #535 of 590 in NY
Livability — Buffalo
- Score
- 77/100
- State rank
- #195
- US rank
- #3011
Category grades
Schools grade is shown separately in the Schools card above.
Census & demographics
- Census place
- Buffalo, NY
- County
- Erie County · 714,559 people
- City population
- 440,021
- Metro
- Buffalo-Cheektowaga, NY
- Population (ZIP)
- 24,107
- Household income
- $53,870
- Rent vs Own
- Severe rent burden
- 1501.0
Population outlook (Erie County) Hauer SSP2
- Today (2025)
- 933,037 people
- By 2030
- 935,181 · +0.2%
- By 2040
- 928,531 · -0.5%
- By 2050
- 905,725 · -2.9%
- By 2075
- 834,037 · -10.6%
- By 2100
- 708,033 · -24.1%
Race, ethnicity, and origin ACS 2023
- Neighborhood character
- Highly diverse neighborhood (Simpson 0.70)
- Race & ethnicity
- White 46% Hispanic / Latino 20% Black 18% Asian 12% Two or more races 10%
- Hispanic origin (detail)
- Mexican 1% Puerto Rican 16% Dominican 1%
- Common ancestry
- Romanian 6% Slovak 3% Lithuanian 3%
- Foreign-born
- 16% · Philippines, Canada, India
- Languages at home
- 68% English-only · Spanish 12% Other Asian/Pacific 7% Arabic 3%
Political lean MEDSL · Erie
- 2024 margin
- Lean D (+9.7) · D 54.8% · R 45.2%
- 2008→2024 swing
- -7.9pp toward R · 2008: 17.5pp · 2024: 9.7pp
- All cycles
- 2024: D+9.7 2020: D+14.7 2016: D+4.8 2012: D+15.6 2008: D+17.5
Not yet ingested
- Civics
- —
Market trends
- HPI YoY
- ▲ 7.51%
- Current HPI
- 448.4879
- Rent YoY
- ▼ -0.49%
- Metro
- Buffalo-Cheektowaga, NY
- State GDP YoY
- ▲ 2.60%
- F500 in state
- 92
Industry mix (Fortune 500 HQ in NY)
| Industry | F500 HQs | Revenue |
|---|---|---|
| Financial Services | 10 | $950B |
|
||
| Consumer Goods | 9 | $162B |
|
||
| Insurance | 4 | $225B |
|
||
| Telecommunications | 2 | $144B |
|
||
| Pharmaceuticals | 2 | $112B |
|
||
| Media / Entertainment | 2 | $69B |
|
||
Price history
+444.3% since first listed6 events — show timeline
- 2026-05-29 Pending — WNYREIS
- 2026-05-11 Listed $489,900 WNYREIS
- 2013-07-08 Sold (MLS) $87,000 WNYREIS
- 2013-07-03 Sold (Public Records) $87,000 Public Records
- 2013-07-03 Sold (Public Records) $87,000 Public Records
- 2013-03-26 Listed $90,000 WNYREIS
Property tax history
+11.1%/yrLatest (2025): $865 · +12.7% YoY. Source: county tax records.
Cash-flow waterfall
monthlySold comps — $/sqft
last 12 mo · ≤1 miLoading sold comps…