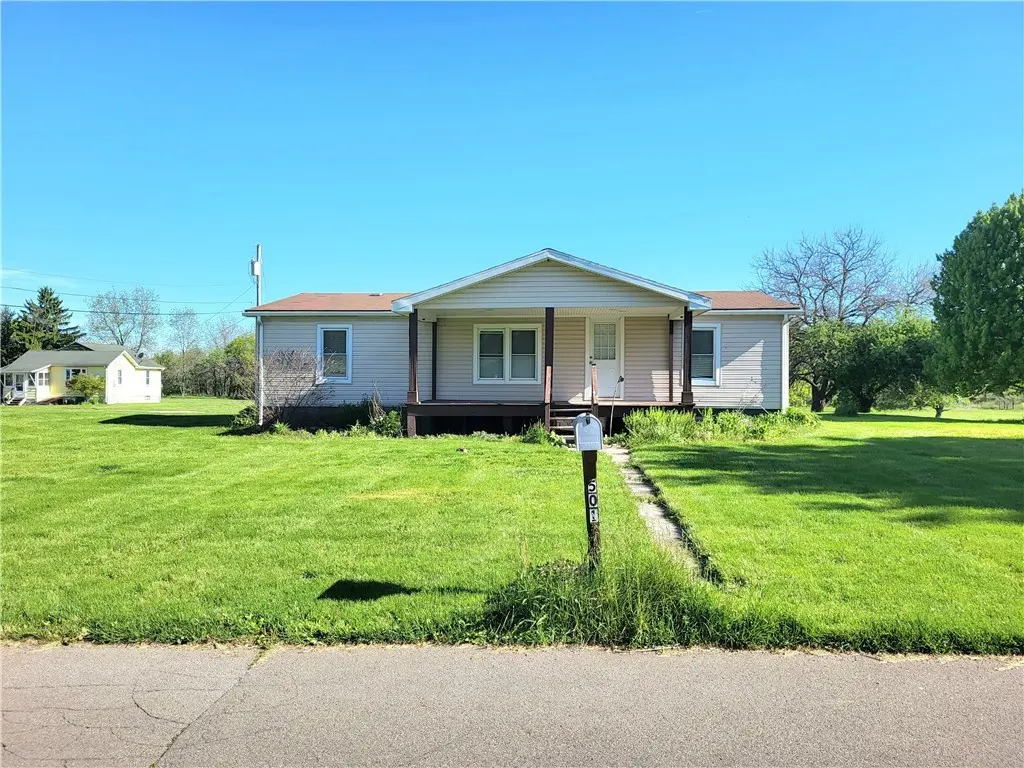
501 Wallage Ave · Bessemer, PA
Flood risk 1/10 · Minimal
- FEMA flood zone
- X (unshaded)
- Chance of flooding over 30 yrs
- 0.0%
- Est. flood insurance / yr
- $473 – $860
Fire risk 3/10 · Minor
- Est. fire insurance / yr
- $511 – $949
Heat risk 3/10 · Minor
- Hot days now (above 96°F)
- 7 days/yr
- Hot days in 30 yrs
- 17 days/yr
Wind risk 1/10 · Minimal
- Chance of severe wind over 30 yrs
- —
Air-quality risk 2/10 · Minimal
- Unhealthy air days now
- 1 days/yr
- Unhealthy air days in 30 yrs
- 3 days/yr
Risk factors via First Street. Map © Google.
Why this score? — see what drove the B- grade
The composite is a weighted blend of 9 inputs, each scored 0–100. Each bar is that input's sub-score; the figure is the points it added to the 100-point composite (weight × sub-score).
- Cash flow +26.1/30.0
- DSCR +8.8/10.0
- 1% rule +8.1/10.0
- ARV discount +7.5/15.0
- Appreciation +5.7/10.0
- Schools +4.4/10.0
- Livability +3.6/5.0
- Rent growth +2.5/5.0
- Condition / age +2.5/5.0
$79,900
🖨 Deal sheet 📄 Offer letter ✓ Due diligence
Listing remarks MLS
Ranch Home on Beautiful 1.1478acres. New Pella Windows, New Door, New floor in the bedroom, cute kitchen with corner sink. Seller has not signed any lease or rights over to the gas company
Key facts
- Expansive yard
- One-level living
- Private rural feel
Tags
Property features AI
Exterior
- Parking: Off-street parking; 2 parking spaces
- Utilities: Public water; Public sewer
- Home design: Single-story; Resale property; Vinyl siding
- Construction: Vinyl siding
- Exterior features: 1.15-acre lot
Interior
- Flooring: Carpet flooring; Vinyl flooring
- Bathrooms: 1 full bathroom; 1 half bathroom
- Heating & cooling: Baseboard heating; Electric heating
- Interior features: Window treatments
Neighborhood map
What this means for you Summary
Snapshot
- This is a 2-bed/2.0-bath single-family listed at $80k.
Deal economics
- At list price, monthly cash flow is $201 ($2k/yr) — positive.
- The deal already cash-flows at list — no discount required.
- Meets the 1% rule at list price ($1k rent vs $80k).
- Recommended offer: $78k (3.0% below list) — sets the bar for market timing.
Location & tenants
- Location reads 71/100 on livability (#718 in PA) — a middle-class / working-renter tenant base. Strengths: crime A+, cost of living A+, housing A+; Watch: health & safety C-, amenities F, commute F.
- Mohawk Area SD (rural): math 41% / reading 62% proficiency, ranked #159 of 539 in PA (top 30%) — acceptable for families but not a draw, mixed tenant base, ~2y average lease.
- Market conditions: 6 active listings in the ZIP; 51 units permitted in Lawrence County in 2024 (0 in 5+ unit buildings).
Forward outlook
- In year one you build about $2k of equity ($552 loan paydown + $1k appreciation (1.4% local appreciation)).
- Lawrence County population projected at -25% by 2050 — secular population decline; favor cash flow + early exit over multi-decade hold.
- At projected returns (1.4% appreciation + 3.0% rent growth), your $22k cash investment doubles in ~5 years — after that, you're playing with house money.
Negotiation context
- It's been on market 37 days — a 3% lower offer ($78k) is reasonable based on typical stale-listing flexibility.
- 2 sale attempts since 14y ago with the ask held roughly flat each time — persistent listings suggest the price (not the market) is what's stuck; bring a comps-based counter.
- Current owner paid $60k; 33% above their basis — modest negotiation headroom, anchor on the comps not their cost.
Risks & watch-outs
- Watch-outs: property tax is 2.6% of price.
Questions for the listing agent
- It's been on market 37 days. Have you received any prior offers? Is the seller open to a 3% concession, seller financing, or rate buy-down credit?
- Property tax is high relative to price — has the assessment been appealed recently, and will the sale trigger a re-assessment?
- Is there a deadline driving the sale (1031 exchange, divorce, estate, relocation)? That informs how much negotiation room exists.
- Schools are B-rated — typically a magnet for longer-tenancy family renters. What's the average tenant stay here, and is there a school-zone premium baked into asking?
- What's the average days-on-market for RENTAL listings here right now (not sales)? A rising rental-DOM trend means longer vacancies and softer asking-rent achievability than the comps imply.
- What's the recent tenant-quality profile in this submarket — average credit score on applications, eviction rate, late-payment / NSF rate, and stable-employment percentage? A property-management company in the area should have these aggregated.
- How much new for-sale + rental construction is in the pipeline within 1–3 miles? Heavy new supply typically softens prices + rents 12–24 months out; constrained supply supports both.
Investment metrics
- 1% rule
- 1.31% ✓
- Cap rate
- 9.32%
- Cash-on-cash
- 10.80%
- DSCR
- 1.48
- GRM
- 6.4
CMA / ARV
- ARV (on-the-fly)
- $172,480
- Comps found
- 1
Show comp detail 1 sale within ~0.75 mi
| Address | Dist | Beds/Ba | Sqft | Sold | Price | $/sf | Match |
|---|---|---|---|---|---|---|---|
| 32 6th St | 0.55mi | 3/2.0 (+1) | 1,137 (-8%) | 24mo | $159,500 | $140 | 37 |
Match score weights: distance 35% · size 25% · config 20% · recency 20%. Top-matched comps best support the ARV.
Projected returns pro-forma
1.44% appreciation · 3.0% rent growth · sell at horizon
- IRR
- 13.8%
- Equity multiple
- 1.72×
- Total profit
- $16,114
- Equity at exit
- $29,122
- IRR
- 16.9%
- Equity multiple
- 3.14×
- Total profit
- $47,973
- Equity at exit
- $40,170
Cash invested: $22,372 (down + closing). Projections, not guarantees.
Landlord ↔ Tenant lean methodology
- Overall (STATE)
- 62 Landlord-Friendly
- State Pennsylvania
- 62 Landlord-Friendly · EVEN
- County
- — inherits STATE
- City
- — inherits STATE
ZIP-level market 16112
- Home prices YoY
- 0.9%
- Active inventory
- 6
- Price-to-rent
- 6.4×
Monthly cashflow live
- Estimated rent
- $1,047 medium interval (Pro) →
- Mortgage (P&I)
- −$419
- Tax from tax record
- −$174 /mo · $2,087/yr
- Insurance
- −$33
- HOA
- −$0
- Vacancy / Maint / Mgmt
- −$220
- Net cashflow
- $201
Break-even live
UW: 25.0% down · 7.5% · 30yr · 1.5% tax · 5.0% vac · 8.0% maint · 8.0% mgmt
Financing live
Cash to close
- Down payment
- $19,975
- Closing costs
- $2,397
- Reserves months
- —
- Total cash needed
- —
Loan-product check · same deal, 3 products live
Conventional
25% down · 7.5% · 30yr
- Down + closing
- —
- Monthly P&I
- —
- Monthly cashflow
- —
- DSCR
- —
- Eligible?
- —
Personal DTI + credit; lowest rate.
DSCR
20% down · 8.5% · 30yr
- Down + closing
- —
- Monthly P&I
- —
- Monthly cashflow
- —
- DSCR
- —
- Eligible?
- —
No personal income docs; deal must DSCR.
Hard money
10% down · 12.0% · 12mo
- Down + closing
- —
- Monthly P&I
- —
- Monthly cashflow
- —
- DSCR
- —
- Eligible?
- —
Short-term bridge; refi at stabilization.
Listing history 19 events
-
2026-06-19days on market $79,900 Active 37 DOM
-
2026-06-18days on market $79,900 Active 36 DOM
-
2026-06-17days on market $79,900 Active 35 DOM
-
2026-06-16days on market $79,900 Active 34 DOM
-
2026-06-15days on market $79,900 Active 33 DOM
-
2026-06-14days on market $79,900 Active 31 DOM
-
2026-06-12days on market $79,900 Active 30 DOM
-
2026-06-09days on market $79,900 Active 27 DOM
-
2026-06-08days on market $79,900 Active 26 DOM
-
2026-06-07days on market $79,900 Active 25 DOM
-
2026-06-05days on market $79,900 Active 22 DOM
-
2026-06-02days on market $79,900 Active 20 DOM
-
2026-06-01days on market $79,900 Active 19 DOM
-
2026-05-31days on market $79,900 Active 18 DOM
-
2026-05-30days on market $79,900 Active 17 DOM
-
2026-05-11$79,900 Active 597-char remark
-
2020-12-03soldstatus $60,000
-
2012-07-16$64,400 188-char remark
Show marketing remark (188 chars)
Ranch Home on Beautiful 1.1478acres. New Pella Windows, New Door, New floor in the bedroom, cute kitchen with corner sink. Seller has not signed any lease or rights over to the gas company
-
2000-02-14soldstatus $55,000
ⓘ Source: listings_history table (triggers on properties + properties_extension) + one-shot
backfill from property_details.listing_events for pre-trigger history.
Tax reassessment forecast PA · Partial reset (capped growth)
- Current annual tax
- $2,087 · $174/mo
- Projected year-2 tax
- $2,087 · $174/mo
- Expected delta
- $0/yr ($0/mo · 0.0%)
ⓘ Screening estimate from a state-policy table — verify with the county assessor before closing.
Climate risk First Street
- Flood 1/10 Low FEMA zone X (unshaded) · 0% chance over 30 yrs
- Wildfire 3/10 Moderate
- Heat 3/10 Moderate 7 d/yr ≥96°F today · 17 d/yr by 30 yrs out
- Wind 1/10 Low
- Air quality 2/10 Low 1 unhealthy d/yr today · 3 by 30 yrs out
Nearby sold comps map
Loading sold comps map…
Walkable amenities ~0.75 mi
Loading nearby amenities…
Taxation est. · year 1
- Rental income
- $12,570
- − Mortgage interest
- −$4,476
- − Property taxes
- −$2,087
- − Insurance
- −$400
- − Repairs & maintenance
- −$1,006
- − Management
- −$1,006
- − Depreciation
- −$2,324
- Taxable income
- $1,273
- Est. tax owed @ 24.0%
- −$305
- After-tax cash flow
- $2,111/yr
For passive investors: Depreciation is non-cash, so a rental often shows a tax loss while cash-flowing — sheltering income. Rental losses are passive: they offset passive income freely, and up to $25,000/yr can offset ordinary (W-2) income if you actively participate and your MAGI is under $100k (phasing out to $0 by $150k); unused losses carry forward. On sale, claimed depreciation is recaptured at up to 25%, and gains may owe capital-gains tax (a 1031 exchange can defer both). Figures are a year-1 estimate at your 24.0% rate — not tax advice; consult a CPA.
Schools (NCES district)
- District
- Mohawk Area SD
- NCES district ID
- 4215540
- Math proficiency
- 41% ▼ -14.00%
- Reading proficiency
- 62% ▼ -6.00%
- Median HH income
- $49,801
- Composite
- 43.93/100
- National rank
- #2908
- State rank
- #159 of 539 in PA
Livability — Bessemer
- Score
- 71/100
- State rank
- #718
- US rank
- #7127
Category grades
Schools grade is shown separately in the Schools card above.
Census & demographics
- Census place
- Bessemer, PA
- Population (ZIP)
- 1,431
Population outlook (Lawrence County) Hauer SSP2
- Today (2025)
- 81,781 people
- By 2030
- 77,978 · -4.7%
- By 2040
- 69,522 · -15.0%
- By 2050
- 61,344 · -25.0%
- By 2075
- 45,027 · -44.9%
- By 2100
- 31,305 · -61.7%
Race, ethnicity, and origin ACS 2023
- Neighborhood character
- Predominantly White (94%)
- Race & ethnicity
- White 94% Two or more races 4%
- Common ancestry
- Romanian 5% Slovak 3% Serbian 2%
- Foreign-born
- 1% · South Korea
- Languages at home
- 97% English-only · Spanish 2% Russian/Polish/Slavic 1% Other Indo-European 1%
Political lean MEDSL · Lawrence
- 2024 margin
- Solid R (+33.8) · D 32.8% · R 66.5%
- 2008→2024 swing
- -28.7pp toward R · 2008: -5.1pp · 2024: -33.8pp
- All cycles
- 2024: R+33.8 2020: R+29.6 2016: R+28.1 2012: R+9.0 2008: R+5.1
Not yet ingested
- Civics
- —
Market trends
- HPI YoY
- ▲ 1.44%
- Current HPI
- 155.7777
- Rent YoY
- —
- Metro
- —
- State GDP YoY
- ▲ 1.68%
- F500 in state
- 34
Industry mix (Fortune 500 HQ in PA)
| Industry | F500 HQs | Revenue |
|---|---|---|
| Healthcare | 2 | $309B |
|
||
| Insurance | 2 | $27B |
|
||
| Telecommunications / Media | 1 | $124B |
|
||
| Industrial Distribution | 1 | $22B |
|
||
| Financial Services | 1 | $20B |
|
||
| Chemicals / Materials | 1 | $18B |
|
||
Price history
+45.3% since first listed4 events — show timeline
- 2026-05-11 Listed $79,900 West Penn MLS
- 2020-12-03 Sold (Public Records) $60,000 Public Records
- 2012-07-16 Listed $64,400 West Penn MLS
- 2000-02-14 Sold (Public Records) $55,000 Public Records
Property tax history
+1.5%/yrLatest (2026): $2,087 · +0.0% YoY. Source: county tax records.
Cash-flow waterfall
monthlySold comps — $/sqft
last 12 mo · ≤1 miLoading sold comps…