 🏗️ New Construction
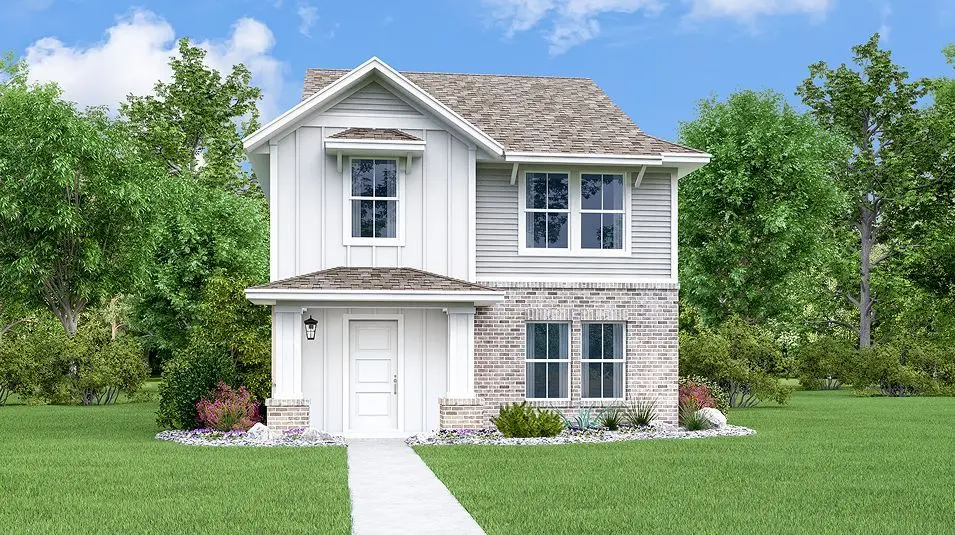
Rosedale Plan · Kyle, TX
Flood risk 1/10 · Minimal
- FEMA flood zone
- X (unshaded)
- Chance of flooding over 30 yrs
- 0.0%
- Est. flood insurance / yr
- $507 – $1,088
Fire risk 4/10 · Minor
- Est. fire insurance / yr
- $1,222 – $2,270
Heat risk 8/10 · Major
- Hot days now (above 108°F)
- 7 days/yr
- Hot days in 30 yrs
- 22 days/yr
Wind risk 8/10 · Major
- Chance of severe wind over 30 yrs
- 80.0%
Air-quality risk 2/10 · Minimal
- Unhealthy air days now
- 0 days/yr
- Unhealthy air days in 30 yrs
- 1 days/yr
Risk factors via First Street. Map © Google.
Why this score? — see what drove the F grade
The composite is a weighted blend of 9 inputs, each scored 0–100. Each bar is that input's sub-score; the figure is the points it added to the 100-point composite (weight × sub-score).
- ARV discount +7.5/15.0
- Cash flow +6.1/30.0
- Livability +3.8/5.0
- Schools +3.5/10.0
- Condition / age +2.5/5.0
- Rent growth +2.4/5.0
- 1% rule +1.4/10.0
- DSCR +0.5/10.0
- Appreciation +0.0/10.0
$284,999
🖨 Deal sheet (PDF) 📄 Offer letter ✓ Due diligence
Listing remarks MLS
The first level of this two-story residence is host to a generous open concept design, offering seamless transition between the family room, kitchen and dining area. The owner's suite is equipped with a private bathroom and walk-in closet at the back of the home. A loft providing additional shared living space can be found upstairs along with three more bedrooms.
Key facts
- Walk-in closet
- Open concept design
- Private bathroom
Tags
Neighborhood map
What this means for you Summary
Snapshot
- This is a 4-bed/2.5-bath single-family listed at $285k.
Deal economics
- At list price, monthly cash flow is $-643 ($-8k/yr) — negative.
- To cash-flow at today's rent, offer at most $255k (10.6% below list).
- To meet the 1% rule (rent ≥ 1% of price), the offer needs to be $223k (21.8% below list).
- Recommended offer: $223k (21.8% below list) — sets the bar for 1% rule.
- Cap rate 4.1% vs local median 3.3% in Kyle — meaningfully above typical; check what's discounted (condition, days-on-market, listing class) to confirm the premium yield is real.
Location & tenants
- Location reads 75/100 on livability (#138 in TX, #3,993 nationally) — a middle-class / working-renter tenant base. Strengths: housing A+, health & safety A+, employment A; Watch: amenities F, commute F.
- Hays CISD (rural): math 35% / reading 41% proficiency, ranked #390 of 826 in TX (top 47%) — families likely to look elsewhere, expect single-tenant / working-renter base with shorter leases.
- Zoned schools: Laura B Negley El (math 42% / reading 51%, grade D-, #1,080 of 4,322 statewide, top 25%, 1,007 students, 29% FRL); R C Barton Middle (math 56% / reading 52%, grade B-, #270 of 1,662 statewide, top 16%, 816 students, 33% FRL); Jack C Hays H S (math 41% / reading 47%, grade F, #697 of 1,632 statewide, top 43%, 2,062 students, 36% FRL).
- Market conditions: Rents soft (-0.3%/yr); 1820 active listings in the ZIP; 40 comparable units currently listed for rent nearby; rentals at typical pace (median 17d on market — plan ~3-4 weeks tenant-placement turnaround); solid renter incomes; 5,270 units permitted in Hays County in 2024 (1,464 in 5+ unit buildings).
Forward outlook
- Local home prices are declining (-3.0%/yr); year-one equity from $2k of loan paydown is wiped out by about $10k of value loss. Plan a longer hold.
- Hays County population projected at +93% by 2050 — long-run rental-demand tailwind backs the buy-and-hold thesis.
Negotiation context
- It's been on market 125 days — a 12% lower offer ($251k) is reasonable based on typical stale-listing flexibility.
Risks & watch-outs
- Climate carrying-cost: severe wind risk, 80% chance of damaging wind over 30y; extreme-heat days projected 7→22/yr by 2055 (HVAC capex compounding) — expect insurance premiums to compound above CPI over the hold.
Questions for the listing agent
- What do current leases actually rent for vs. the listed asking? Can we see a recent rent roll and the last 12 months of T-12 income?
- It's been on market 125 days. Have you received any prior offers? Is the seller open to a 22% concession, seller financing, or rate buy-down credit?
- Why hasn't it sold? Are there any deal-killer items the seller is aware of (foundation, flood, title, zoning, code violations)?
- Is there a deadline driving the sale (1031 exchange, divorce, estate, relocation)? That informs how much negotiation room exists.
- Schools are D-rated, which usually means shorter tenancies and higher turnover. Who's the typical renter profile here, and what's been the actual vacancy rate?
- The area grade is low — what's the realistic commute time and amenity access for the typical tenant pool here? Any planned neighborhood developments (good or bad) we should know about?
- What's the average days-on-market for RENTAL listings here right now (not sales)? A rising rental-DOM trend means longer vacancies and softer asking-rent achievability than the comps imply.
- What's the recent tenant-quality profile in this submarket — average credit score on applications, eviction rate, late-payment / NSF rate, and stable-employment percentage? A property-management company in the area should have these aggregated.
- How much new for-sale + rental construction is in the pipeline within 1–3 miles? Heavy new supply typically softens prices + rents 12–24 months out; constrained supply supports both.
Investment metrics
- 1% rule
- 0.64% ✗
- Cap rate
- 4.08%
- Cash-on-cash
- -7.92%
- DSCR
- 0.65
- GRM
- 13.0
CMA / ARV
- ARV (median comp)
- $347,738
- List price
- $284,999
- Delta
- -18.04%
- Verdict
- UNDERPRICED
- Comps
- 20 within 1.0 mi
Show comp detail 12 sales within ~0.75 mi
| Address | Dist | Beds/Ba | Sqft | Sold | Price | $/sf | Match |
|---|---|---|---|---|---|---|---|
| 405 Doherty St | 0.07mi | 4/3.0 | 1,966 (+5%) | 2mo | $349,000 | $178 | 86 |
| 2296 Herzog | 0.17mi | 3/2.5 (-1) | 1,846 (-2%) | 1mo | $275,000 | $149 | 84 |
| 1031 Powell | 0.21mi | 4/2.5 | 1,973 (+5%) | 0mo | $352,530 | $179 | 82 |
| 5152 Hellman | 0.33mi | 3/2.5 (-1) | 1,920 (+2%) | 2mo | $319,900 | $167 | 74 |
| 133 Bugbee | 0.69mi | 4/2.5 | 1,879 (0%) | 1mo | $263,999 | $140 | 67 |
| 181 Bugbee | 0.71mi | 4/2.5 | 1,879 (0%) | 1mo | $273,990 | $146 | 66 |
| 1206 Sanders | 0.27mi | 4/3.0 | 2,104 (+12%) | 1mo | $349,900 | $166 | 65 |
| 215 Bugbee | 0.73mi | 4/2.5 | 1,879 (0%) | 2mo | $273,990 | $146 | 65 |
| 3350 Everett | 0.58mi | 4/3.0 | 1,969 (+5%) | 1mo | $370,999 | $188 | 62 |
| 131 Rains | 0.56mi | 4/2.0 | 1,762 (-6%) | 2mo | $299,900 | $170 | 60 |
| 3275 Everett | 0.66mi | 4/2.0 | 1,774 (-6%) | 2mo | $343,999 | $194 | 57 |
| 3335 Everett | 0.62mi | 3/2.5 (-1) | 2,085 (+11%) | 1mo | $357,999 | $172 | 46 |
Match score weights: distance 35% · size 25% · config 20% · recency 20%. Top-matched comps best support the ARV.
Projected returns pro-forma
-3.0% appreciation · 0.0% rent growth · sell at horizon
- IRR
- -33.5%
- Equity multiple
- -0.07×
- Total profit
- $-103,773
- Equity at exit
- $51,849
- IRR
- -63.5%
- Equity multiple
- -0.73×
- Total profit
- $-168,167
- Equity at exit
- $30,066
Cash invested: $97,367 (down + closing). Projections, not guarantees.
Landlord ↔ Tenant lean methodology
- Overall (STATE)
- 87 Strongly Landlord-Friendly
- State Texas
- 87 Strongly Landlord-Friendly · R+5
- County
- — inherits STATE
- City
- — inherits STATE
ZIP-level market 78640
- Home prices YoY
- -33.8%
- Rents YoY
- -0.3%
- Active inventory
- 1820
- Price-to-rent
- 10.7×
Monthly cashflow live
- Estimated rent
- $2,229 high interval (Pro) →
- Mortgage (P&I)
- −$1,824
- Tax est. 1.5%
- −$435 /mo · $5,216/yr
- Insurance
- −$145
- HOA
- −$0
- Vacancy / Maint / Mgmt
- −$468
- Net cashflow
- $-643
Break-even live
Sensitivity live
| Price | -10% $-402 | -5% $-522 | +0% $-643 | +5% $-763 | +10% $-883 |
|---|---|---|---|---|---|
| Rent | -10% $-819 | -5% $-731 | +0% $-643 | +5% $-555 | +10% $-467 |
| Rate | -1.0pp $-467 | -0.5pp $-554 | base $-643 | +0.5pp $-733 | +1.0pp $-824 |
UW: 25.0% down · 7.5% · 30yr · 1.5% tax · 5.0% vac · 8.0% maint · 8.0% mgmt
Financing live
Cash to close
- Down payment
- $86,935
- Closing costs
- $10,432
- Reserves months
- —
- Total cash needed
- —
Loan-product check · same deal, 3 products live
Conventional
25% down · 7.5% · 30yr
- Down + closing
- —
- Monthly P&I
- —
- Monthly cashflow
- —
- DSCR
- —
- Eligible?
- —
Personal DTI + credit; lowest rate.
DSCR
20% down · 8.5% · 30yr
- Down + closing
- —
- Monthly P&I
- —
- Monthly cashflow
- —
- DSCR
- —
- Eligible?
- —
No personal income docs; deal must DSCR.
Hard money
10% down · 12.0% · 12mo
- Down + closing
- —
- Monthly P&I
- —
- Monthly cashflow
- —
- DSCR
- —
- Eligible?
- —
Short-term bridge; refi at stabilization.
Rent comps 40 comps
| Address | Beds | Baths | Sqft | Rent | $/sqft | DOM | Units | Dist |
|---|---|---|---|---|---|---|---|---|
| 541 Barcelona Kyle, TX | 3.0 | 2.0 | 1274 | $1,950 | $1.53 | 6d | 1 | 0.10mi |
| 321 Barcelona Kyle, TX | 3.0 | 2.0 | 1276 | $2,600 | $2.04 | 19d | 1 | 0.13mi |
| 201 Edwin Kyle, TX | 3.0 | 2.0 | 1333 | $1,950 | $1.46 | 18d | 1 | 0.15mi |
| 250 Barcelona Kyle, TX | 3.0 | 2.0 | 1278 | $1,899 | $1.49 | 14d | 1 | 0.17mi |
| 889 Powell St Kyle, TX | 4.0 | 2.5 | 1882 | $2,249 | $1.20 | 4d | 1 | 0.18mi |
| 889 Powell St Kyle, TX | 4.0 | 2.5 | 1882 | $2,249 | $1.20 | 0d | 1 | 0.18mi |
| 905 Powell St Kyle, TX | 4.0 | 2.5 | 1879 | $2,300 | $1.22 | 19d | 1 | 0.18mi |
| 220 Barcelona Kyle, TX | 4.0 | 2.0 | 1774 | $2,200 | $1.24 | 5d | 1 | 0.19mi |
| 252 Patagonia Kyle, TX | 3.0 | 2.5 | 1434 | $2,000 | $1.39 | 6d | 1 | 0.22mi |
| 139 Madrid Kyle, TX | 3.0 | 2.0 | 1914 | $2,350 | $1.23 | 6d | 1 | 0.23mi |
| 510 Kohlers Xing Kyle, TX | 1.0–3.0 | 1.0–2.0 | 977 | $1,731 | $1.77 | 45d | 1 | 0.24mi |
| 167 Rioja Unit (Main House) Kyle, TX | 3.0 | 2.5 | 1569 | $1,900 | $1.21 | 6d | 1 | 0.26mi |
| 167 Rioja Kyle, TX | 3.0 | 3.0 | 1569 | $2,300 | $1.47 | 45d | 1 | 0.26mi |
| 500 Jack Ryan Kyle, TX | 4.0 | 2.0 | 1622 | $2,200 | $1.36 | 19d | 1 | 0.30mi |
| 5208 Hellman Kyle, TX | 4.0 | 3.5 | 2275 | $2,245 | $0.99 | 16d | 1 | 0.33mi |
| 216 Jeffers Kyle, TX | 3.0 | 2.0 | 1622 | $2,095 | $1.29 | 25d | 1 | 0.42mi |
| 3875 Burnham Kyle, TX | 1.0–3.0 | 1.0–2.0 | 956 | $2,793 | $2.92 | 0d | 42 | 0.45mi |
| 373 Jeffers Kyle, TX | 4.0 | 2.0 | 2035 | $2,190 | $1.08 | 45d | 1 | 0.49mi |
| 238 Dreyer Kyle, TX | 4.0 | 2.5 | 2500 | $2,200 | $0.88 | 45d | 1 | 0.52mi |
| 3305 Everett Kyle, TX | 4.0 | 3.0 | 1913 | $2,399 | $1.25 | 45d | 1 | 0.62mi |
| 397 Keefer Kyle, TX | 3.0 | 2.0 | 1450 | $1,850 | $1.28 | 3d | 1 | 0.67mi |
| 4624 Cromwell Dr Kyle, TX | 2.0–3.0 | 2.0 | 1172 | $1,790 | $1.53 | 4d | 8 | 0.72mi |
| 309 Juniper Dr Mountain City, TX | 4.0 | 2.0 | 2199 | $2,799 | $1.27 | 19d | 1 | 0.74mi |
| 1454 Marley Kyle, TX | 4.0 | 3.0 | 1969 | $2,249 | $1.14 | 14d | 1 | 0.74mi |
| 115 Parsons Kyle, TX | 4.0 | 3.0 | 1969 | $2,249 | $1.14 | 12d | 1 | 0.78mi |
| 1405 Marley Kyle, TX | 4.0 | 2.0 | 1774 | $2,349 | $1.32 | 0d | 1 | 0.79mi |
| 1200 Kohlers Xing Kyle, TX | 4.0 | 3.0 | 1921 | $2,349 | $1.22 | 25d | 1 | 0.81mi |
| 101 Ina Ct Kyle, TX | 3.0 | 2.0 | 1642 | $1,680 | $1.02 | 25d | 1 | 0.81mi |
| 190 Tofalla Kyle, TX | 4.0 | 2.0 | 1774 | $2,200 | $1.24 | 25d | 1 | 0.83mi |
| 135 Michaelis Unit B Kyle, TX | 3.0 | 2.5 | 1552 | $1,600 | $1.03 | 45d | 1 | 1.07mi |
| 191 Cleveland Kyle, TX | 3.0 | 2.5 | 1671 | $1,975 | $1.18 | 14d | 1 | 1.07mi |
| 401 Witte Kyle, TX | 4.0 | 2.0 | 2298 | $2,800 | $1.22 | 0d | 1 | 1.09mi |
| 437 Sampson Kyle, TX | 3.0 | 2.0 | 1379 | $1,965 | $1.42 | 3d | 1 | 1.18mi |
| 4937 Hartson Kyle, TX | 3.0 | 2.0 | 1360 | $1,950 | $1.43 | 45d | 1 | 1.19mi |
| 4977 Hartson Kyle, TX | 4.0 | 2.0 | 1640 | $2,250 | $1.37 | 19d | 1 | 1.22mi |
| 411 Wetzel Kyle, TX | 4.0 | 2.5 | 2400 | $2,350 | $0.98 | 45d | 1 | 1.23mi |
| 140 Schmidt Kyle, TX | 4.0 | 2.5 | 1521 | $1,900 | $1.25 | 0d | 1 | 1.26mi |
| 196 Spangle Way Kyle, TX | 3.0 | 3.0 | 1834 | $2,100 | $1.15 | 45d | 1 | 1.31mi |
| 5157 Hartson Kyle, TX | 4.0 | 2.5 | 1938 | $2,100 | $1.08 | 0d | 1 | 1.32mi |
| 544 Hogan Kyle, TX | 3.0 | 2.5 | 2183 | $1,950 | $0.89 | 16d | 1 | 1.33mi |
Listing history 17 events
-
2026-06-21days on market $284,999 Active 125 DOM
-
2026-06-18days on market $284,999 Active 122 DOM
-
2026-06-17days on market $284,999 Active 121 DOM
-
2026-06-16days on market $284,999 Active 120 DOM
-
2026-06-15days on market $284,999 Active 119 DOM
-
2026-06-13days on market $284,999 Active 117 DOM
-
2026-06-09days on market $284,999 Active 113 DOM
-
2026-06-08days on market $284,999 Active 112 DOM
-
2026-06-07days on market $284,999 Active 111 DOM
-
2026-06-05days on market $284,999 Active 108 DOM
-
2026-06-03days on market $284,999 Active 107 DOM
-
2026-06-02days on market $284,999 Active 106 DOM
-
2026-06-01days on market $284,999 Active 105 DOM
-
2026-05-31days on market $284,999 Active 104 DOM
-
2026-05-09price $284,999 365-char remark
Show marketing remark (365 chars)
The first level of this two-story residence is host to a generous open concept design, offering seamless transition between the family room, kitchen and dining area. The owner's suite is equipped with a private bathroom and walk-in closet at the back of the home. A loft providing additional shared living space can be found upstairs along with three more bedrooms.
-
2026-03-31price $285,999 365-char remark
Show marketing remark (365 chars)
The first level of this two-story residence is host to a generous open concept design, offering seamless transition between the family room, kitchen and dining area. The owner's suite is equipped with a private bathroom and walk-in closet at the back of the home. A loft providing additional shared living space can be found upstairs along with three more bedrooms.
-
2026-02-16$285,990 Active 365-char remark
Show marketing remark (365 chars)
The first level of this two-story residence is host to a generous open concept design, offering seamless transition between the family room, kitchen and dining area. The owner's suite is equipped with a private bathroom and walk-in closet at the back of the home. A loft providing additional shared living space can be found upstairs along with three more bedrooms.
ⓘ Source: listings_history table (triggers on properties + properties_extension) + one-shot
backfill from property_details.listing_events for pre-trigger history.
Climate risk First Street
- Flood 1/10 Low FEMA zone X (unshaded) · 0% chance over 30 yrs
- Wildfire 4/10 Moderate
- Heat 8/10 Severe 7 d/yr ≥108°F today · 22 d/yr by 30 yrs out
- Wind 8/10 Severe 80% chance of damaging wind over 30 yrs
- Air quality 2/10 Low 0 unhealthy d/yr today · 1 by 30 yrs out
Nearby sold comps map
Loading sold comps map…
Walkable amenities ~0.75 mi
Loading nearby amenities…
Taxation est. · year 1
- Rental income
- $26,742
- − Mortgage interest
- −$19,479
- − Property taxes
- −$5,216
- − Insurance
- −$1,739
- − Repairs & maintenance
- −$2,139
- − Management
- −$2,139
- − Depreciation
- −$10,116
- Taxable loss
- −$14,086
- Est. tax savings @ 24.0%
- +$3,381
- After-tax cash flow
- $-4,331/yr
For passive investors: Depreciation is non-cash, so a rental often shows a tax loss while cash-flowing — sheltering income. Rental losses are passive: they offset passive income freely, and up to $25,000/yr can offset ordinary (W-2) income if you actively participate and your MAGI is under $100k (phasing out to $0 by $150k); unused losses carry forward. On sale, claimed depreciation is recaptured at up to 25%, and gains may owe capital-gains tax (a 1031 exchange can defer both). Figures are a year-1 estimate at your 24.0% rate — not tax advice; consult a CPA.
Schools (NCES district)
- District
- Hays CISD
- NCES district ID
- 4800010
- Math proficiency
- 35% ▼ -15.00%
- Reading proficiency
- 41% ▼ -5.00%
- Median HH income
- $70,570
- Composite
- 34.78/100
- National rank
- #5118
- State rank
- #390 of 826 in TX
Livability — Kyle
- Score
- 75/100
- State rank
- #138
- US rank
- #3993
Category grades
Schools grade is shown separately in the Schools card above.
Census & demographics
- Census place
- Kyle, TX
- County
- Hays County · 280,138 people
- Metro
- Austin-Round Rock-Georgetown, TX
- Population (ZIP)
- 77,531
- Household income
- $90,075
- Rent vs Own
- Severe rent burden
- 2552.0
Population outlook (Hays County) Hauer SSP2
- Today (2025)
- 286,948 people
- By 2030
- 336,923 · +17.4%
- By 2040
- 441,894 · +54.0%
- By 2050
- 553,462 · +92.9%
- By 2075
- 838,261 · +192.1%
- By 2100
- 1,063,658 · +270.7%
Race, ethnicity, and origin ACS 2023
- Neighborhood character
- Diverse neighborhood (Simpson 0.56)
- Race & ethnicity
- Hispanic / Latino 55% White 36% Two or more races 29% Black 5% Native American 1%
- Hispanic origin (detail)
- Mexican 47% Puerto Rican 1%
- Common ancestry
- Italian 2% Slovak 2% Lithuanian 1%
- Foreign-born
- 13% · Canada
- Languages at home
- 63% English-only · Spanish 35%
Political lean MEDSL · Hays
- 2024 margin
- Lean D (+5.7) · D 52.1% · R 46.5% · Other 1.4%
- 2008→2024 swing
- +7.7pp toward D · 2008: -2.0pp · 2024: 5.7pp
- All cycles
- 2024: D+5.7 2020: D+10.8 2016: R+0.9 2012: R+10.4 2008: R+2.0
Not yet ingested
- Civics
- —
Market trends
- HPI YoY
- ▼ -92.64%
- Current HPI
- 181.7969
- Rent YoY
- ▼ -0.34%
- Metro
- Austin-Round Rock-Georgetown, TX
- State GDP YoY
- ▲ 3.95%
- F500 in state
- 110
Industry mix (Fortune 500 HQ in TX)
| Industry | F500 HQs | Revenue |
|---|---|---|
| Energy | 16 | $1,198B |
|
||
| Technology | 5 | $198B |
|
||
| Engineering / Construction | 4 | $72B |
|
||
| Energy Services | 3 | $60B |
|
||
| Utilities | 3 | $41B |
|
||
| Healthcare | 2 | $330B |
|
||
Price history
-0.3% since first listed3 events — show timeline
- 2026-05-09 Price Changed $284,999 Zillow
- 2026-03-31 Price Changed $285,999 Zillow
- 2026-02-16 Listed $285,990 Zillow
Cash-flow waterfall
monthlySold comps — $/sqft
last 12 mo · ≤1 miLoading sold comps…