1199 Minnesota Ave · Columbus, OH
Flood risk 1/10 · Minimal
- FEMA flood zone
- X (unshaded)
- Chance of flooding over 30 yrs
- 0.0%
- Est. flood insurance / yr
- $473 – $860
Fire risk 1/10 · Minimal
- Est. fire insurance / yr
- $713 – $1,323
Heat risk 3/10 · Minor
- Hot days now (above 100°F)
- 7 days/yr
- Hot days in 30 yrs
- 18 days/yr
Wind risk 2/10 · Minimal
- Chance of severe wind over 30 yrs
- 1.0%
Air-quality risk 3/10 · Minor
- Unhealthy air days now
- 2 days/yr
- Unhealthy air days in 30 yrs
- 4 days/yr
Risk factors via First Street. Map © Google.
Why this score? — see what drove the B grade
The composite is a weighted blend of 9 inputs, each scored 0–100. Each bar is that input's sub-score; the figure is the points it added to the 100-point composite (weight × sub-score).
- Cash flow +26.5/30.0
- ARV discount +15.0/15.0
- DSCR +9.1/10.0
- 1% rule +8.1/10.0
- Livability +4.0/5.0
- Rent growth +3.4/5.0
- Condition / age +2.5/5.0
- Schools +1.7/10.0
- Appreciation +0.0/10.0
$79,000
🖨 Deal sheet (PDF) 📄 Offer letter ✓ Due diligence
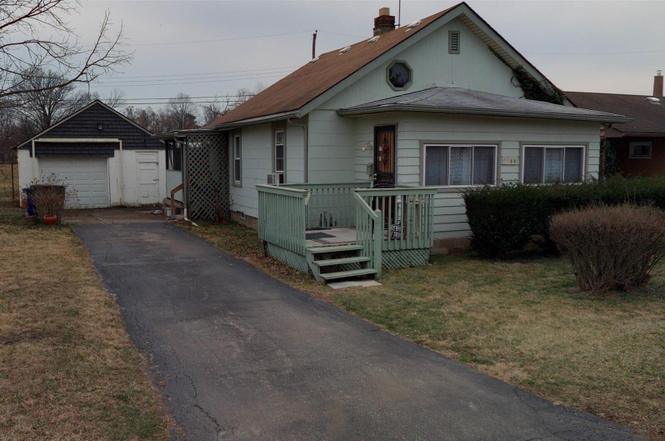
Listing remarks
Investor special and total rehab opportunity! This fully gutted property is ready for a complete renovation—ideal for an investor, contractor, or buyer looking to create instant equity. The home offers a solid footprint, enclosed front porch, and detached garage, providing a strong foundation to redesign the interior to modern standards. Taken down to the studs, the property allows full customization of layout, finishes, and systems. Well suited for a starter home renovation or income-producing rental once completed. Bring your contractor and your vision—this property is ready for transformation. Sold AS-IS. Seller to make no repairs.
Key facts
- Full customization
- Solid footprint
- Enclosed front porch
Tags
Neighborhood map
What this means for you Summary
Snapshot
- This is a 2-bed/1.0-bath single-family listed at $79k.
Deal economics
- At list price, monthly cash flow is $210 ($3k/yr) — positive.
- The deal already cash-flows at list — no discount required.
- Meets the 1% rule at list price ($1k rent vs $79k).
- Cap rate 9.5% vs local median 3.8% in Columbus — top-decile yield for the area; either an underpriced asset or a hidden risk that comps aren't pricing in. Stress-test before assuming the spread holds.
Location & tenants
- Location reads 81/100 on livability (#97 in OH, #1,491 nationally) — a professional / high-income tenant draw. Strengths: commute A+, cost of living A+, housing A+; Watch: employment C-, crime F.
- Columbus City School District (urban): math 15% / reading 26% proficiency, ranked #626 of 656 in OH (top 95%) — low school quality limits family demand, transient renter base, plan for 1-2y turnover; 72% free/reduced lunch — lower-income household profile, screen leases tightly.
- Zoned schools: Indianola Informal K-8 School (math 43% / reading 58%, grade D+, #896 of 1,584 statewide, top 57%, 684 students, 0% FRL); Arts Impact Middle School (Aims) (math 17% / reading 25%, grade F, #608 of 654 statewide, top 93%, 532 students, 0% FRL); Linden-Mckinley Stem Academy (math 4% / reading 13%, grade F, #756 of 781 statewide, top 97%, 776 students, 0% FRL) — zoned schools average 0% FRL vs 72% district-wide (72 pts lower); this property's tenant base skews higher-income than the district average.
- Market conditions: Rents rising (+3.4%/yr); 166 active listings in the ZIP; 31 comparable units currently listed for rent nearby; rentals at typical pace (median 25d on market — plan ~3-4 weeks tenant-placement turnaround); 42% of comp listings sitting > 30 days — soft ceiling on asking rent; lower-income renter base — watch delinquency; 8,139 units permitted in Franklin County in 2024 (5,940 in 5+ unit buildings).
Forward outlook
- Local home prices are declining (-3.0%/yr); year-one equity from $546 of loan paydown is wiped out by about $2k of value loss. Plan a longer hold.
- Franklin County population projected at +34% by 2050 — long-run rental-demand tailwind backs the buy-and-hold thesis.
- At projected returns (-3.0% appreciation + 3.4% rent growth), your $22k cash investment doubles in ~10 years — after that, you're playing with house money.
Negotiation context
- Only 4 days on market — expect competitive offers; lowballing is unlikely to land.
Risks & watch-outs
- Watch-outs: built in 1925 — expect roof / HVAC / electrical / plumbing capex.
Questions for the listing agent
- Built in 1925 — when were the roof, HVAC, electrical panel, plumbing, and water heater last replaced?
- Is there a deadline driving the sale (1031 exchange, divorce, estate, relocation)? That informs how much negotiation room exists.
- Crime grade is F in this area — have there been break-ins, vandalism, or insurance claims at this property in the last 3 years? What carrier currently insures it and at what premium?
- What's the average days-on-market for RENTAL listings here right now (not sales)? A rising rental-DOM trend means longer vacancies and softer asking-rent achievability than the comps imply.
- What's the recent tenant-quality profile in this submarket — average credit score on applications, eviction rate, late-payment / NSF rate, and stable-employment percentage? A property-management company in the area should have these aggregated.
- How much new for-sale + rental construction is in the pipeline within 1–3 miles? Heavy new supply typically softens prices + rents 12–24 months out; constrained supply supports both.
Investment metrics
- 1% rule
- 1.31% ✓
- Cap rate
- 9.48%
- Cash-on-cash
- 11.37%
- DSCR
- 1.51
- GRM
- 6.3
CMA / ARV
- ARV (on-the-fly)
- $130,863
- Comps found
- 12
Show comp detail 12 sales within ~0.75 mi
| Address | Dist | Beds/Ba | Sqft | Sold | Price | $/sf | Match |
|---|---|---|---|---|---|---|---|
| 2874 Grasmere Ave | 0.32mi | 2/1.0 | 732 (+1%) | 2mo | $90,000 | $123 | 81 |
| 2776 Howey Rd | 0.27mi | 2/1.0 | 777 (+8%) | 3mo | $139,900 | $180 | 72 |
| 2285 Atwood Ter | 0.69mi | 2/1.0 | 720 (-0%) | 1mo | $136,140 | $189 | 66 |
| 792 Melrose Ave | 0.73mi | 2/1.0 | 720 (-0%) | 2mo | $175,000 | $243 | 63 |
| 2752 Azelda St | 0.42mi | 2/1.0 | 792 (+10%) | 1mo | $150,000 | $189 | 63 |
| 1398 Manchester Ave | 0.31mi | 2/1.0 | 820 (+13%) | 0mo | $255,000 | $311 | 63 |
| 2214 Grasmere Ave | 0.71mi | 2/1.0 | 720 (-0%) | 4mo | $130,000 | $181 | 63 |
| 2311 Mcguffey Rd | 0.53mi | 2/1.0 | 672 (-7%) | 3mo | $75,000 | $112 | 61 |
| 2593 Osceola Ave | 0.60mi | 2/1.0 | 672 (-7%) | 3mo | $155,000 | $231 | 58 |
| 2352 Hiawatha Park Dr | 0.64mi | 2/1.0 | 672 (-7%) | 2mo | $98,500 | $147 | 57 |
| 2495 Pontiac St | 0.60mi | 2/1.0 | 672 (-7%) | 4mo | $105,000 | $156 | 57 |
| 2906 Howey Rd | 0.39mi | 3/1.0 (+1) | 816 (+13%) | 4mo | $132,000 | $162 | 52 |
Match score weights: distance 35% · size 25% · config 20% · recency 20%. Top-matched comps best support the ARV.
Projected returns pro-forma
-3.0% appreciation · 3.41% rent growth · sell at horizon
- IRR
- 1.2%
- Equity multiple
- 1.05×
- Total profit
- $1,029
- Equity at exit
- $11,779
- IRR
- 11.3%
- Equity multiple
- 1.91×
- Total profit
- $20,085
- Equity at exit
- $6,830
Cash invested: $22,120 (down + closing). Projections, not guarantees.
Landlord ↔ Tenant lean methodology
- Overall (STATE)
- 73 Landlord-Friendly
- State Ohio
- 73 Landlord-Friendly · R+6
- County
- — inherits STATE
- City
- — inherits STATE
ZIP-level market 43211
- Home prices YoY
- -27.3%
- Rents YoY
- 3.4%
- Active inventory
- 166
- Price-to-rent
- 6.3×
Monthly cashflow live
- Estimated rent
- $1,039 high interval (Pro) →
- Mortgage (P&I)
- −$414
- Tax from tax record
- −$164 /mo · $1,966/yr
- Insurance
- −$33
- HOA
- −$0
- Vacancy / Maint / Mgmt
- −$218
- Net cashflow
- $210
Break-even live
Sensitivity live
| Price | -10% $254 | -5% $232 | +0% $210 | +5% $187 | +10% $165 |
|---|---|---|---|---|---|
| Rent | -10% $127 | -5% $168 | +0% $210 | +5% $251 | +10% $292 |
| Rate | -1.0pp $249 | -0.5pp $230 | base $210 | +0.5pp $189 | +1.0pp $168 |
UW: 25.0% down · 7.5% · 30yr · 1.5% tax · 5.0% vac · 8.0% maint · 8.0% mgmt
Financing live
Cash to close
- Down payment
- $19,750
- Closing costs
- $2,370
- Reserves months
- —
- Total cash needed
- —
Loan-product check · same deal, 3 products live
Conventional
25% down · 7.5% · 30yr
- Down + closing
- —
- Monthly P&I
- —
- Monthly cashflow
- —
- DSCR
- —
- Eligible?
- —
Personal DTI + credit; lowest rate.
DSCR
20% down · 8.5% · 30yr
- Down + closing
- —
- Monthly P&I
- —
- Monthly cashflow
- —
- DSCR
- —
- Eligible?
- —
No personal income docs; deal must DSCR.
Hard money
10% down · 12.0% · 12mo
- Down + closing
- —
- Monthly P&I
- —
- Monthly cashflow
- —
- DSCR
- —
- Eligible?
- —
Short-term bridge; refi at stabilization.
Rent comps 31 comps
| Address | Beds | Baths | Sqft | Rent | $/sqft | DOM | Units | Dist |
|---|---|---|---|---|---|---|---|---|
| 1046-1048 Republic Ave Columbus, OH | 1.0 | 1.0 | 672 | $875 | $1.30 | 5d | 1 | 0.32mi |
| 1555 Myrtle Ave Columbus, OH | 1.0 | 1.0 | 455 | $600 | $1.32 | 17d | 1 | 0.57mi |
| 2383 Hiawatha Park Dr Unit 2383 Columbus, OH | 1.0 | 1.0 | 600 | $1,100 | $1.83 | 45d | 1 | 0.62mi |
| 870 Melrose Ave Columbus, OH | 2.0 | 1.0 | 732 | $1,345 | $1.84 | 9d | 1 | 0.64mi |
| 2206 McGuffey Rd Columbus, OH | 1.0 | 1.0 | 576 | $770 | $1.34 | 9d | 1 | 0.66mi |
| 2217 Grasmere Ave Columbus, OH | 2.0 | 1.5 | 720 | $1,650 | $2.29 | 16d | 1 | 0.71mi |
| 2505-2507 Cleveland Ave Unit F Columbus, OH | 1.0 | 1.0 | 700 | $1,100 | $1.57 | 45d | 1 | 0.73mi |
| 2236 Atwood Ter Columbus, OH | 2.0 | 1.0 | 720 | $900 | $1.25 | 9d | 1 | 0.74mi |
| 2530 Beulah Rd Columbus, OH | 2.0 | 1.0 | 720 | $1,345 | $1.87 | 16d | 1 | 0.83mi |
| 2888 Cleveland Ave Unit D Columbus, OH | 1.0 | 1.0 | 680 | $825 | $1.21 | 45d | 1 | 0.90mi |
| 2888 Cleveland Ave Unit F Columbus, OH | 1.0 | 1.0 | 680 | $825 | $1.21 | 12d | 1 | 0.90mi |
| 940 E North Broadway St Columbus, OH | 1.0 | 1.0 | 650 | $795 | $1.22 | 45d | 1 | 0.93mi |
| 1572 E Maynard Ave Unit 1580 Columbus, OH | 1.0 | 1.0 | 441 | $950 | $2.15 | 25d | 1 | 0.96mi |
| 1911 Denune Ave Columbus, OH | 2.0 | 1.0 | 645 | $925 | $1.43 | 45d | 1 | 1.00mi |
| 1911 Denune Ave Columbus, OH | 2.0 | 1.0 | 645 | $795 | $1.23 | 3d | 1 | 1.00mi |
| 1205 E 23rd Ave Columbus, OH | 2.0 | 1.0 | 688 | $1,050 | $1.53 | 9d | 1 | 1.00mi |
| 1500 E 25th Ave Columbus, OH | 2.0 | 1.0 | 720 | $850 | $1.18 | 45d | 1 | 1.04mi |
| 1500 E 25th Ave Unit 2 Columbus, OH | 2.0 | 1.0 | 720 | $850 | $1.18 | 25d | 1 | 1.04mi |
| 1171 E 22nd Ave Unit 1171 Columbus, OH | 2.0 | 1.0 | 750 | $1,100 | $1.47 | 19d | 1 | 1.06mi |
| 2846 Joyce Ave Apt C Columbus, OH | 2.0 | 1.0 | 645 | $815 | $1.26 | 25d | 1 | 1.13mi |
| 2317 Parkwood Ave Columbus, OH | 2.0 | 1.0 | 672 | $995 | $1.48 | 9d | 1 | 1.23mi |
| 1870 Dunbar Dr Apt B4 Columbus, OH | 1.0 | 1.0 | 700 | $850 | $1.21 | 25d | 1 | 1.23mi |
| 358 E Duncan St Columbus, OH | 1.0 | 1.0 | 550 | $875 | $1.59 | 45d | 1 | 1.27mi |
| 356 E Duncan St Columbus, OH | 1.0 | 1.0 | 550 | $900 | $1.64 | 12d | 1 | 1.28mi |
| 464 E Norwich Ave Unit 474 A Columbus, OH | 1.0 | 1.0 | 750 | $850 | $1.13 | 45d | 1 | 1.33mi |
| 460 E Norwich Ave Unit 460-C Columbus, OH | 2.0 | 1.0 | 650 | $1,025 | $1.58 | 45d | 1 | 1.33mi |
| 450 E Norwich Ave Unit 450-C Columbus, OH | 2.0 | 1.0 | 650 | $995 | $1.53 | 45d | 1 | 1.34mi |
| 2485 Deming Ave Unit 6 Columbus, OH | 1.0 | 1.0 | 497 | $900 | $1.81 | 25d | 1 | 1.38mi |
| 2233 Summit St Unit C Columbus, OH | 1.0 | 1.0 | 402 | $1,225 | $3.05 | 45d | 1 | 1.38mi |
| 2688 Hibbert Ave Columbus, OH | 2.0 | 1.0 | 748 | $1,195 | $1.60 | 45d | 1 | 1.39mi |
| 184 E Duncan St Unit 184 Duncan-17 Columbus, OH | 2.0 | 1.0 | 700 | $1,025 | $1.46 | 45d | 1 | 1.49mi |
Listing history 2 events
-
2026-01-29status Pending
-
2026-01-24$79,000 Active
ⓘ Source: listings_history table (triggers on properties + properties_extension) + one-shot
backfill from property_details.listing_events for pre-trigger history.
Tax reassessment forecast OH · Partial reset (capped growth)
- Current annual tax
- $1,966 · $164/mo
- Projected year-2 tax
- $1,966 · $164/mo
- Expected delta
- $0/yr ($0/mo · 0.0%)
ⓘ Screening estimate from a state-policy table — verify with the county assessor before closing.
Climate risk First Street
- Flood 1/10 Low FEMA zone X (unshaded) · 0% chance over 30 yrs
- Wildfire 1/10 Low
- Heat 3/10 Moderate 7 d/yr ≥100°F today · 18 d/yr by 30 yrs out
- Wind 2/10 Low 100% chance of damaging wind over 30 yrs
- Air quality 3/10 Moderate 2 unhealthy d/yr today · 4 by 30 yrs out
Nearby sold comps map
Loading sold comps map…
Walkable amenities ~0.75 mi
Loading nearby amenities…
Taxation est. · year 1
- Rental income
- $12,464
- − Mortgage interest
- −$4,425
- − Property taxes
- −$1,966
- − Insurance
- −$395
- − Repairs & maintenance
- −$997
- − Management
- −$997
- − Depreciation
- −$2,298
- Taxable income
- $1,385
- Est. tax owed @ 24.0%
- −$333
- After-tax cash flow
- $2,182/yr
For passive investors: Depreciation is non-cash, so a rental often shows a tax loss while cash-flowing — sheltering income. Rental losses are passive: they offset passive income freely, and up to $25,000/yr can offset ordinary (W-2) income if you actively participate and your MAGI is under $100k (phasing out to $0 by $150k); unused losses carry forward. On sale, claimed depreciation is recaptured at up to 25%, and gains may owe capital-gains tax (a 1031 exchange can defer both). Figures are a year-1 estimate at your 24.0% rate — not tax advice; consult a CPA.
Schools (NCES district)
- District
- Columbus City School District
- NCES district ID
- 3904380
- Math proficiency
- 15% ▼ -17.00%
- Reading proficiency
- 26% ▼ -12.00%
- Median HH income
- $38,483
- Composite
- 17.19/100
- National rank
- #9105
- State rank
- #626 of 656 in OH
Livability — Columbus
- Score
- 81/100
- State rank
- #97
- US rank
- #1491
Category grades
Schools grade is shown separately in the Schools card above.
Census & demographics
- Census place
- Columbus, OH
- County
- Franklin County · 1,351,780 people
- City population
- 612,189
- Metro
- Columbus, OH
- Population (ZIP)
- 22,313
- Household income
- $42,579
- Rent vs Own
- Severe rent burden
- 1282.0
Population outlook (Franklin County) Hauer SSP2
- Today (2025)
- 1,456,139 people
- By 2030
- 1,556,890 · +6.9%
- By 2040
- 1,757,349 · +20.7%
- By 2050
- 1,950,539 · +34.0%
- By 2075
- 2,376,171 · +63.2%
- By 2100
- 2,636,796 · +81.1%
Race, ethnicity, and origin ACS 2023
- Neighborhood character
- Diverse neighborhood (Simpson 0.60)
- Race & ethnicity
- Black 58% White 21% Hispanic / Latino 13% Two or more races 12% Asian 2%
- Hispanic origin (detail)
- Mexican 8% Dominican 1%
- Common ancestry
- Italian 1%
- Foreign-born
- 10% · Canada, India
- Languages at home
- 84% English-only · Spanish 11% Other Indo-European 2% Arabic 1%
Political lean MEDSL · Franklin
- 2024 margin
- Strong D (+28.4) · D 63.7% · R 35.3% · Other 1.0%
- 2008→2024 swing
- +7.7pp toward D · 2008: 20.7pp · 2024: 28.4pp
- All cycles
- 2024: D+28.4 2020: D+31.4 2016: D+25.9 2012: D+21.7 2008: D+20.7
Not yet ingested
- Civics
- —
Market trends
- HPI YoY
- ▼ -94.10%
- Current HPI
- 250.3885
- Rent YoY
- ▲ 3.41%
- Metro
- Columbus, OH
- State GDP YoY
- ▲ 1.98%
- F500 in state
- 48
Industry mix (Fortune 500 HQ in OH)
| Industry | F500 HQs | Revenue |
|---|---|---|
| Insurance | 3 | $145B |
|
||
| Industrial Machinery | 3 | $49B |
|
||
| Financial Services | 3 | $24B |
|
||
| Consumer Goods | 2 | $93B |
|
||
| Aerospace / Defense | 2 | $47B |
|
||
| Utilities | 2 | $33B |
|
||
Price history
2 events — show timeline
- 2026-01-29 Pending — CBRMLS
- 2026-01-24 Listed $79,000 CBRMLS
Property tax history
+22.1%/yrLatest (2024): $1,966 · +17.6% YoY. Source: county tax records.
Cash-flow waterfall
monthlySold comps — $/sqft
last 12 mo · ≤1 miLoading sold comps…