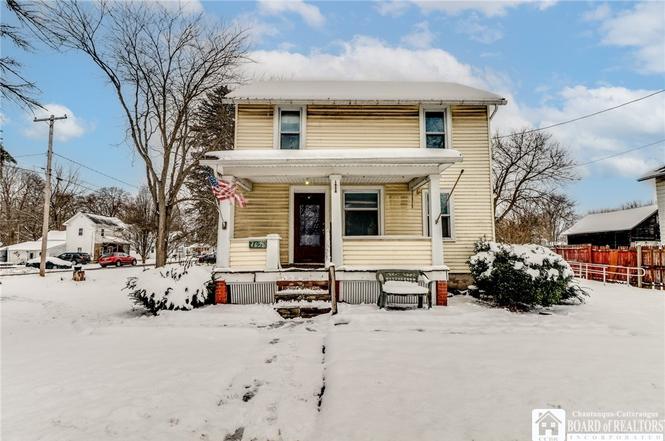
4626 S Gravel Rd · Medina, NY
Flood risk 1/10 · Minimal
- FEMA flood zone
- X
- Chance of flooding over 30 yrs
- 0.0%
- Est. flood insurance / yr
- $473 – $860
Fire risk 1/10 · Minimal
- Est. fire insurance / yr
- $691 – $1,283
Heat risk 2/10 · Minimal
- Hot days now (above 94°F)
- 7 days/yr
- Hot days in 30 yrs
- 16 days/yr
Wind risk 1/10 · Minimal
- Chance of severe wind over 30 yrs
- —
Air-quality risk 2/10 · Minimal
- Unhealthy air days now
- 1 days/yr
- Unhealthy air days in 30 yrs
- 2 days/yr
Risk factors via First Street. Map © Google.
Why this score? — see what drove the B grade
The composite is a weighted blend of 9 inputs, each scored 0–100. Each bar is that input's sub-score; the figure is the points it added to the 100-point composite (weight × sub-score).
- Cash flow +30.0/30.0
- 1% rule +10.0/10.0
- DSCR +10.0/10.0
- ARV discount +7.5/15.0
- Appreciation +4.9/10.0
- Livability +3.6/5.0
- Schools +3.2/10.0
- Rent growth +2.5/5.0
- Condition / age +2.5/5.0
$85,000
🖨 Deal sheet (PDF) 📄 Offer letter ✓ Due diligence
Listing remarks
Opportunity is knocking! This 4 bedroom, 1 bath home is ready for you to make it yours! First floor bedroom, first floor full bath, formal dining room with wood stove, rear mudroom, natural woodwork, hardwood floors, circuit breakers, sump pump, vinyl siding, covered front porch, rear deck, handicap ramp and large shed all on an oversized corner lot! The furnace is only 2 years old! Conveniently located between Niagara Falls, Buffalo and Rochester. Just a short drive to the beaches along Lake Ontario. Don't miss your chance at this gem!
Key facts
- Natural woodwork
- Rear mudroom
- Formal dining room
Tags
Property features AI
Exterior
- Parking: No garage
- Utilities: Public water connected; Septic tank; Circuit breaker electrical
- Home design: Two-story single-family residence; Resale property; Corner, rectangular residential lot (approx. 123 x 93)
- Construction: Vinyl siding; Existing construction (year built: existing)
- Exterior features: Covered porch; Deck; Shed(s)/storage; See remarks
Interior
- Kitchen: Gas oven; Gas range; Refrigerator
- Bedrooms: Four bedrooms — three on the second floor and one on the first floor
- Flooring: Carpet; Hardwood; Vinyl; Varied flooring
- Bathrooms: One full bathroom (main level)
- Heating & cooling: Gas forced-air heating
- Interior features: Ceiling fan(s); Separate/formal dining room; Separate/formal living room; Bedroom on main level; Full basement with sump pump; One fireplace
- Laundry & utility: Gas water heater
Neighborhood map
What this means for you Summary
Snapshot
- This is a 4-bed/1.0-bath single-family listed at $85k.
Deal economics
- At list price, monthly cash flow is $598 ($7k/yr) — positive.
- The deal already cash-flows at list — no discount required.
- Meets the 1% rule at list price ($2k rent vs $85k).
- Recommended offer: $80k (6.0% below list) — sets the bar for market timing.
- Cap rate 14.7% vs local median 4.9% in Medina — top-decile yield for the area; either an underpriced asset or a hidden risk that comps aren't pricing in. Stress-test before assuming the spread holds.
Location & tenants
- Location reads 72/100 on livability (#344 in NY) — a middle-class / working-renter tenant base. Strengths: cost of living A+, housing A+, health & safety A+; Watch: crime D-, amenities F, commute F.
- Medina Central School District (town): math 37% / reading 38% proficiency, ranked #548 of 590 in NY (top 93%) — families likely to look elsewhere, expect single-tenant / working-renter base with shorter leases.
- Zoned schools: Clifford Wise Intermediate School (math 17% / reading 34%, grade F, #1,821 of 2,108 statewide, top 86%, 395 students, 55% FRL); Medina Junior-Senior High School (math 67% / reading 52%, grade C+, #851 of 1,100 statewide, top 80%, 614 students, 46% FRL).
- Market conditions: 58 active listings in the ZIP; 28 units permitted in Orleans County in 2024 (0 in 5+ unit buildings).
Forward outlook
- In year one you build about $364 of equity ($588 loan paydown + $-224 appreciation (-0.3% local appreciation)).
- Orleans County population projected at -20% by 2050 — secular population decline; favor cash flow + early exit over multi-decade hold.
- At projected returns (-0.3% appreciation + 3.0% rent growth), your $24k cash investment doubles in ~3 years — after that, you're playing with house money.
Negotiation context
- It's been on market 90 days — a 6% lower offer ($80k) is reasonable based on typical stale-listing flexibility.
- Current owner paid $48k; list at $85k implies a 79% gain — meaningful room to come down on a strong offer.
Risks & watch-outs
- Watch-outs: property tax is 3.6% of price; built in 1860 — expect roof / HVAC / electrical / plumbing capex.
Questions for the listing agent
- It's been on market 90 days. Have you received any prior offers? Is the seller open to a 6% concession, seller financing, or rate buy-down credit?
- Built in 1860 — when were the roof, HVAC, electrical panel, plumbing, and water heater last replaced?
- Property tax is high relative to price — has the assessment been appealed recently, and will the sale trigger a re-assessment?
- Why hasn't it sold? Are there any deal-killer items the seller is aware of (foundation, flood, title, zoning, code violations)?
- Is there a deadline driving the sale (1031 exchange, divorce, estate, relocation)? That informs how much negotiation room exists.
- Crime grade is D in this area — have there been break-ins, vandalism, or insurance claims at this property in the last 3 years? What carrier currently insures it and at what premium?
- What's the average days-on-market for RENTAL listings here right now (not sales)? A rising rental-DOM trend means longer vacancies and softer asking-rent achievability than the comps imply.
- What's the recent tenant-quality profile in this submarket — average credit score on applications, eviction rate, late-payment / NSF rate, and stable-employment percentage? A property-management company in the area should have these aggregated.
- How much new for-sale + rental construction is in the pipeline within 1–3 miles? Heavy new supply typically softens prices + rents 12–24 months out; constrained supply supports both.
Investment metrics
- 1% rule
- 1.98% ✓
- Cap rate
- 14.74%
- Cash-on-cash
- 30.16%
- DSCR
- 2.34
- GRM
- 4.2
CMA / ARV
- ARV (on-the-fly)
- $55,440
- Comps found
- 2
Show comp detail 2 sales within ~0.75 mi
| Address | Dist | Beds/Ba | Sqft | Sold | Price | $/sf | Match |
|---|---|---|---|---|---|---|---|
| 11307 Main St | 0.09mi | 3/1.0 (-1) | 1,196 (-9%) | 15mo | $50,000 | $42 | 62 |
| 4555 S Gravel Rd | 0.25mi | 3/1.0 (-1) | 1,232 (-7%) | 21mo | $40,000 | $32 | 55 |
Match score weights: distance 35% · size 25% · config 20% · recency 20%. Top-matched comps best support the ARV.
Projected returns pro-forma
-0.26% appreciation · 3.0% rent growth · sell at horizon
- IRR
- 30.3%
- Equity multiple
- 2.46×
- Total profit
- $34,683
- Equity at exit
- $23,565
- IRR
- 34.2%
- Equity multiple
- 4.77×
- Total profit
- $89,713
- Equity at exit
- $27,450
Cash invested: $23,800 (down + closing). Projections, not guarantees.
Landlord ↔ Tenant lean methodology
- Overall (STATE)
- 15 Strongly Tenant-Friendly
- State New York
- 15 Strongly Tenant-Friendly · D+10
- County
- — inherits STATE
- City
- — inherits STATE
ZIP-level market 14103
- Home prices YoY
- -0.1%
- Active inventory
- 58
- Price-to-rent
- 4.2×
Monthly cashflow live
- Estimated rent
- $1,686 medium interval (Pro) →
- Mortgage (P&I)
- −$446
- Tax from tax record
- −$252 /mo · $3,027/yr
- Insurance
- −$35
- HOA
- −$0
- Vacancy / Maint / Mgmt
- −$354
- Net cashflow
- $598
Break-even live
Sensitivity live
| Price | -10% $646 | -5% $622 | +0% $598 | +5% $574 | +10% $550 |
|---|---|---|---|---|---|
| Rent | -10% $465 | -5% $532 | +0% $598 | +5% $665 | +10% $731 |
| Rate | -1.0pp $641 | -0.5pp $620 | base $598 | +0.5pp $576 | +1.0pp $554 |
UW: 25.0% down · 7.5% · 30yr · 1.5% tax · 5.0% vac · 8.0% maint · 8.0% mgmt
Financing live
Cash to close
- Down payment
- $21,250
- Closing costs
- $2,550
- Reserves months
- —
- Total cash needed
- —
Loan-product check · same deal, 3 products live
Conventional
25% down · 7.5% · 30yr
- Down + closing
- —
- Monthly P&I
- —
- Monthly cashflow
- —
- DSCR
- —
- Eligible?
- —
Personal DTI + credit; lowest rate.
DSCR
20% down · 8.5% · 30yr
- Down + closing
- —
- Monthly P&I
- —
- Monthly cashflow
- —
- DSCR
- —
- Eligible?
- —
No personal income docs; deal must DSCR.
Hard money
10% down · 12.0% · 12mo
- Down + closing
- —
- Monthly P&I
- —
- Monthly cashflow
- —
- DSCR
- —
- Eligible?
- —
Short-term bridge; refi at stabilization.
Listing history 5 events
-
2026-04-20status Pending
-
2026-03-11price $85,000
-
2026-02-04price $89,000
-
2026-01-19$95,000 Active
-
1994-12-30soldstatus $47,500
ⓘ Source: listings_history table (triggers on properties + properties_extension) + one-shot
backfill from property_details.listing_events for pre-trigger history.
Tax reassessment forecast NY · Partial reset (capped growth)
- Current annual tax
- $3,027 · $252/mo
- Projected year-2 tax
- $3,027 · $252/mo
- Expected delta
- $0/yr ($0/mo · 0.0%)
ⓘ Screening estimate from a state-policy table — verify with the county assessor before closing.
Climate risk First Street
- Flood 1/10 Low FEMA zone X · 0% chance over 30 yrs
- Wildfire 1/10 Low
- Heat 2/10 Low 7 d/yr ≥94°F today · 16 d/yr by 30 yrs out
- Wind 1/10 Low
- Air quality 2/10 Low 1 unhealthy d/yr today · 2 by 30 yrs out
Nearby sold comps map
Loading sold comps map…
Walkable amenities ~0.75 mi
Loading nearby amenities…
Taxation est. · year 1
- Rental income
- $20,228
- − Mortgage interest
- −$4,761
- − Property taxes
- −$3,027
- − Insurance
- −$425
- − Repairs & maintenance
- −$1,618
- − Management
- −$1,618
- − Depreciation
- −$2,473
- Taxable income
- $6,305
- Est. tax owed @ 24.0%
- −$1,513
- After-tax cash flow
- $5,666/yr
For passive investors: Depreciation is non-cash, so a rental often shows a tax loss while cash-flowing — sheltering income. Rental losses are passive: they offset passive income freely, and up to $25,000/yr can offset ordinary (W-2) income if you actively participate and your MAGI is under $100k (phasing out to $0 by $150k); unused losses carry forward. On sale, claimed depreciation is recaptured at up to 25%, and gains may owe capital-gains tax (a 1031 exchange can defer both). Figures are a year-1 estimate at your 24.0% rate — not tax advice; consult a CPA.
Schools (NCES district)
- District
- Medina Central School District
- NCES district ID
- 3618960
- Math proficiency
- 37% ▼ -12.00%
- Reading proficiency
- 38% ▼ -6.00%
- Median HH income
- $43,046
- Composite
- 31.76/100
- National rank
- #5901
- State rank
- #548 of 590 in NY
Livability — Medina
- Score
- 72/100
- State rank
- #344
- US rank
- #5814
Category grades
Schools grade is shown separately in the Schools card above.
Census & demographics
- City population
- 10,836
- Population (ZIP)
- 10,836
Population outlook (Orleans County) Hauer SSP2
- Today (2025)
- 39,123 people
- By 2030
- 37,648 · -3.8%
- By 2040
- 34,432 · -12.0%
- By 2050
- 31,487 · -19.5%
- By 2075
- 26,544 · -32.2%
- By 2100
- 22,251 · -43.1%
Race, ethnicity, and origin ACS 2023
- Neighborhood character
- Predominantly White (83%)
- Race & ethnicity
- White 83% Hispanic / Latino 6% Two or more races 5% Black 4% Asian 2%
- Hispanic origin (detail)
- Mexican 4%
- Common ancestry
- Romanian 9% Slovak 2% Lithuanian 1%
- Foreign-born
- 4% · Canada, China
- Languages at home
- 89% English-only · Spanish 5% German/W. Germanic 3% Chinese 1%
Political lean MEDSL · Orleans
- 2024 margin
- Solid R (+40.5) · D 29.8% · R 70.2%
- 2008→2024 swing
- -21.8pp toward R · 2008: -18.7pp · 2024: -40.5pp
- All cycles
- 2024: R+40.5 2020: R+36.0 2016: R+43.4 2012: R+19.4 2008: R+18.7
Not yet ingested
- Civics
- —
Market trends
- HPI YoY
- ▼ -0.26%
- Current HPI
- 307.0342
- Rent YoY
- —
- Metro
- —
- State GDP YoY
- ▲ 2.60%
- F500 in state
- 92
Industry mix (Fortune 500 HQ in NY)
| Industry | F500 HQs | Revenue |
|---|---|---|
| Financial Services | 10 | $950B |
|
||
| Consumer Goods | 9 | $162B |
|
||
| Insurance | 4 | $225B |
|
||
| Telecommunications | 2 | $144B |
|
||
| Pharmaceuticals | 2 | $112B |
|
||
| Media / Entertainment | 2 | $69B |
|
||
Price history
+78.9% since first listed5 events — show timeline
- 2026-04-20 Pending — UNYREIS
- 2026-03-11 Price Changed $85,000 UNYREIS
- 2026-02-04 Price Changed $89,000 UNYREIS
- 2026-01-19 Listed $95,000 UNYREIS
- 1994-12-30 Sold (Public Records) $47,500 Public Records
Property tax history
+3.0%/yrLatest (2025): $3,027 · +2.0% YoY. Source: county tax records.
Cash-flow waterfall
monthlySold comps — $/sqft
last 12 mo · ≤1 miLoading sold comps…