 Multi-family
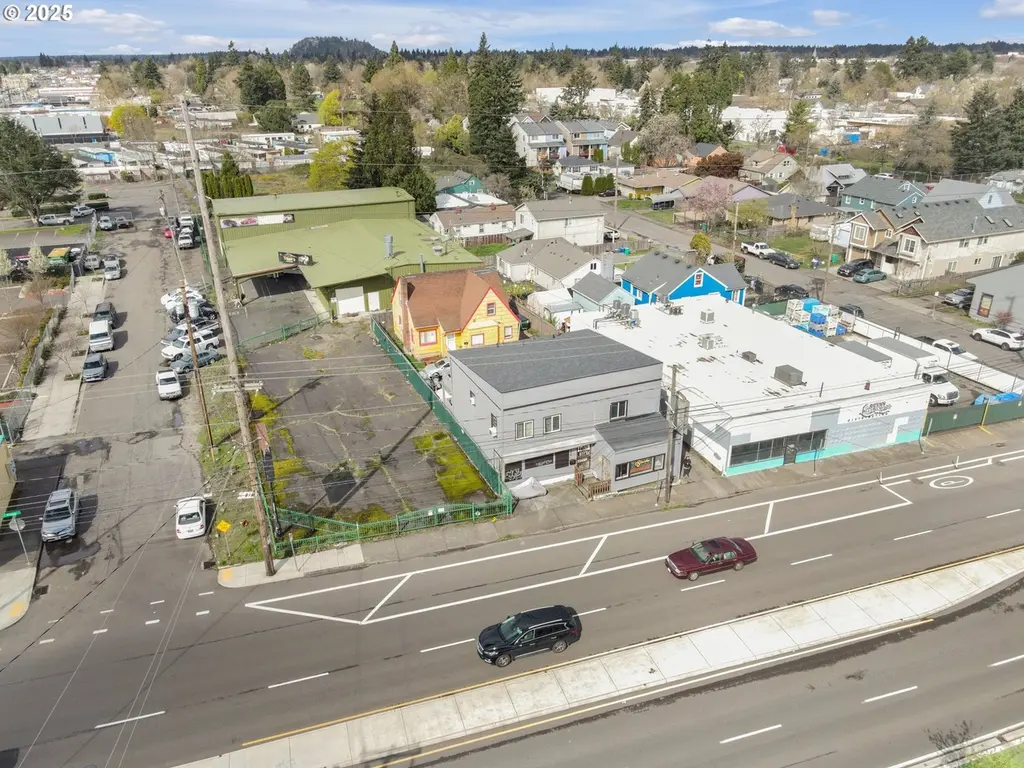
8325 SE Division St · Portland, OR
Flood risk No data
- FEMA flood zone
- —
- Chance of flooding over 30 yrs
- —
- Est. flood insurance / yr
- —
Fire risk No data
- Est. fire insurance / yr
- —
Heat risk 3/10 · Minor
- Hot days now (above threshold)
- 7 days/yr
- Hot days in 30 yrs
- 15 days/yr
Wind risk No data
- Chance of severe wind over 30 yrs
- —
Air-quality risk 10/10 · Severe
- Unhealthy air days now
- 19 days/yr
- Unhealthy air days in 30 yrs
- 21 days/yr
Risk factors via First Street. Map © Google.
Why this score? — see what drove the C grade
The composite is a weighted blend of 9 inputs, each scored 0–100. Each bar is that input's sub-score; the figure is the points it added to the 100-point composite (weight × sub-score).
- Cash flow +18.6/30.0
- ARV discount +15.0/15.0
- DSCR +5.8/10.0
- 1% rule +5.0/10.0
- Schools +4.7/10.0
- Livability +3.9/5.0
- Rent growth +2.5/5.0
- Condition / age +2.5/5.0
- Appreciation +0.0/10.0
$645,000
🖨 Deal sheet (PDF) 📄 Offer letter ✓ Due diligence
Multi-family units
County records classify this as Multi-Family (2-4 Unit). Listing-text estimate: 1 unit. estimate disagrees with records
Listing remarks MLS
Mixed use property with 4 apts and approx 1300 SF retail space available. Great location for business venture right on Division. 2 rear units may be converted back to approx 1700 SF home. To be sold "as is".
Key facts
- 6,534 sq ft lot
- 6 parking spots
- Built 1930
Property features AI
Finance
- Other: Building total area approximately 5,500
- Financial info: Five total units; Unit mix: one larger unit (~1,431 area) plus four smaller units (approximately 504–773 area); Current rents reported for four units: $1,067; $1,413; $1,400; $1,200; Rent covers water, sewer, and trash for tenants; Cap rate: 7.85; Gross rent multiplier: 10.58
- HOA & community: Zoned CM2
Exterior
- Parking: Driveway parking; Parking for 6 vehicles
- Utilities: Public water; Public sewer; Electric-powered systems
- Home design: Multi-family property; Detached building; Built in 1930
- Construction: Wood siding construction; Year built: 1930
- Exterior features: Wood siding; Level lot; Paved road access
Interior
- Kitchen: Electric hot water
- Bedrooms: One 2-bedroom unit; Three 1-bedroom units
- Bathrooms: One 2-bath unit; Four 1-bath units
- Heating & cooling: Forced air heating; Wall heaters; No central cooling
- Interior features: Storage in basement; Unfinished basement
- Laundry & utility: Electric utility service
Neighborhood map
What this means for you Summary
Snapshot
- This is a 5-bed/6.0-bath multifamily listed at $645k.
Deal economics
- At list price, monthly cash flow is $623 ($7k/yr) — positive.
- The deal already cash-flows at list — no discount required.
- To meet the 1% rule (rent ≥ 1% of price), the offer needs to be $643k (0.3% below list).
- Recommended offer: $643k (0.3% below list) — sets the bar for 1% rule.
- Cap rate 7.5% vs local median 2.2% in Portland — top-decile yield for the area; either an underpriced asset or a hidden risk that comps aren't pricing in. Stress-test before assuming the spread holds.
Location & tenants
- Location reads 77/100 on livability (#72 in OR, #3,256 nationally) — a middle-class / working-renter tenant base. Strengths: amenities A+, commute A+, health & safety A+; Watch: crime F, cost of living F.
- Portland SD 1J (urban): math 46% / reading 58% proficiency, ranked #23 of 183 in OR (top 13%) — acceptable for families but not a draw, mixed tenant base, ~2y average lease.
- Zoned schools: Harrison Park School (573 students, 66% FRL); Leodis V. Mcdaniel High School (1,440 students, 65% FRL) — zoned schools average 65% FRL vs 37% district-wide (29 pts higher); higher-poverty schools than district average — tighter screening recommended.
- Market conditions: Rents soft (-0.1%/yr); 210 active listings in the ZIP; 2,041 units permitted in Multnomah County in 2024 (905 in 5+ unit buildings).
- At $6,431/mo this rent would consume 106% of the median local household income ($73k/yr) (locally 2167% of renters already pay >50% of income on rent) — very limited rent-growth headroom before tenants either downsize or default.
Forward outlook
- Local home prices are declining (-3.0%/yr); year-one equity from $4k of loan paydown is wiped out by about $19k of value loss. Plan a longer hold.
- Multnomah County population projected at +33% by 2050 — long-run rental-demand tailwind backs the buy-and-hold thesis.
Negotiation context
- Only 5 days on market — expect competitive offers; lowballing is unlikely to land.
- 2 sale attempts since 19y ago with the ask held roughly flat each time — persistent listings suggest the price (not the market) is what's stuck; bring a comps-based counter.
- Current owner paid $505k; 28% above their basis — modest negotiation headroom, anchor on the comps not their cost.
Risks & watch-outs
- Watch-outs: built in 1930 — expect roof / HVAC / electrical / plumbing capex.
Questions for the listing agent
- Built in 1930 — when were the roof, HVAC, electrical panel, plumbing, and water heater last replaced?
- Is there a deadline driving the sale (1031 exchange, divorce, estate, relocation)? That informs how much negotiation room exists.
- Crime grade is F in this area — have there been break-ins, vandalism, or insurance claims at this property in the last 3 years? What carrier currently insures it and at what premium?
- What's the average days-on-market for RENTAL listings here right now (not sales)? A rising rental-DOM trend means longer vacancies and softer asking-rent achievability than the comps imply.
- What's the recent tenant-quality profile in this submarket — average credit score on applications, eviction rate, late-payment / NSF rate, and stable-employment percentage? A property-management company in the area should have these aggregated.
- How much new apartment / multifamily construction is in the pipeline within 1–3 miles? Heavy new supply (>2% of stock underway) typically softens rents 12–24 months out; light construction supports rent growth.
Investment metrics
- 1% rule
- 1.00% ✗
- Cap rate
- 7.45%
- Cash-on-cash
- 4.14%
- DSCR
- 1.18
- GRM
- 8.4
CMA / ARV
- ARV (median comp)
- $905,665
- List price
- $645,000
- Delta
- -22.93%
- Verdict
- UNDERPRICED
- Comps
- 3 within 1.0 mi
Projected returns pro-forma
-3.0% appreciation · 0.0% rent growth · sell at horizon
- IRR
- -13.2%
- Equity multiple
- 0.54×
- Total profit
- $-83,586
- Equity at exit
- $96,172
- IRR
- -9.8%
- Equity multiple
- 0.48×
- Total profit
- $-94,129
- Equity at exit
- $55,768
Cash invested: $180,600 (down + closing). Projections, not guarantees.
Landlord ↔ Tenant lean methodology
- Overall (CITY)
- 0 Strongly Tenant-Friendly
- State Oregon
- 28 Tenant-Leaning · D+6
- County
- — inherits STATE
- City Portland
- 0 Strongly Tenant-Friendly · D+39
ZIP-level market 97266
- Rents YoY
- -0.1%
- Active inventory
- 210
- Price-to-rent
- 33.4×
Monthly cashflow live
- Estimated rent
- $6,431 high interval (Pro) →
- Mortgage (P&I)
- −$3,382
- Tax est. 1.5%
- −$806 /mo · $9,675/yr
- Insurance
- −$269
- HOA
- −$0
- Vacancy / Maint / Mgmt
- −$1,351
- Net cashflow
- $623
Break-even live
Sensitivity live
| Price | -10% $1,069 | -5% $846 | +0% $623 | +5% $400 | +10% $177 |
|---|---|---|---|---|---|
| Rent | -10% $115 | -5% $369 | +0% $623 | +5% $877 | +10% $1,131 |
| Rate | -1.0pp $948 | -0.5pp $787 | base $623 | +0.5pp $456 | +1.0pp $286 |
4-unit breakdown (identical units grouped — click to expand)
| Units | Beds | Baths | Est. rent |
|---|---|---|---|
| 4× units | 1 | 1 | $6,432 |
| #1 | 1 | 1 | $1,608 |
| #2 | 1 | 1 | $1,608 |
| #3 | 1 | 1 | $1,608 |
| #4 | 1 | 1 | $1,608 |
| Total (4 units) | $6,431 | ||
UW: 25.0% down · 7.5% · 30yr · 1.5% tax · 5.0% vac · 8.0% maint · 8.0% mgmt
Financing live
Cash to close
- Down payment
- $161,250
- Closing costs
- $19,350
- Reserves months
- —
- Total cash needed
- —
Loan-product check · same deal, 3 products live
Conventional
25% down · 7.5% · 30yr
- Down + closing
- —
- Monthly P&I
- —
- Monthly cashflow
- —
- DSCR
- —
- Eligible?
- —
Personal DTI + credit; lowest rate.
DSCR
20% down · 8.5% · 30yr
- Down + closing
- —
- Monthly P&I
- —
- Monthly cashflow
- —
- DSCR
- —
- Eligible?
- —
No personal income docs; deal must DSCR.
Hard money
10% down · 12.0% · 12mo
- Down + closing
- —
- Monthly P&I
- —
- Monthly cashflow
- —
- DSCR
- —
- Eligible?
- —
Short-term bridge; refi at stabilization.
Listing history 15 events
-
2026-06-21days on market $645,000 Active 5 DOM
-
2026-06-18days on market $645,000 Active 2 DOM
-
2026-06-17pricedays on market $645,000 Active 1 DOM
-
2026-01-20price $698,000 695-char remark
-
2026-01-20price $689,000 695-char remark
-
2025-11-13price $725,000 695-char remark
-
2025-10-14price $748,000 695-char remark
-
2025-09-04price $795,000 695-char remark
-
2025-07-22price $848,000 695-char remark
-
2025-06-23price $875,000 695-char remark
-
2025-05-06price $950,000 695-char remark
-
2025-04-03$1,050,000 Active 695-char remark
-
2007-06-07soldstatus $505,000 220-char remark
Show marketing remark (220 chars)
Mixed use property with 4 apts and approx 1300 SF retail space available. Great location for business venture right on Division. 2 rear units may be converted back to approx 1700 SF home. To be sold "as is".
-
2007-05-29historical 220-char remark
Show marketing remark (220 chars)
Mixed use property with 4 apts and approx 1300 SF retail space available. Great location for business venture right on Division. 2 rear units may be converted back to approx 1700 SF home. To be sold "as is".
-
2007-04-23$625,000 220-char remark
Show marketing remark (220 chars)
Mixed use property with 4 apts and approx 1300 SF retail space available. Great location for business venture right on Division. 2 rear units may be converted back to approx 1700 SF home. To be sold "as is".
ⓘ Source: listings_history table (triggers on properties + properties_extension) + one-shot
backfill from property_details.listing_events for pre-trigger history.
Climate risk First Street
- Heat 3/10 Moderate
- Air quality 10/10 Extreme 19 unhealthy d/yr today · 21 by 30 yrs out
Nearby sold comps map
Loading sold comps map…
Walkable amenities ~0.75 mi
Loading nearby amenities…
Taxation est. · year 1
- Rental income
- $77,172
- − Mortgage interest
- −$36,130
- − Property taxes
- −$9,675
- − Insurance
- −$3,225
- − Repairs & maintenance
- −$6,174
- − Management
- −$6,174
- − Depreciation
- −$18,764
- Taxable loss
- −$2,969
- Est. tax savings @ 24.0%
- +$713
- After-tax cash flow
- $8,189/yr
For passive investors: Depreciation is non-cash, so a rental often shows a tax loss while cash-flowing — sheltering income. Rental losses are passive: they offset passive income freely, and up to $25,000/yr can offset ordinary (W-2) income if you actively participate and your MAGI is under $100k (phasing out to $0 by $150k); unused losses carry forward. On sale, claimed depreciation is recaptured at up to 25%, and gains may owe capital-gains tax (a 1031 exchange can defer both). Figures are a year-1 estimate at your 24.0% rate — not tax advice; consult a CPA.
Schools (NCES district)
- District
- Portland SD 1J
- NCES district ID
- 4110040
- Math proficiency
- 46% ▼ -2.00%
- Reading proficiency
- 58% ▼ -3.00%
- Median HH income
- $57,851
- Composite
- 47.1/100
- National rank
- #5112
- State rank
- #23 of 183 in OR
Livability — Portland
- Score
- 77/100
- State rank
- #72
- US rank
- #3256
Category grades
Schools grade is shown separately in the Schools card above.
Census & demographics
- Census place
- Portland, OR
- County
- Multnomah County · 786,692 people
- City population
- 774,334
- Metro
- Portland-Vancouver-Hillsboro, OR-WA
- Population (ZIP)
- 35,423
- Household income
- $72,577
- Rent vs Own
- Severe rent burden
- 2167.0
Population outlook (Multnomah County) Hauer SSP2
- Today (2025)
- 930,825 people
- By 2030
- 996,904 · +7.1%
- By 2040
- 1,121,379 · +20.5%
- By 2050
- 1,242,124 · +33.4%
- By 2075
- 1,464,431 · +57.3%
- By 2100
- 1,576,181 · +69.3%
Race, ethnicity, and origin ACS 2023
- Neighborhood character
- Diverse neighborhood (Simpson 0.65)
- Race & ethnicity
- White 54% Asian 16% Hispanic / Latino 14% Two or more races 11% Black 7% Native American 2%
- Hispanic origin (detail)
- Mexican 11%
- Common ancestry
- Italian 3% Slovak 2% Portuguese 2%
- Foreign-born
- 21% · China, Vietnam, Canada
- Languages at home
- 70% English-only · Spanish 9% Vietnamese 6% Chinese 6%
Political lean MEDSL · Multnomah
- 2024 margin
- Solid D (+62.1) · D 79.3% · R 17.2% · Other 3.5%
- 2008→2024 swing
- +6.0pp toward D · 2008: 56.1pp · 2024: 62.1pp
- All cycles
- 2024: D+62.1 2020: D+61.3 2016: D+58.3 2012: D+54.9 2008: D+56.1
Not yet ingested
- Civics
- —
Market trends
- HPI YoY
- ▼ -300.41%
- Current HPI
- 308.6145
- Rent YoY
- ▼ -0.09%
- Metro
- Portland-Vancouver-Hillsboro, OR-WA
- State GDP YoY
- ▲ 2.05%
- F500 in state
- 2
Industry mix (Fortune 500 HQ in OR)
| Industry | F500 HQs | Revenue |
|---|---|---|
| Consumer Goods | 1 | $51B |
|
||
Price history
+3.2% since first listed4 events — show timeline
- 2026-06-16 Listed $645,000 RMLS
- 2007-06-07 Sold (MLS) $505,000 RMLS
- 2007-05-29 Delisted — RMLS
- 2007-04-23 Listed $625,000 RMLS
Cash-flow waterfall
monthlySold comps — $/sqft
last 12 mo · ≤1 miLoading sold comps…