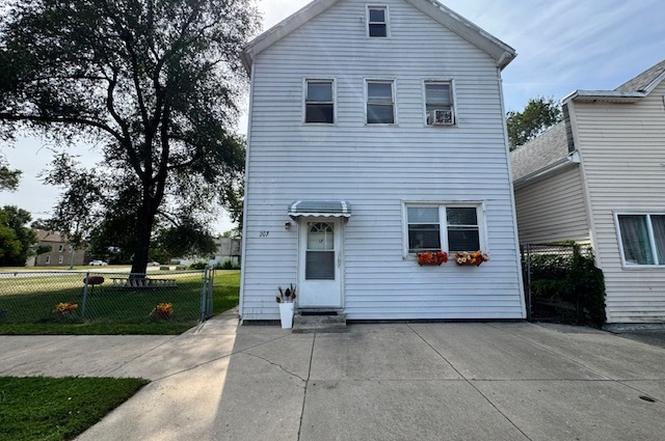
 Fourplex
207 155th St · Calumet City, IL
Flood risk 1/10 · Minimal
- FEMA flood zone
- X (unshaded)
- Chance of flooding over 30 yrs
- 0.0%
- Est. flood insurance / yr
- $473 – $860
Fire risk 1/10 · Minimal
- Est. fire insurance / yr
- $804 – $1,492
Heat risk 3/10 · Minor
- Hot days now (above 102°F)
- 7 days/yr
- Hot days in 30 yrs
- 15 days/yr
Wind risk 2/10 · Minimal
- Chance of severe wind over 30 yrs
- 0.0%
Air-quality risk 4/10 · Minor
- Unhealthy air days now
- 5 days/yr
- Unhealthy air days in 30 yrs
- 6 days/yr
Risk factors via First Street. Map © Google.
Why this score? — see what drove the B- grade
The composite is a weighted blend of 9 inputs, each scored 0–100. Each bar is that input's sub-score; the figure is the points it added to the 100-point composite (weight × sub-score).
- Cash flow +30.0/30.0
- 1% rule +10.0/10.0
- DSCR +10.0/10.0
- ARV discount +7.5/15.0
- Rent growth +4.0/5.0
- Livability +3.6/5.0
- Condition / age +2.5/5.0
- Schools +1.0/10.0
- Appreciation +0.0/10.0
$235,000
🖨 Deal sheet (PDF) 📄 Offer letter ✓ Due diligence
Multi-family units
County records classify this as Multi-Family (2-4 Unit). Listing-text estimate: 4 units. confirmed
Listing remarks
Solid frame 4-unit building with excellent rental potential, situated on a rare double lot. Currently occupied by month-to-month tenants, the property includes one spacious 3-bedroom unit and three well-sized 2-bedroom units. Each unit features its own furnace, water heater, and electrical service, allowing for individual utilities and reduced owner expenses. The extra lot offers additional outdoor space, potential for expansion, or added amenities. Ideally located near shops, schools, and public transportation, with easy access to major expressways-this is a great opportunity for investors or owner-occupants looking to maximize value.
Key facts
- 6,250 sq ft lot
- Built 1908
- Listed 273 days
Property features AI
Finance
- Other: Parcel numbers on file
- Financial info: 4 units in building; Some units currently rented (listed rents $900 each); Security deposits listed at $750 for units; Tenants responsible for electric and heat
Exterior
- Utilities: Public water; Public sewer
- Home design: Two- to four-unit property; Fee simple ownership; Older building (100+ years); Built before 1978; Frame construction
- Construction: Frame construction
- Exterior features: Lot dimensions approximately 50 x 125
Interior
- Kitchen: Each unit equipped with stove and refrigerator
- Bedrooms: 9 bedrooms total; Building includes 3-bedroom unit(s)
- Bathrooms: 4 full bathrooms
- Heating & cooling: Natural gas heating; Forced air; Multiple separate heating systems (2+)
- Interior features: 17 total rooms; Crawl space basement
- Laundry & utility: Tenants pay for electricity and heat (for listed units)
Neighborhood map
What this means for you Summary
Snapshot
- This is a 3×2bd/1.0ba + 1×3bd/1.0ba units multifamily listed at $235k.
Deal economics
- At list price, monthly cash flow is $2k ($28k/yr) — positive. Per door: $574/mo.
- The deal already cash-flows at list — no discount required.
- Meets the 1% rule at list price ($6k rent vs $235k).
- Recommended offer: $207k (12.0% below list) — sets the bar for market timing.
- Cap rate 18.0% vs local median 8.2% in Calumet City — top-decile yield for the area; either an underpriced asset or a hidden risk that comps aren't pricing in. Stress-test before assuming the spread holds.
Location & tenants
- Location reads 71/100 on livability (#330 in IL) — a middle-class / working-renter tenant base. Strengths: commute A+, cost of living A+, housing A+; Watch: employment C-, schools F, crime D-.
- Thornton Fractional Twp Hsd 215 (suburban): math 9% / reading 13% proficiency, ranked #563 of 620 in IL (top 91%) — low school quality limits family demand, transient renter base, plan for 1-2y turnover.
- Market conditions: Rents rising fast (+6.2%/yr); 198 active listings in the ZIP; 6,272 units permitted in Cook County in 2024 (4,658 in 5+ unit buildings).
- At $5,740/mo this rent would consume 124% of the median local household income ($55k/yr) (locally 2415% of renters already pay >50% of income on rent) — very limited rent-growth headroom before tenants either downsize or default.
Forward outlook
- Local home prices are declining (-3.0%/yr); year-one equity from $2k of loan paydown is wiped out by about $7k of value loss. Plan a longer hold.
- At projected returns (-3.0% appreciation + 6.2% rent growth), your $66k cash investment doubles in ~3 years — after that, you're playing with house money.
Negotiation context
- It's been on market 273 days — a 12% lower offer ($207k) is reasonable based on typical stale-listing flexibility.
- 6 sale attempts since 19y ago; this cycle's ask has dropped $20k (8%) from the opening price — seller is motivated, your offer sets the floor, not the list.
Risks & watch-outs
- Watch-outs: property tax is 4.6% of price; built in 1908 — expect roof / HVAC / electrical / plumbing capex.
Questions for the listing agent
- It's been on market 273 days. Have you received any prior offers? Is the seller open to a 12% concession, seller financing, or rate buy-down credit?
- Can we see the unit-by-unit rent roll, current vacancy, and any below-market leases? What's the average tenancy length?
- What capital expenditures (roof, boiler, parking lot, exteriors) have been made in the last 5 years, and what's planned in the next 2?
- Built in 1908 — when were the roof, HVAC, electrical panel, plumbing, and water heater last replaced?
- Property tax is high relative to price — has the assessment been appealed recently, and will the sale trigger a re-assessment?
- Why hasn't it sold? Are there any deal-killer items the seller is aware of (foundation, flood, title, zoning, code violations)?
- Is there a deadline driving the sale (1031 exchange, divorce, estate, relocation)? That informs how much negotiation room exists.
- Schools are F-rated, which usually means shorter tenancies and higher turnover. Who's the typical renter profile here, and what's been the actual vacancy rate?
- Crime grade is D in this area — have there been break-ins, vandalism, or insurance claims at this property in the last 3 years? What carrier currently insures it and at what premium?
- What's the average days-on-market for RENTAL listings here right now (not sales)? A rising rental-DOM trend means longer vacancies and softer asking-rent achievability than the comps imply.
- What's the recent tenant-quality profile in this submarket — average credit score on applications, eviction rate, late-payment / NSF rate, and stable-employment percentage? A property-management company in the area should have these aggregated.
- How much new apartment / multifamily construction is in the pipeline within 1–3 miles? Heavy new supply (>2% of stock underway) typically softens rents 12–24 months out; light construction supports rent growth.
Investment metrics
- 1% rule
- 2.44% ✓
- Cap rate
- 18.02%
- Cash-on-cash
- 41.88%
- DSCR
- 2.86
- GRM
- 3.4
CMA / ARV
No comps found within radius.
Projected returns pro-forma
-3.0% appreciation · 6.17% rent growth · sell at horizon
- IRR
- 42.7%
- Equity multiple
- 2.94×
- Total profit
- $127,529
- Equity at exit
- $35,039
- IRR
- 50.5%
- Equity multiple
- 6.84×
- Total profit
- $383,995
- Equity at exit
- $20,319
Cash invested: $65,800 (down + closing). Projections, not guarantees.
Landlord ↔ Tenant lean methodology
- Overall (STATE)
- 43 Moderately Tenant-Leaning
- State Illinois
- 43 Moderately Tenant-Leaning · D+7
- County
- — inherits STATE
- City
- — inherits STATE
ZIP-level market 60409
- Home prices YoY
- -27.6%
- Rents YoY
- 6.2%
- Active inventory
- 198
- Price-to-rent
- 14.3×
Monthly cashflow live
- Estimated rent
- $5,740 high interval (Pro) →
- Mortgage (P&I)
- −$1,232
- Tax from tax record
- −$908 /mo · $10,895/yr
- Insurance
- −$98
- HOA
- −$0
- Vacancy / Maint / Mgmt
- −$1,205
- Net cashflow
- $2,296
Break-even live
Sensitivity live
| Price | -10% $3,073 | -5% $2,363 | +0% $2,296 | +5% $2,230 | +10% $2,163 |
|---|---|---|---|---|---|
| Rent | -10% $1,843 | -5% $2,070 | +0% $2,296 | +5% $2,523 | +10% $2,750 |
| Rate | -1.0pp $2,415 | -0.5pp $2,356 | base $2,296 | +0.5pp $2,235 | +1.0pp $2,174 |
4-unit breakdown (identical units grouped — click to expand)
| Units | Beds | Baths | Est. rent |
|---|---|---|---|
| 3× units | 2 | 1 | $4,107 |
| #1 | 2 | 1 | $1,369 |
| #2 | 2 | 1 | $1,369 |
| #3 | 2 | 1 | $1,369 |
| 1× unit | 3 | 1 | $1,633 |
| Total (4 units) | $5,740 | ||
UW: 25.0% down · 7.5% · 30yr · 1.5% tax · 5.0% vac · 8.0% maint · 8.0% mgmt
Financing live
Cash to close
- Down payment
- $58,750
- Closing costs
- $7,050
- Reserves months
- —
- Total cash needed
- —
Loan-product check · same deal, 3 products live
Conventional
25% down · 7.5% · 30yr
- Down + closing
- —
- Monthly P&I
- —
- Monthly cashflow
- —
- DSCR
- —
- Eligible?
- —
Personal DTI + credit; lowest rate.
DSCR
20% down · 8.5% · 30yr
- Down + closing
- —
- Monthly P&I
- —
- Monthly cashflow
- —
- DSCR
- —
- Eligible?
- —
No personal income docs; deal must DSCR.
Hard money
10% down · 12.0% · 12mo
- Down + closing
- —
- Monthly P&I
- —
- Monthly cashflow
- —
- DSCR
- —
- Eligible?
- —
Short-term bridge; refi at stabilization.
Listing history 32 events
-
2026-06-18days on market $235,000 Active 273 DOM
-
2026-06-17days on market $235,000 Active 272 DOM
-
2026-06-16days on market $235,000 Active 271 DOM
-
2026-06-15days on market $235,000 Active 270 DOM
-
2026-06-13days on market $235,000 Active 268 DOM
-
2026-06-09days on market $235,000 Active 264 DOM
-
2026-06-08days on market $235,000 Active 263 DOM
-
2026-06-07days on market $235,000 Active 262 DOM
-
2026-06-04days on market $235,000 Active 259 DOM
-
2026-06-03days on market $235,000 Active 258 DOM
-
2026-06-02days on market $235,000 Active 257 DOM
-
2026-06-01days on market $235,000 Active 256 DOM
-
2026-05-31days on market $235,000 Active 255 DOM
-
2026-04-14price $235,000
-
2025-09-18$255,000 Active
-
2025-05-06historical
-
2025-03-20status Active
-
2025-02-24historical Contingent - Continue to Show
-
2025-01-10price
-
2024-10-28price
-
2024-10-16Active
-
2022-08-08soldstatus $215,000
-
2019-06-09historical
-
2019-03-11price
-
2018-12-23price
-
2018-10-09New
-
2008-08-18historical
-
2008-06-20soldstatus $2,400,000
-
2007-08-18
-
2007-07-24historical
-
2007-02-09
-
1990-04-26soldstatus $30,000
ⓘ Source: listings_history table (triggers on properties + properties_extension) + one-shot
backfill from property_details.listing_events for pre-trigger history.
Tax reassessment forecast IL · Partial reset (capped growth)
- Current annual tax
- $10,895 · $908/mo
- Projected year-2 tax
- $10,895 · $908/mo
- Expected delta
- $0/yr ($0/mo · 0.0%)
ⓘ Screening estimate from a state-policy table — verify with the county assessor before closing.
Climate risk First Street
- Flood 1/10 Low FEMA zone X (unshaded) · 0% chance over 30 yrs
- Wildfire 1/10 Low
- Heat 3/10 Moderate 7 d/yr ≥102°F today · 15 d/yr by 30 yrs out
- Wind 2/10 Low 0% chance of damaging wind over 30 yrs
- Air quality 4/10 Moderate 5 unhealthy d/yr today · 6 by 30 yrs out
Nearby sold comps map
Loading sold comps map…
Walkable amenities ~0.75 mi
Loading nearby amenities…
Taxation est. · year 1
- Rental income
- $68,880
- − Mortgage interest
- −$13,164
- − Property taxes
- −$10,895
- − Insurance
- −$1,175
- − Repairs & maintenance
- −$5,510
- − Management
- −$5,510
- − Depreciation
- −$6,836
- Taxable income
- $25,789
- Est. tax owed @ 24.0%
- −$6,189
- After-tax cash flow
- $21,367/yr
For passive investors: Depreciation is non-cash, so a rental often shows a tax loss while cash-flowing — sheltering income. Rental losses are passive: they offset passive income freely, and up to $25,000/yr can offset ordinary (W-2) income if you actively participate and your MAGI is under $100k (phasing out to $0 by $150k); unused losses carry forward. On sale, claimed depreciation is recaptured at up to 25%, and gains may owe capital-gains tax (a 1031 exchange can defer both). Figures are a year-1 estimate at your 24.0% rate — not tax advice; consult a CPA.
Schools (NCES district)
- District
- Thornton Fractional Twp Hsd 215
- NCES district ID
- 1738940
- Math proficiency
- 9% ▼ -3.00%
- Reading proficiency
- 13% ▼ -3.00%
- Median HH income
- $48,207
- Composite
- 10.27/100
- National rank
- #9793
- State rank
- #563 of 620 in IL
Livability — Calumet City
- Score
- 71/100
- State rank
- #330
- US rank
- #6552
Category grades
Schools grade is shown separately in the Schools card above.
Census & demographics
- Census place
- Calumet City, IL
- County
- Cook County · 4,486,803 people
- City population
- 35,100
- Metro
- Chicago-Naperville-Elgin, IL-IN-WI
- Population (ZIP)
- 35,100
- Household income
- $55,369
- Rent vs Own
- Severe rent burden
- 2415.0
Population outlook (Cook County) Hauer SSP2
- Today (2025)
- 5,347,519 people
- By 2030
- 5,357,703 · +0.2%
- By 2040
- 5,324,924 · -0.4%
- By 2050
- 5,230,762 · -2.2%
- By 2075
- 4,785,735 · -10.5%
- By 2100
- 4,188,836 · -21.7%
Race, ethnicity, and origin ACS 2023
- Neighborhood character
- Predominantly Black (74%)
- Race & ethnicity
- Black 74% Hispanic / Latino 15% White 7% Two or more races 4%
- Hispanic origin (detail)
- Mexican 14%
- Common ancestry
- Romanian 2%
- Foreign-born
- 9% · Canada
- Languages at home
- 83% English-only · Spanish 14%
Political lean MEDSL · Cook
- 2024 margin
- Solid D (+42.0) · D 70.4% · R 28.4% · Other 1.2%
- 2008→2024 swing
- -11.4pp toward R · 2008: 53.4pp · 2024: 42.0pp
- All cycles
- 2024: D+42.0 2020: D+50.3 2016: D+53.0 2012: D+49.4 2008: D+53.4
Not yet ingested
- Civics
- —
Market trends
- HPI YoY
- ▼ -75.01%
- Current HPI
- 197.2137
- Rent YoY
- ▲ 6.17%
- Metro
- Chicago-Naperville-Elgin, IL-IN-WI
- State GDP YoY
- ▲ 1.59%
- F500 in state
- 60
Industry mix (Fortune 500 HQ in IL)
| Industry | F500 HQs | Revenue |
|---|---|---|
| Insurance | 4 | $201B |
|
||
| Consumer Goods | 4 | $87B |
|
||
| Industrial Machinery | 3 | $64B |
|
||
| Healthcare | 2 | $55B |
|
||
| Retail / Pharmacy | 1 | $148B |
|
||
| Agriculture / Food | 1 | $86B |
|
||
Price history
+683.3% since first listed19 events — show timeline
- 2026-04-14 Price Changed $235,000 MRED as Distributed by MLS Grid
- 2025-09-18 Listed $255,000 MRED as Distributed by MLS Grid
- 2025-05-06 Listing Removed — MRED as Distributed by MLS Grid
- 2025-03-20 Relisted — MRED as Distributed by MLS Grid
- 2025-02-24 Contingent — MRED as Distributed by MLS Grid
- 2025-01-10 Price Changed — MRED as Distributed by MLS Grid
- 2024-10-28 Price Changed — MRED as Distributed by MLS Grid
- 2024-10-16 Listed — MRED as Distributed by MLS Grid
- 2022-08-08 Sold (Public Records) $215,000 Public Records
- 2019-06-09 Listing Removed — MRED as Distributed by MLS Grid
- 2019-03-11 Price Changed — MRED as Distributed by MLS Grid
- 2018-12-23 Price Changed — MRED as Distributed by MLS Grid
- 2018-10-09 Listed — MRED as Distributed by MLS Grid
- 2008-08-18 Listing Removed — MRED as Distributed by MLS Grid
- 2008-06-20 Sold (Public Records) $2,400,000 Public Records
- 2007-08-18 Listed — MRED as Distributed by MLS Grid
- 2007-07-24 Listing Removed — MRED as Distributed by MLS Grid
- 2007-02-09 Listed — MRED as Distributed by MLS Grid
- 1990-04-26 Sold (Public Records) $30,000 Public Records
Property tax history
+3.6%/yrLatest (2023): $10,895 · +54.2% YoY. Source: county tax records.
Cash-flow waterfall
monthlySold comps — $/sqft
last 12 mo · ≤1 miLoading sold comps…