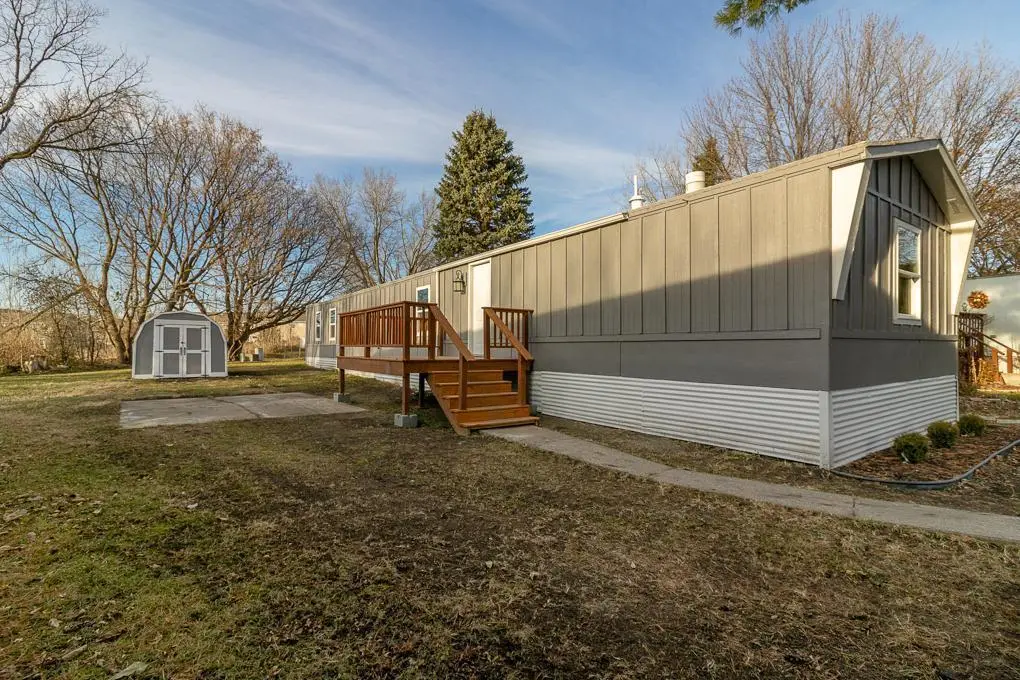
706 Southhaven Dr · Mankato, MN
Flood risk No data
- FEMA flood zone
- —
- Chance of flooding over 30 yrs
- —
- Est. flood insurance / yr
- —
Fire risk No data
- Est. fire insurance / yr
- —
Heat risk No data
- Hot days now (above threshold)
- —
- Hot days in 30 yrs
- —
Wind risk No data
- Chance of severe wind over 30 yrs
- —
Air-quality risk No data
- Unhealthy air days now
- —
- Unhealthy air days in 30 yrs
- —
Risk factors via First Street. Map © Google.
Why this score? — see what drove the B grade
The composite is a weighted blend of 9 inputs, each scored 0–100. Each bar is that input's sub-score; the figure is the points it added to the 100-point composite (weight × sub-score).
- Cash flow +30.0/30.0
- 1% rule +10.0/10.0
- DSCR +10.0/10.0
- ARV discount +7.5/15.0
- Rent growth +4.6/5.0
- Schools +4.4/10.0
- Livability +3.9/5.0
- Condition / age +2.5/5.0
- Appreciation +0.0/10.0
$75,000
🖨 Deal sheet (PDF) 📄 Offer letter ✓ Due diligence
Listing remarks
Discover modern comfort and exceptional value in this renovated 3 - bedroom, 2 - bath mobile home, located in the Southhaven Mobile Home Park. Offers fantastic amenities including an outdoor swimming pool, free seasonal garage pickup and wide streets with gutters. Outdoor Features: Brand new windows installed throughout the home Large newly built deck perfect for grilling, entertaining or relaxing Updated exterior siding and resurfaced roof Concrete patio pad ideal for outdoor furniture or raised garden beds Private south-facing yard located along the edge of the park Park lot rent includes a newly remodeled pool area Interior Features: Modern open concept floor plan with vaulted ceilings
Key facts
- Concrete patio pad
- Newly built deck
- Resurfaced roof
Tags
Neighborhood map
What this means for you Summary
Snapshot
- This is a 3-bed/2.0-bath other listed at $75k.
Deal economics
- At list price, monthly cash flow is $881 ($11k/yr) — positive.
- The deal already cash-flows at list — no discount required.
- Meets the 1% rule at list price ($2k rent vs $75k).
- Recommended offer: $66k (12.0% below list) — sets the bar for market timing.
- Cap rate 20.4% vs local median 3.4% in Mankato — top-decile yield for the area; either an underpriced asset or a hidden risk that comps aren't pricing in. Stress-test before assuming the spread holds.
Location & tenants
- Location reads 77/100 on livability (#133 in MN, #2,970 nationally) — a middle-class / working-renter tenant base. Strengths: housing A+, health & safety A+, cost of living A; Watch: crime C-, amenities C-, commute F.
- Mankato Public School District (urban): math 48% / reading 56% proficiency, ranked #98 of 301 in MN (top 33%) — acceptable for families but not a draw, mixed tenant base, ~2y average lease.
- Market conditions: Rents rising fast (+8.6%/yr); 352 active listings in the ZIP; 7 comparable units currently listed for rent nearby; rentals lingering (median 44d on market — plan ~5-8 weeks vacancy on turnover, expect pricing pressure); 100% of comp listings sitting > 30 days — soft ceiling on asking rent; 269 units permitted in Blue Earth County in 2024 (154 in 5+ unit buildings).
- This rent runs 31% of the median local income ($70k/yr) — at the standard rent-burdened threshold; future hikes will face affordability resistance.
Forward outlook
- Local home prices are declining (-3.0%/yr); year-one equity from $519 of loan paydown is wiped out by about $2k of value loss. Plan a longer hold.
- Blue Earth County population projected at +18% by 2050 — long-run rental-demand tailwind backs the buy-and-hold thesis.
- At projected returns (-3.0% appreciation + 8.0% rent growth), your $21k cash investment doubles in ~3 years — after that, you're playing with house money.
Negotiation context
- It's been on market 136 days — a 12% lower offer ($66k) is reasonable based on typical stale-listing flexibility.
Questions for the listing agent
- It's been on market 136 days. Have you received any prior offers? Is the seller open to a 12% concession, seller financing, or rate buy-down credit?
- Why hasn't it sold? Are there any deal-killer items the seller is aware of (foundation, flood, title, zoning, code violations)?
- Is there a deadline driving the sale (1031 exchange, divorce, estate, relocation)? That informs how much negotiation room exists.
- Schools are B-rated — typically a magnet for longer-tenancy family renters. What's the average tenant stay here, and is there a school-zone premium baked into asking?
- What's the average days-on-market for RENTAL listings here right now (not sales)? A rising rental-DOM trend means longer vacancies and softer asking-rent achievability than the comps imply.
- What's the recent tenant-quality profile in this submarket — average credit score on applications, eviction rate, late-payment / NSF rate, and stable-employment percentage? A property-management company in the area should have these aggregated.
- How much new for-sale + rental construction is in the pipeline within 1–3 miles? Heavy new supply typically softens prices + rents 12–24 months out; constrained supply supports both.
Investment metrics
- 1% rule
- 2.36% ✓
- Cap rate
- 20.39%
- Cash-on-cash
- 50.35%
- DSCR
- 3.24
- GRM
- 3.5
CMA / ARV
No comps found within radius.
Projected returns pro-forma
-3.0% appreciation · 8.0% rent growth · sell at horizon
- IRR
- 53.7%
- Equity multiple
- 3.54×
- Total profit
- $53,355
- Equity at exit
- $11,183
- IRR
- 60.8%
- Equity multiple
- 8.69×
- Total profit
- $161,441
- Equity at exit
- $6,485
Cash invested: $21,000 (down + closing). Projections, not guarantees.
Landlord ↔ Tenant lean methodology
- Overall (STATE)
- 46 Balanced
- State Minnesota
- 46 Balanced · D+2
- County
- — inherits STATE
- City
- — inherits STATE
ZIP-level market 56001
- Rents YoY
- 8.6%
- Active inventory
- 352
- Price-to-rent
- 3.5×
Monthly cashflow live
- Estimated rent
- $1,771 high interval (Pro) →
- Mortgage (P&I)
- −$393
- Tax est. 1.5%
- −$94 /mo · $1,125/yr
- Insurance
- −$31
- HOA
- −$0
- Vacancy / Maint / Mgmt
- −$372
- Net cashflow
- $881
Break-even live
Sensitivity live
| Price | -10% $933 | -5% $907 | +0% $881 | +5% $855 | +10% $829 |
|---|---|---|---|---|---|
| Rent | -10% $741 | -5% $811 | +0% $881 | +5% $951 | +10% $1,021 |
| Rate | -1.0pp $919 | -0.5pp $900 | base $881 | +0.5pp $862 | +1.0pp $842 |
UW: 25.0% down · 7.5% · 30yr · 1.5% tax · 5.0% vac · 8.0% maint · 8.0% mgmt
Financing live
Cash to close
- Down payment
- $18,750
- Closing costs
- $2,250
- Reserves months
- —
- Total cash needed
- —
Loan-product check · same deal, 3 products live
Conventional
25% down · 7.5% · 30yr
- Down + closing
- —
- Monthly P&I
- —
- Monthly cashflow
- —
- DSCR
- —
- Eligible?
- —
Personal DTI + credit; lowest rate.
DSCR
20% down · 8.5% · 30yr
- Down + closing
- —
- Monthly P&I
- —
- Monthly cashflow
- —
- DSCR
- —
- Eligible?
- —
No personal income docs; deal must DSCR.
Hard money
10% down · 12.0% · 12mo
- Down + closing
- —
- Monthly P&I
- —
- Monthly cashflow
- —
- DSCR
- —
- Eligible?
- —
Short-term bridge; refi at stabilization.
Rent comps 7 comps
| Address | Beds | Baths | Sqft | Rent | $/sqft | DOM | Units | Dist |
|---|---|---|---|---|---|---|---|---|
| 109 Willow Cascades Trl Unit 109 WCT Mankato, MN | 3.0 | 2.5 | 1500 | $1,850 | $1.23 | 44d | 1 | 0.12mi |
| 103 Everglades Trl Mankato, MN | 2.0–4.0 | 2.5 | 1453 | $1,860 | $1.28 | 44d | 3 | 0.15mi |
| 701 S Victory Dr Unit 8 Mankato, MN | 2.0 | 1.0 | 925 | $1,349 | $1.46 | 44d | 1 | 0.85mi |
| 875 Heron Dr Mankato, MN | 2.0 | 1.0 | 919 | $1,098 | $1.19 | 44d | 1 | 0.94mi |
| 50 Hilltop Ln Mankato, MN | 1.0–2.0 | 1.0 | 760 | $1,010 | $1.33 | 44d | 11 | 1.24mi |
| 140 Homestead Rd Mankato, MN | 1.0–3.0 | 1.0 | 843 | $1,313 | $1.56 | 44d | 8 | 1.41mi |
| 200 Briargate Rd Mankato, MN | 1.0–3.0 | 1.0–3.0 | 912 | $1,799 | $1.97 | 44d | 32 | 1.44mi |
Listing history 3 events
-
2026-04-20status Pending
-
2026-03-03price $75,000
-
2025-12-05$82,990 Active
ⓘ Source: listings_history table (triggers on properties + properties_extension) + one-shot
backfill from property_details.listing_events for pre-trigger history.
Nearby sold comps map
Loading sold comps map…
Walkable amenities ~0.75 mi
Loading nearby amenities…
Taxation est. · year 1
- Rental income
- $21,257
- − Mortgage interest
- −$4,201
- − Property taxes
- −$1,125
- − Insurance
- −$375
- − Repairs & maintenance
- −$1,701
- − Management
- −$1,701
- − Depreciation
- −$2,182
- Taxable income
- $9,973
- Est. tax owed @ 24.0%
- −$2,394
- After-tax cash flow
- $8,180/yr
For passive investors: Depreciation is non-cash, so a rental often shows a tax loss while cash-flowing — sheltering income. Rental losses are passive: they offset passive income freely, and up to $25,000/yr can offset ordinary (W-2) income if you actively participate and your MAGI is under $100k (phasing out to $0 by $150k); unused losses carry forward. On sale, claimed depreciation is recaptured at up to 25%, and gains may owe capital-gains tax (a 1031 exchange can defer both). Figures are a year-1 estimate at your 24.0% rate — not tax advice; consult a CPA.
Schools (NCES district)
- District
- Mankato Public School District
- NCES district ID
- 2718780
- Math proficiency
- 48% ▼ -11.00%
- Reading proficiency
- 56% ▼ -8.00%
- Median HH income
- $49,469
- Composite
- 44.36/100
- National rank
- #2819
- State rank
- #98 of 301 in MN
Livability — Mankato
- Score
- 77/100
- State rank
- #133
- US rank
- #2970
Category grades
Schools grade is shown separately in the Schools card above.
Census & demographics
- Census place
- Mankato, MN
- County
- Blue Earth County · 51,585 people
- City population
- 51,585
- Metro
- Mankato, MN
- Population (ZIP)
- 51,585
- Household income
- $69,531
- Rent vs Own
- Severe rent burden
- 2394.0
Population outlook (Blue Earth County) Hauer SSP2
- Today (2025)
- 70,208 people
- By 2030
- 72,708 · +3.6%
- By 2040
- 77,481 · +10.4%
- By 2050
- 82,842 · +18.0%
- By 2075
- 99,990 · +42.4%
- By 2100
- 116,795 · +66.4%
Race, ethnicity, and origin ACS 2023
- Neighborhood character
- Predominantly White (83%)
- Race & ethnicity
- White 83% Black 6% Hispanic / Latino 5% Two or more races 4% Asian 3%
- Common ancestry
- Portuguese 11% Lithuanian 3% Romanian 3%
- Foreign-born
- 8% · Canada, Vietnam, South Korea
- Languages at home
- 90% English-only · Spanish 3% Other Indo-European 1% Vietnamese 1%
Political lean MEDSL · Blue Earth
- 2024 margin
- Toss-up / Even · D 48.3% · R 49.5% · Other 2.1%
- 2008→2024 swing
- -14.2pp toward R · 2008: 12.9pp · 2024: -1.2pp
- All cycles
- 2024: R+1.2 2020: D+4.4 2016: R+3.7 2012: D+9.5 2008: D+12.9
Not yet ingested
- Civics
- —
Market trends
- HPI YoY
- ▼ -192.46%
- Current HPI
- 189.8485
- Rent YoY
- ▲ 8.55%
- Metro
- Mankato, MN
- State GDP YoY
- ▲ 2.41%
- F500 in state
- 34
Industry mix (Fortune 500 HQ in MN)
| Industry | F500 HQs | Revenue |
|---|---|---|
| Healthcare | 2 | $407B |
|
||
| Retail | 2 | $150B |
|
||
| Consumer Goods | 2 | $32B |
|
||
| Industrial Machinery | 2 | $6B |
|
||
| Agriculture | 1 | $40B |
|
||
| Healthcare / Medical Devices | 1 | $32B |
|
||
Price history
-9.6% since first listed3 events — show timeline
- 2026-04-20 Pending — NORTHSTARMLS as Distributed by MLS Grid
- 2026-03-03 Price Changed $75,000 NORTHSTARMLS as Distributed by MLS Grid
- 2025-12-05 Listed $82,990 NORTHSTARMLS as Distributed by MLS Grid
Cash-flow waterfall
monthlySold comps — $/sqft
last 12 mo · ≤1 miLoading sold comps…