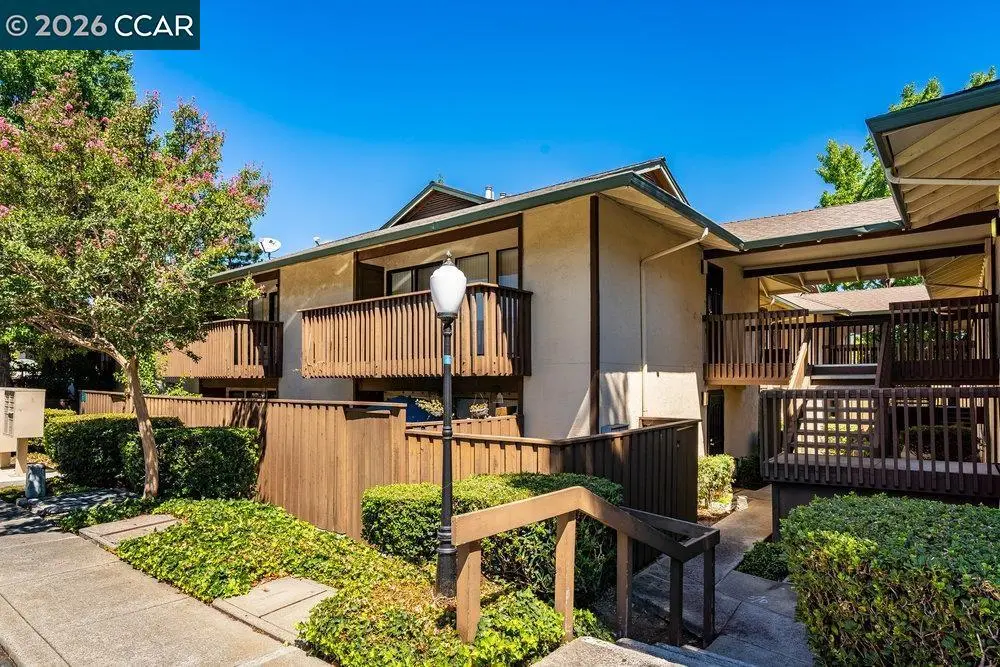
1707 Mahogany Way #59 · Antioch, CA
Flood risk 1/10 · Minimal
- FEMA flood zone
- X (unshaded)
- Chance of flooding over 30 yrs
- 0.0%
- Est. flood insurance / yr
- $507 – $1,088
Fire risk 2/10 · Minimal
- Est. fire insurance / yr
- $659 – $1,223
Heat risk 6/10 · Moderate
- Hot days now (above 100°F)
- 7 days/yr
- Hot days in 30 yrs
- 14 days/yr
Wind risk 1/10 · Minimal
- Chance of severe wind over 30 yrs
- —
Air-quality risk 9/10 · Severe
- Unhealthy air days now
- 16 days/yr
- Unhealthy air days in 30 yrs
- 19 days/yr
Risk factors via First Street. Map © Google.
Why this score? — see what drove the D- grade
The composite is a weighted blend of 9 inputs, each scored 0–100. Each bar is that input's sub-score; the figure is the points it added to the 100-point composite (weight × sub-score).
- ARV discount +12.7/15.0
- Cash flow +8.7/30.0
- 1% rule +4.3/10.0
- Schools +3.8/10.0
- Rent growth +2.8/5.0
- Livability +2.8/5.0
- Condition / age +2.5/5.0
- DSCR +2.4/10.0
- Appreciation +0.0/10.0
$229,000
🖨 Deal sheet (PDF) 📄 Offer letter ✓ Due diligence
Listing remarks MLS
Welcome to your new home! This top-floor, 845-square-foot condo offers the perfect blend of comfort and convenience. Featuring two spacious bedrooms and one full bathroom, this unit has been recently upgraded with brand-new kitchen appliances, the unit includes a washer and dryer conveniently located in the unit! The open concept living area is perfect for both relaxation and entertaining, with plenty of natural light streaming through the sliders. You'll love the community amenities, including a sparkling pool where you can unwind on warm days. Plus, with easy access to the freeway, your daily commute is a breeze. Whether you're a first-time homebuyer or looking to downsize, this condo offers everything you need for comfortable living. Don't miss out on this fantastic opportunity!
Key facts
- $520 HOA
- Community pool
- Built 1979
Neighborhood map
What this means for you Summary
Snapshot
- This is a 2-bed/1.0-bath condo listed at $229k.
Deal economics
- At list price, monthly cash flow is $-192 ($-2k/yr) — negative.
- To cash-flow at today's rent, offer at most $195k (14.8% below list).
- To meet the 1% rule (rent ≥ 1% of price), the offer needs to be $214k (6.6% below list).
- Recommended offer: $195k (14.8% below list) — sets the bar for cash-flow.
- Cap rate 5.3% vs local median 3.9% in Antioch — top-decile yield for the area; either an underpriced asset or a hidden risk that comps aren't pricing in. Stress-test before assuming the spread holds.
Location & tenants
- Location reads 56/100 on livability (#782 in CA) — a working-class tenant base; expect higher turnover. Strengths: employment A+, housing A+, health & safety A; Watch: crime F, amenities F, commute F.
- Antioch Unified (suburban): math 29% / reading 55% proficiency, ranked #200 of 517 in CA (top 39%) — families likely to look elsewhere, expect single-tenant / working-renter base with shorter leases.
- Zoned schools: Marsh Elementary (530 students, 78% FRL); Park Middle (996 students, 85% FRL); Antioch High (math 22% / reading 57%, grade F, #532 of 1,170 statewide, top 48%, 1,960 students, 81% FRL) — zoned schools average 81% FRL vs 57% district-wide (24 pts higher); higher-poverty schools than district average — tighter screening recommended.
- Market conditions: Rents rising (+1.1%/yr); 212 active listings in the ZIP; 40 comparable units currently listed for rent nearby; rentals at typical pace (median 21d on market — plan ~3-4 weeks tenant-placement turnaround); solid renter incomes; 2,169 units permitted in Contra Costa County in 2024 (896 in 5+ unit buildings).
Forward outlook
- Local home prices are declining (-3.0%/yr); year-one equity from $2k of loan paydown is wiped out by about $7k of value loss. Plan a longer hold.
- Contra Costa County population projected at +26% by 2050 — long-run rental-demand tailwind backs the buy-and-hold thesis.
Negotiation context
- It's been on market 88 days — a 6% lower offer ($215k) is reasonable based on typical stale-listing flexibility.
- 6 sale attempts since 27y ago with the ask held roughly flat each time — persistent listings suggest the price (not the market) is what's stuck; bring a comps-based counter.
- Current owner paid $68k; list at $229k implies a 234% gain — meaningful room to come down on a strong offer.
Risks & watch-outs
- Watch-outs: HOA is 24% of rent.
- Climate carrying-cost: extreme-heat days projected 7→14/yr by 2055 (HVAC capex compounding) — expect insurance premiums to compound above CPI over the hold.
Questions for the listing agent
- What do current leases actually rent for vs. the listed asking? Can we see a recent rent roll and the last 12 months of T-12 income?
- It's been on market 88 days. Have you received any prior offers? Is the seller open to a 15% concession, seller financing, or rate buy-down credit?
- Built in 1979 — when were the roof, HVAC, electrical panel, plumbing, and water heater last replaced?
- What does the HOA fee cover, when was the last increase, and are there any pending special assessments or reserve-fund shortfalls?
- Any open or pending special assessments — roof, HVAC, plumbing, elevator, façade? What's the per-unit balance and payoff schedule, and is the seller paying it off at close or rolling it to the buyer?
- Why hasn't it sold? Are there any deal-killer items the seller is aware of (foundation, flood, title, zoning, code violations)?
- Is there a deadline driving the sale (1031 exchange, divorce, estate, relocation)? That informs how much negotiation room exists.
- Schools are F-rated, which usually means shorter tenancies and higher turnover. Who's the typical renter profile here, and what's been the actual vacancy rate?
- Crime grade is F in this area — have there been break-ins, vandalism, or insurance claims at this property in the last 3 years? What carrier currently insures it and at what premium?
- The area grade is low — what's the realistic commute time and amenity access for the typical tenant pool here? Any planned neighborhood developments (good or bad) we should know about?
- What's the average days-on-market for RENTAL listings here right now (not sales)? A rising rental-DOM trend means longer vacancies and softer asking-rent achievability than the comps imply.
- What's the recent tenant-quality profile in this submarket — average credit score on applications, eviction rate, late-payment / NSF rate, and stable-employment percentage? A property-management company in the area should have these aggregated.
- How much new apartment / multifamily construction is in the pipeline within 1–3 miles? Heavy new supply (>2% of stock underway) typically softens rents 12–24 months out; light construction supports rent growth.
Investment metrics
- 1% rule
- 0.93% ✗
- Cap rate
- 5.29%
- Cash-on-cash
- -3.59%
- DSCR
- 0.84
- GRM
- 8.9
CMA / ARV
- ARV (median comp)
- $258,926
- List price
- $229,000
- Delta
- -11.56%
- Verdict
- UNDERPRICED
- Comps
- 20 within 1.0 mi
Projected returns pro-forma
-3.0% appreciation · 1.09% rent growth · sell at horizon
- IRR
- -24.8%
- Equity multiple
- 0.17×
- Total profit
- $-53,144
- Equity at exit
- $34,145
- IRR
- -28.9%
- Equity multiple
- -0.20×
- Total profit
- $-77,060
- Equity at exit
- $19,800
Cash invested: $64,120 (down + closing). Projections, not guarantees.
Landlord ↔ Tenant lean methodology
- Overall (STATE)
- 18 Strongly Tenant-Friendly
- State California
- 18 Strongly Tenant-Friendly · D+13
- County
- — inherits STATE
- City
- — inherits STATE
ZIP-level market 94509
- Rents YoY
- 1.1%
- Active inventory
- 212
- Price-to-rent
- 8.9×
Monthly cashflow live
- Estimated rent
- $2,138 high interval (Pro) →
- Mortgage (P&I)
- −$1,201
- Tax from tax record
- −$65 /mo · $777/yr
- Insurance
- −$95
- HOA
- −$520
- Lot rent
- −$0
- Vacancy / Maint / Mgmt
- −$449
- Net cashflow
- $-192
Break-even live
Sensitivity live
| Price | -10% $-62 | -5% $-127 | +0% $-192 | +5% $-257 | +10% $-321 |
|---|---|---|---|---|---|
| Rent | -10% $-361 | -5% $-276 | +0% $-192 | +5% $-107 | +10% $-23 |
| Rate | -1.0pp $-77 | -0.5pp $-134 | base $-192 | +0.5pp $-251 | +1.0pp $-312 |
UW: 25.0% down · 7.5% · 30yr · 1.5% tax · 5.0% vac · 8.0% maint · 8.0% mgmt
Financing live
Cash to close
- Down payment
- $57,250
- Closing costs
- $6,870
- Reserves months
- —
- Total cash needed
- —
Loan-product check · same deal, 3 products live
Conventional
25% down · 7.5% · 30yr
- Down + closing
- —
- Monthly P&I
- —
- Monthly cashflow
- —
- DSCR
- —
- Eligible?
- —
Personal DTI + credit; lowest rate.
DSCR
20% down · 8.5% · 30yr
- Down + closing
- —
- Monthly P&I
- —
- Monthly cashflow
- —
- DSCR
- —
- Eligible?
- —
No personal income docs; deal must DSCR.
Hard money
10% down · 12.0% · 12mo
- Down + closing
- —
- Monthly P&I
- —
- Monthly cashflow
- —
- DSCR
- —
- Eligible?
- —
Short-term bridge; refi at stabilization.
Rent comps 40 comps
| Address | Beds | Baths | Sqft | Rent | $/sqft | DOM | Units | Dist |
|---|---|---|---|---|---|---|---|---|
| 2416 Shadow Ln Antioch, CA | 1.0 | 1.0 | 635 | $2,099 | $3.31 | 1d | 1 | 0.03mi |
| 2415 Horizon Ln #129 Antioch, CA | 2.0 | 2.0 | 944 | $2,800 | $2.97 | 46d | 1 | 0.09mi |
| 2400 Horizon Ln #140 Antioch, CA | 2.0 | 1.0 | 845 | $1,850 | $2.19 | 46d | 1 | 0.14mi |
| 2201 Sycamore Dr Antioch, CA | 1.0–3.0 | 1.0–2.0 | 1015 | $1,922 | $1.89 | 0d | 10 | 0.18mi |
| 2005 San Jose Dr Antioch, CA | 2.0 | 2.0 | 830 | $1,850 | $2.23 | 46d | 1 | 0.19mi |
| 2005 San Jose Dr Antioch, CA | 2.0 | 1.5–2.0 | 806 | $2,054 | $2.55 | 1d | 2 | 0.19mi |
| 2005 San Jose Dr Unit F130 Antioch, CA | 2.0 | 2.0 | 830 | $1,795 | $2.16 | 7d | 1 | 0.25mi |
| 1608 Sycamore Dr Apt 2 Antioch, CA | 2.0 | 1.0 | 900 | $2,150 | $2.39 | 7d | 1 | 0.26mi |
| 2308 Lemontree Way #4 Antioch, CA | 2.0 | 1.0 | 925 | $1,695 | $1.83 | 46d | 1 | 0.27mi |
| 2301 Sycamore Dr Antioch, CA | 1.0–2.0 | 1.0–1.5 | 716 | $2,180 | $3.04 | 0d | 23 | 0.29mi |
| 2725 Del Oro Cir Antioch, CA | 1.0 | 1.0 | 580 | $1,795 | $3.09 | 13d | 1 | 0.29mi |
| 2608 Nevada Ln Antioch, CA | 3.0 | 1.5 | 1056 | $2,450 | $2.32 | 46d | 1 | 0.29mi |
| 2200 Sycamore Dr Antioch, CA | 2.0 | 1.0–2.0 | 777 | $1,917 | $2.47 | 4d | 12 | 0.31mi |
| 2200 Sycamore Dr Antioch, CA | 2.0 | 1.0 | 755 | $1,815 | $2.40 | 12d | 1 | 0.31mi |
| 2500 Florida Ln Antioch, CA | 2.0 | 1.0 | 1000 | $2,395 | $2.40 | 46d | 1 | 0.32mi |
| 2104 Lemontree Way Antioch, CA | 2.0 | 1.0 | 822 | $1,695 | $2.06 | 46d | 1 | 0.33mi |
| 2201 San Jose Dr Antioch, CA | 1.0 | 1.0 | 612 | $1,658 | $2.71 | 1d | 2 | 0.35mi |
| 2205 Peppertree Way Antioch, CA | 2.0 | 1.0 | 903 | $1,695 | $1.88 | 17d | 1 | 0.37mi |
| 2106 Peppertree Way #3 Antioch, CA | 2.0 | 1.0 | 903 | $2,311 | $2.56 | 46d | 1 | 0.37mi |
| 2106 Peppertree Way Antioch, CA | 2.0 | 1.0 | 903 | $2,311 | $2.56 | 7d | 1 | 0.37mi |
| 1015 Fitzuren Rd Unit 2 Antioch, CA | 2.0 | 2.0 | 1035 | $2,500 | $2.42 | 46d | 1 | 0.48mi |
| 1015 Fitzuren Rd Unit 18 Antioch, CA | 2.0 | 2.0 | 1034 | $2,800 | $2.71 | 46d | 1 | 0.48mi |
| 1461 Aster Dr Antioch, CA | 2.0 | 1.0 | 900 | $1,795 | $1.99 | 46d | 1 | 0.60mi |
| 1461 Aster Dr Antioch, CA | 2.0 | 1.0 | 900 | $1,795 | $1.99 | 26d | 1 | 0.60mi |
| 1600 Aster Dr Antioch, CA | 1.0–3.0 | 1.0–2.0 | 838 | $2,564 | $3.06 | 0d | 8 | 0.64mi |
| 2800 Gentrytown Dr Antioch, CA | 1.0–2.0 | 1.0 | 725 | $1,845 | $2.54 | 0d | 8 | 0.75mi |
| 619 W 17th St Unit C Antioch, CA | 2.0 | 1.0 | 560 | $1,795 | $3.21 | 24d | 1 | 0.76mi |
| 2811 Cadiz Ln Antioch, CA | 1.0–2.0 | 1.0 | 715 | $1,962 | $2.74 | 24d | 1 | 0.77mi |
| 2811 Cadiz Ln Antioch, CA | 1.0–2.0 | 1.0–2.0 | 803 | $2,023 | $2.52 | 0d | 1 | 0.77mi |
| 712 O St Antioch, CA | 2.0 | 1.0 | 860 | $1,822 | $2.12 | 12d | 1 | 0.78mi |
| 616 1/2 W 16th St Antioch, CA | 2.0 | 1.0 | 646 | $1,950 | $3.02 | 4d | 1 | 0.81mi |
| 616 1/2 W 16th St Antioch, CA | 2.0 | 1.0 | 646 | $1,950 | $3.02 | 7d | 1 | 0.81mi |
| 400 Lawton St Antioch, CA | 2.0 | 1.0 | 750 | $1,850 | $2.47 | 1d | 1 | 0.87mi |
| 400 Lawton St Antioch, CA | 2.0 | 1.0 | 850 | $1,850 | $2.18 | 20d | 1 | 0.87mi |
| 370 Lawton St Unit Lawton-370B Antioch, CA | 2.0 | 1.0 | 950 | $2,099 | $2.21 | 46d | 1 | 0.91mi |
| 3417 Fairview Dr Antioch, CA | 2.0 | 1.0 | 800 | $1,710 | $2.14 | 1d | 2 | 0.92mi |
| 318 Lawton St Antioch, CA | 2.0 | 1.0 | 650 | $1,850 | $2.85 | 46d | 1 | 0.93mi |
| 318 Lawton St Antioch, CA | 2.0 | 1.0 | 650 | $1,850 | $2.85 | 26d | 1 | 0.93mi |
| 1017 H St Antioch, CA | 2.0 | 1.0 | 825 | $1,950 | $2.36 | 26d | 1 | 0.94mi |
| 3521 Fairview Dr Apt B Antioch, CA | 2.0 | 1.0 | 827 | $2,000 | $2.42 | 46d | 1 | 0.94mi |
HOA detail condo
- Monthly dues
- $520 · $6,240/yr
- Likely covers
- pool
- Assessments
- None detected in remarks — confirm with the listing agent.
Listing history 34 events
-
2026-06-22days on market $229,000 Active 88 DOM
-
2026-06-21days on market $229,000 Active 87 DOM
-
2026-06-18days on market $229,000 Active 84 DOM
-
2026-06-17days on market $229,000 Active 83 DOM
-
2026-06-16days on market $229,000 Active 82 DOM
-
2026-06-15days on market $229,000 Active 81 DOM
-
2026-06-13days on market $229,000 Active 79 DOM
-
2026-06-13days on market $229,000 Active 78 DOM
-
2026-06-09days on market $229,000 Active 75 DOM
-
2026-06-08days on market $229,000 Active 74 DOM
-
2026-06-07days on market $229,000 Active 73 DOM
-
2026-06-04days on market $229,000 Active 70 DOM
-
2026-06-03days on market $229,000 Active 69 DOM
-
2026-06-02days on market $229,000 Active 68 DOM
-
2026-06-01days on market $229,000 Active 67 DOM
-
2026-05-31days on market $229,000 Active 66 DOM
-
2026-05-07price $229,000 795-char remark
Show marketing remark (795 chars)
Welcome to your new home! This top-floor, 845-square-foot condo offers the perfect blend of comfort and convenience. Featuring two spacious bedrooms and one full bathroom, this unit has been recently upgraded with brand-new kitchen appliances, the unit includes a washer and dryer conveniently located in the unit! The open concept living area is perfect for both relaxation and entertaining, with plenty of natural light streaming through the sliders. You'll love the community amenities, including a sparkling pool where you can unwind on warm days. Plus, with easy access to the freeway, your daily commute is a breeze. Whether you're a first-time homebuyer or looking to downsize, this condo offers everything you need for comfortable living. Don't miss out on this fantastic opportunity!
-
2026-03-26$239,000 Active 795-char remark
Show marketing remark (795 chars)
Welcome to your new home! This top-floor, 845-square-foot condo offers the perfect blend of comfort and convenience. Featuring two spacious bedrooms and one full bathroom, this unit has been recently upgraded with brand-new kitchen appliances, the unit includes a washer and dryer conveniently located in the unit! The open concept living area is perfect for both relaxation and entertaining, with plenty of natural light streaming through the sliders. You'll love the community amenities, including a sparkling pool where you can unwind on warm days. Plus, with easy access to the freeway, your daily commute is a breeze. Whether you're a first-time homebuyer or looking to downsize, this condo offers everything you need for comfortable living. Don't miss out on this fantastic opportunity!
-
2025-01-28status Pending
-
2025-01-28historical
-
2025-01-06status Active
-
2025-01-02historical
-
2024-12-02price
-
2024-08-19Active
-
2008-11-26soldstatus $68,500 Sold
-
2008-10-01historical
-
2008-09-17$58,700
-
2005-06-17soldstatus $245,000
-
2005-06-10soldstatus $245,000
-
2005-05-26historical
-
2005-05-21$245,000
-
1999-09-22soldstatus $76,600
-
1999-08-17historical
-
1999-06-25$76,600
ⓘ Source: listings_history table (triggers on properties + properties_extension) + one-shot
backfill from property_details.listing_events for pre-trigger history.
Tax reassessment forecast CA · Resets to sale price
- Current annual tax
- $777 · $65/mo
- Projected year-2 tax
- $1,740 · $145/mo
- Expected delta
- +$963/yr (+$80/mo · 124.0%)
ⓘ Screening estimate from a state-policy table — verify with the county assessor before closing.
Climate risk First Street
- Flood 1/10 Low FEMA zone X (unshaded) · 0% chance over 30 yrs
- Wildfire 2/10 Low
- Heat 6/10 Major 7 d/yr ≥100°F today · 14 d/yr by 30 yrs out
- Wind 1/10 Low
- Air quality 9/10 Extreme 16 unhealthy d/yr today · 19 by 30 yrs out
Nearby sold comps map
Loading sold comps map…
Walkable amenities ~0.75 mi
Loading nearby amenities…
Taxation est. · year 1
- Rental income
- $25,659
- − Mortgage interest
- −$12,828
- − Property taxes
- −$777
- − Insurance
- −$1,145
- − Repairs & maintenance
- −$2,053
- − Management
- −$2,053
- − HOA
- −$6,240
- − Depreciation
- −$6,662
- Taxable loss
- −$6,098
- Est. tax savings @ 24.0%
- +$1,464
- After-tax cash flow
- $-839/yr
For passive investors: Depreciation is non-cash, so a rental often shows a tax loss while cash-flowing — sheltering income. Rental losses are passive: they offset passive income freely, and up to $25,000/yr can offset ordinary (W-2) income if you actively participate and your MAGI is under $100k (phasing out to $0 by $150k); unused losses carry forward. On sale, claimed depreciation is recaptured at up to 25%, and gains may owe capital-gains tax (a 1031 exchange can defer both). Figures are a year-1 estimate at your 24.0% rate — not tax advice; consult a CPA.
Schools (NCES district)
- District
- Antioch Unified
- NCES district ID
- 0602850
- Math proficiency
- 29% ▲ 12.00%
- Reading proficiency
- 55% ▲ 25.00%
- Median HH income
- $65,935
- Composite
- 37.57/100
- National rank
- #4386
- State rank
- #200 of 517 in CA
Livability — Antioch
- Score
- 56/100
- State rank
- #782
- US rank
- #22472
Category grades
Schools grade is shown separately in the Schools card above.
Census & demographics
- Census place
- Antioch, CA
- County
- Contra Costa County · 1,059,880 people
- City population
- 116,477
- Metro
- San Francisco-Oakland-Berkeley, CA
- Population (ZIP)
- 70,090
- Household income
- $86,196
- Rent vs Own
- Severe rent burden
- 3063.0
Population outlook (Contra Costa County) Hauer SSP2
- Today (2025)
- 1,287,720 people
- By 2030
- 1,364,937 · +6.0%
- By 2040
- 1,506,209 · +17.0%
- By 2050
- 1,624,373 · +26.1%
- By 2075
- 1,853,193 · +43.9%
- By 2100
- 1,901,231 · +47.6%
Race, ethnicity, and origin ACS 2023
- Neighborhood character
- Highly diverse neighborhood (Simpson 0.72)
- Race & ethnicity
- Hispanic / Latino 43% White 25% Two or more races 18% Black 16% Asian 9% Native American 2% Pacific Islander 2%
- Hispanic origin (detail)
- Mexican 30%
- Common ancestry
- Russian 2% Italian 2% Lithuanian 1%
- Foreign-born
- 23% · Canada, China, Vietnam
- Languages at home
- 62% English-only · Spanish 29% Tagalog/Filipino 3% Other Asian/Pacific 1%
Political lean MEDSL · Contra Costa
- 2024 margin
- Solid D (+38.0) · D 67.3% · R 29.4% · Other 3.3%
- 2008→2024 swing
- +0.2pp no change · 2008: 37.8pp · 2024: 38.0pp
- All cycles
- 2024: D+38.0 2020: D+45.3 2016: D+43.5 2012: D+33.7 2008: D+37.8
Not yet ingested
- Civics
- —
Market trends
- HPI YoY
- ▼ -477.30%
- Current HPI
- 309.3499
- Rent YoY
- ▲ 1.09%
- Metro
- San Francisco-Oakland-Berkeley, CA
- State GDP YoY
- ▲ 3.21%
- F500 in state
- 116
Industry mix (Fortune 500 HQ in CA)
| Industry | F500 HQs | Revenue |
|---|---|---|
| Technology | 27 | $1,492B |
|
||
| Financial Services | 3 | $174B |
|
||
| Retail | 3 | $44B |
|
||
| Insurance | 3 | $26B |
|
||
| Media / Entertainment | 2 | $115B |
|
||
| Pharmaceuticals / Biotech | 2 | $62B |
|
||
Price history
+199.0% since first listed18 events — show timeline
- 2026-05-07 Price Changed $229,000 bridgeMLS, Bay East AOR, or Contra Costa AOR
- 2026-03-26 Listed $239,000 bridgeMLS, Bay East AOR, or Contra Costa AOR
- 2025-01-28 Pending — bridgeMLS, Bay East AOR, or Contra Costa AOR
- 2025-01-28 Listing Removed — bridgeMLS, Bay East AOR, or Contra Costa AOR
- 2025-01-06 Relisted — bridgeMLS, Bay East AOR, or Contra Costa AOR
- 2025-01-02 Listing Removed — bridgeMLS, Bay East AOR, or Contra Costa AOR
- 2024-12-02 Price Changed — bridgeMLS, Bay East AOR, or Contra Costa AOR
- 2024-08-19 Listed — bridgeMLS, Bay East AOR, or Contra Costa AOR
- 2008-11-26 Sold (MLS) $68,500 bridgeMLS, Bay East AOR, or Contra Costa AOR
- 2008-10-01 Listing Removed — bridgeMLS, Bay East AOR, or Contra Costa AOR
- 2008-09-17 Listed $58,700 bridgeMLS, Bay East AOR, or Contra Costa AOR
- 2005-06-17 Sold (MLS) $245,000 bridgeMLS, Bay East AOR, or Contra Costa AOR
- 2005-06-10 Sold (Public Records) $245,000 Public Records
- 2005-05-26 Listing Removed — bridgeMLS, Bay East AOR, or Contra Costa AOR
- 2005-05-21 Listed $245,000 bridgeMLS, Bay East AOR, or Contra Costa AOR
- 1999-09-22 Sold (MLS) $76,600 bridgeMLS, Bay East AOR, or Contra Costa AOR
- 1999-08-17 Listing Removed — bridgeMLS, Bay East AOR, or Contra Costa AOR
- 1999-06-25 Listed $76,600 bridgeMLS, Bay East AOR, or Contra Costa AOR
Property tax history
-3.4%/yrLatest (2025): $777 · +3.9% YoY. Source: county tax records.
Cash-flow waterfall
monthlySold comps — $/sqft
last 12 mo · ≤1 miLoading sold comps…