8512 144th Ave E #44 · Alderton, WA
Flood risk 6/10 · Moderate
- FEMA flood zone
- X (unshaded)
- Chance of flooding over 30 yrs
- 0.75%
- Est. flood insurance / yr
- $507 – $1,088
Fire risk 3/10 · Minor
- Est. fire insurance / yr
- $604 – $1,122
Heat risk 3/10 · Minor
- Hot days now (above 88°F)
- 7 days/yr
- Hot days in 30 yrs
- 16 days/yr
Wind risk 1/10 · Minimal
- Chance of severe wind over 30 yrs
- —
Air-quality risk 7/10 · Major
- Unhealthy air days now
- 9 days/yr
- Unhealthy air days in 30 yrs
- 11 days/yr
Risk factors via First Street. Map © Google.
Why this score? — see what drove the A- grade
The composite is a weighted blend of 9 inputs, each scored 0–100. Each bar is that input's sub-score; the figure is the points it added to the 100-point composite (weight × sub-score).
- Cash flow +30.0/30.0
- ARV discount +15.0/15.0
- 1% rule +10.0/10.0
- DSCR +10.0/10.0
- Schools +6.2/10.0
- Condition / age +4.0/5.0
- Rent growth +3.6/5.0
- Livability +3.4/5.0
- Appreciation +0.0/10.0
$180,000
🖨 Deal sheet 📄 Offer letter ✓ Due diligence
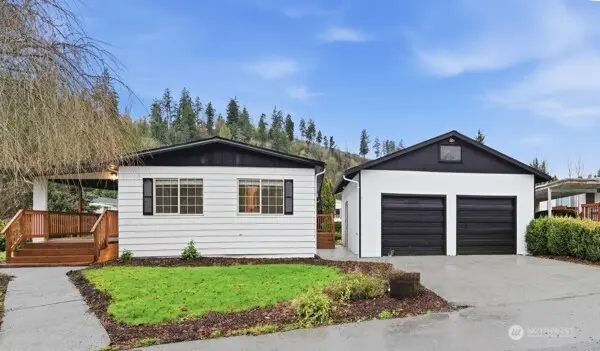
Listing remarks
Beautifully remodeled home in desirable Lone Cedar Community! This community is 80/20 community meaning 80% of the residents are 55+ and 20% can be under 55 of age. This spacious residence features two large living room with a fireplace, offering exceptional flexibility and comfort. Enjoy relaxing on the private deck with a stunning views of Mount Rainier, plus the convenience of a two-car garage. Move in ready with modern updates through out and located close to shopping, dining and major routes.
Key facts
- Private deck
- Two car garage
- Remodeled home
Tags
Neighborhood map
What this means for you Summary
Snapshot
- This is a 3-bed/2.0-bath manufactured listed at $180k. Condition is rated good.
Deal economics
- At list price, monthly cash flow is $950 ($11k/yr) — positive.
- The deal already cash-flows at list — no discount required.
- Meets the 1% rule at list price ($3k rent vs $180k).
- Recommended offer: $158k (12.0% below list) — sets the bar for market timing.
- Cap rate 12.6% vs local median 2.5% in Alderton — top-decile yield for the area; either an underpriced asset or a hidden risk that comps aren't pricing in. Stress-test before assuming the spread holds.
Location & tenants
- Location reads 68/100 on livability (#269 in WA) — a middle-class / working-renter tenant base. Strengths: crime A+, employment A+, housing A+; Watch: schools F, amenities F, commute F.
- Sumner School District (suburban): math 64% / reading 73% proficiency, ranked #18 of 291 in WA (top 6%) — acceptable for families but not a draw, mixed tenant base, ~2y average lease.
- Market conditions: Rents rising fast (+4.5%/yr); 167 active listings in the ZIP; 2 comparable units currently listed for rent nearby; solid renter incomes; 3,209 units permitted in Pierce County in 2024 (1,269 in 5+ unit buildings).
- This rent runs 34% of the median local income ($98k/yr) — at the standard rent-burdened threshold; future hikes will face affordability resistance.
Forward outlook
- Local home prices are declining (-3.0%/yr); year-one equity from $1k of loan paydown is wiped out by about $5k of value loss. Plan a longer hold.
- Pierce County population projected at +26% by 2050 — long-run rental-demand tailwind backs the buy-and-hold thesis.
- At projected returns (-3.0% appreciation + 4.5% rent growth), your $50k cash investment doubles in ~6 years — after that, you're playing with house money.
Negotiation context
- It's been on market 163 days — a 12% lower offer ($158k) is reasonable based on typical stale-listing flexibility.
- 2 sale attempts with the ask held roughly flat each time — persistent listings suggest the price (not the market) is what's stuck; bring a comps-based counter.
- Current owner paid $50k; list at $180k implies a 260% gain — meaningful room to come down on a strong offer.
Risks & watch-outs
- Climate carrying-cost: major flood risk — expect insurance premiums to compound above CPI over the hold.
Questions for the listing agent
- It's been on market 163 days. Have you received any prior offers? Is the seller open to a 12% concession, seller financing, or rate buy-down credit?
- Built in 1977 — when were the roof, HVAC, electrical panel, plumbing, and water heater last replaced?
- Why hasn't it sold? Are there any deal-killer items the seller is aware of (foundation, flood, title, zoning, code violations)?
- Is there a deadline driving the sale (1031 exchange, divorce, estate, relocation)? That informs how much negotiation room exists.
- Schools are F-rated, which usually means shorter tenancies and higher turnover. Who's the typical renter profile here, and what's been the actual vacancy rate?
- What's the average days-on-market for RENTAL listings here right now (not sales)? A rising rental-DOM trend means longer vacancies and softer asking-rent achievability than the comps imply.
- What's the recent tenant-quality profile in this submarket — average credit score on applications, eviction rate, late-payment / NSF rate, and stable-employment percentage? A property-management company in the area should have these aggregated.
- How much new for-sale + rental construction is in the pipeline within 1–3 miles? Heavy new supply typically softens prices + rents 12–24 months out; constrained supply supports both.
Investment metrics
- 1% rule
- 1.54% ✓
- Cap rate
- 12.63%
- Cash-on-cash
- 22.63%
- DSCR
- 2.01
- GRM
- 5.4
CMA / ARV
- ARV (median comp)
- $309,255
- List price
- $180,000
- Delta
- -41.80%
- Verdict
- UNDERPRICED
- Comps
- 1 within 2.0 mi
Projected returns pro-forma
-3.0% appreciation · 4.46% rent growth · sell at horizon
- IRR
- 17.2%
- Equity multiple
- 1.71×
- Total profit
- $35,541
- Equity at exit
- $26,839
- IRR
- 26.7%
- Equity multiple
- 3.51×
- Total profit
- $126,557
- Equity at exit
- $15,563
Cash invested: $50,400 (down + closing). Projections, not guarantees.
Landlord ↔ Tenant lean methodology
- Overall (STATE)
- 28 Tenant-Leaning
- State Washington
- 28 Tenant-Leaning · D+8
- County
- — inherits STATE
- City
- — inherits STATE
ZIP-level market 98372
- Rents YoY
- 4.5%
- Active inventory
- 167
- Price-to-rent
- 5.4×
Monthly cashflow live
- Estimated rent
- $2,778 medium interval (Pro) →
- Mortgage (P&I)
- −$944
- Tax est. 1.5%
- −$225 /mo · $2,700/yr
- Insurance
- −$75
- HOA
- −$0
- Vacancy / Maint / Mgmt
- −$583
- Net cashflow
- $950
Break-even live
UW: 25.0% down · 7.5% · 30yr · 1.5% tax · 5.0% vac · 8.0% maint · 8.0% mgmt
Financing live
Cash to close
- Down payment
- $45,000
- Closing costs
- $5,400
- Reserves months
- —
- Total cash needed
- —
Loan-product check · same deal, 3 products live
Conventional
25% down · 7.5% · 30yr
- Down + closing
- —
- Monthly P&I
- —
- Monthly cashflow
- —
- DSCR
- —
- Eligible?
- —
Personal DTI + credit; lowest rate.
DSCR
20% down · 8.5% · 30yr
- Down + closing
- —
- Monthly P&I
- —
- Monthly cashflow
- —
- DSCR
- —
- Eligible?
- —
No personal income docs; deal must DSCR.
Hard money
10% down · 12.0% · 12mo
- Down + closing
- —
- Monthly P&I
- —
- Monthly cashflow
- —
- DSCR
- —
- Eligible?
- —
Short-term bridge; refi at stabilization.
Rent comps 2 comps
| Address | Beds | Baths | Sqft | Rent | $/sqft | DOM | Units | Dist |
|---|---|---|---|---|---|---|---|---|
| 3114 Highlands Blvd Puyallup, WA | 3.0 | 2.5 | 1905 | $3,300 | $1.73 | 18d | 1 | 0.71mi |
| 3107 E Main Ave Puyallup, WA | 1.0–3.0 | 1.0–2.0 | 963 | $2,622 | $2.72 | 2d | 30 | 1.32mi |
Listing history 17 events
-
2026-06-18days on market $180,000 Active 163 DOM
-
2026-06-17days on market $180,000 Active 162 DOM
-
2026-06-16days on market $180,000 Active 161 DOM
-
2026-06-15days on market $180,000 Active 160 DOM
-
2026-06-13days on market $180,000 Active 158 DOM
-
2026-06-09days on market $180,000 Active 154 DOM
-
2026-06-08days on market $180,000 Active 153 DOM
-
2026-06-07days on market $180,000 Active 152 DOM
-
2026-06-04days on market $180,000 Active 149 DOM
-
2026-06-03days on market $180,000 Active 148 DOM
-
2026-06-02days on market $180,000 Active 147 DOM
-
2026-06-01days on market $180,000 Active 146 DOM
-
2026-05-31days on market $180,000 Active 145 DOM
-
2026-01-06$180,000 Active
-
2025-04-30soldstatus $50,000 Closed
-
2025-04-14status Pending
-
2025-04-04$50,000 Active
ⓘ Source: listings_history table (triggers on properties + properties_extension) + one-shot
backfill from property_details.listing_events for pre-trigger history.
Climate risk First Street
- Flood 6/10 Major FEMA zone X (unshaded) · 75% chance over 30 yrs
- Wildfire 3/10 Moderate
- Heat 3/10 Moderate 7 d/yr ≥88°F today · 16 d/yr by 30 yrs out
- Wind 1/10 Low
- Air quality 7/10 Severe 9 unhealthy d/yr today · 11 by 30 yrs out
Nearby sold comps map
Loading sold comps map…
Walkable amenities ~0.75 mi
Loading nearby amenities…
Taxation est. · year 1
- Rental income
- $33,331
- − Mortgage interest
- −$10,083
- − Property taxes
- −$2,700
- − Insurance
- −$900
- − Repairs & maintenance
- −$2,666
- − Management
- −$2,666
- − Depreciation
- −$5,236
- Taxable income
- $9,079
- Est. tax owed @ 24.0%
- −$2,179
- After-tax cash flow
- $9,225/yr
For passive investors: Depreciation is non-cash, so a rental often shows a tax loss while cash-flowing — sheltering income. Rental losses are passive: they offset passive income freely, and up to $25,000/yr can offset ordinary (W-2) income if you actively participate and your MAGI is under $100k (phasing out to $0 by $150k); unused losses carry forward. On sale, claimed depreciation is recaptured at up to 25%, and gains may owe capital-gains tax (a 1031 exchange can defer both). Figures are a year-1 estimate at your 24.0% rate — not tax advice; consult a CPA.
Condition & rehab AI · 12 photos
This beautifully remodeled home in Lone Cedar Community is move-in ready with modern updates throughout. It offers spacious living areas, a two-car garage, and a private deck with stunning views of Mount Rainier.
Value-add opportunities
- Resale Paint exterior siding — Enhances curb appeal and property value
- Resale Replace carpet in bedrooms — Improves comfort and appearance
- Rental Clean and maintain HVAC system — Ensures comfort and energy efficiency
Renovation cost estimate screening
Value-add ROI direction
- Resale Paint exterior siding — Enhances curb appeal and property value ↑
- Resale Replace carpet in bedrooms — Improves comfort and appearance ↑
- Rental Clean and maintain HVAC system — Ensures comfort and energy efficiency ↑
ⓘ Cost ranges are severity-bucket heuristics (US national rule-of-thumb). Get contractor quotes + a written scope before underwriting a rehab budget.
Schools (NCES district)
- District
- Sumner School District
- NCES district ID
- 5308610
- Math proficiency
- 64% ▲ 1.00%
- Reading proficiency
- 73% ▬ 0.00%
- Median HH income
- $76,138
- Composite
- 61.86/100
- National rank
- #1497
- State rank
- #18 of 291 in WA
Livability — Alderton
- Score
- 68/100
- State rank
- #269
- US rank
- #9357
Category grades
Schools grade is shown separately in the Schools card above.
Census & demographics
- Census place
- Alderton, WA
- County
- Pierce County · 788,257 people
- Metro
- Seattle-Tacoma-Bellevue, WA
- Population (ZIP)
- 26,012
- Household income
- $98,152
- Rent vs Own
- Severe rent burden
- 871.0
Population outlook (Pierce County) Hauer SSP2
- Today (2025)
- 956,648 people
- By 2030
- 1,010,862 · +5.7%
- By 2040
- 1,113,170 · +16.4%
- By 2050
- 1,206,524 · +26.1%
- By 2075
- 1,436,425 · +50.2%
- By 2100
- 1,563,654 · +63.5%
Race, ethnicity, and origin ACS 2023
- Neighborhood character
- Predominantly White (73%)
- Race & ethnicity
- White 73% Two or more races 10% Hispanic / Latino 8% Asian 6% Black 3% Pacific Islander 1%
- Hispanic origin (detail)
- Mexican 5% Puerto Rican 1%
- Common ancestry
- Lithuanian 4% Romanian 4% Subsaharan African 3%
- Foreign-born
- 13% · Canada, South Korea, China
- Languages at home
- 81% English-only · Russian/Polish/Slavic 5% Spanish 4% Other Asian/Pacific 3%
Political lean MEDSL · Pierce
- 2024 margin
- D (+10.8) · D 53.9% · R 43.1% · Other 3.0%
- 2008→2024 swing
- -1.4pp toward R · 2008: 12.2pp · 2024: 10.8pp
- All cycles
- 2024: D+10.8 2020: D+11.2 2016: D+7.5 2012: D+11.0 2008: D+12.2
Not yet ingested
- Civics
- —
Market trends
- HPI YoY
- ▼ -283.81%
- Current HPI
- 309.7871
- Rent YoY
- ▲ 4.46%
- Metro
- Seattle-Tacoma-Bellevue, WA
- State GDP YoY
- ▲ 4.65%
- F500 in state
- 22
Industry mix (Fortune 500 HQ in WA)
| Industry | F500 HQs | Revenue |
|---|---|---|
| Retail | 2 | $269B |
|
||
| Technology / Retail | 1 | $638B |
|
||
| Technology | 1 | $245B |
|
||
| Telecommunications | 1 | $38B |
|
||
| Food / Beverage | 1 | $36B |
|
||
| Automotive / Trucks | 1 | $34B |
|
||
Price history
+260.0% since first listed4 events — show timeline
- 2026-01-06 Listed $180,000 NWMLS as Distributed by MLS Grid
- 2025-04-30 Sold (MLS) $50,000 NWMLS as Distributed by MLS Grid
- 2025-04-14 Pending — NWMLS as Distributed by MLS Grid
- 2025-04-04 Listed $50,000 NWMLS as Distributed by MLS Grid
Cash-flow waterfall
monthlySold comps — $/sqft
last 12 mo · ≤1 miLoading sold comps…