 🏗️ New Construction
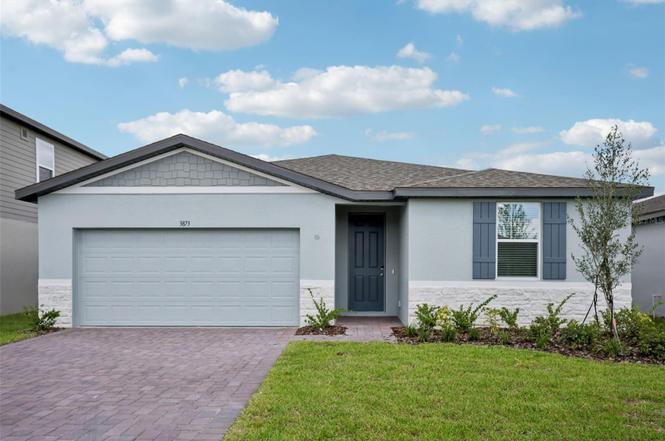
3873 Giorgio Dr · Winter Haven, FL
Flood risk No data
- FEMA flood zone
- —
- Chance of flooding over 30 yrs
- —
- Est. flood insurance / yr
- —
Fire risk No data
- Est. fire insurance / yr
- —
Heat risk No data
- Hot days now (above threshold)
- —
- Hot days in 30 yrs
- —
Wind risk No data
- Chance of severe wind over 30 yrs
- —
Air-quality risk No data
- Unhealthy air days now
- —
- Unhealthy air days in 30 yrs
- —
Risk factors via First Street. Map © Google.
Why this score? — see what drove the D- grade
The composite is a weighted blend of 9 inputs, each scored 0–100. Each bar is that input's sub-score; the figure is the points it added to the 100-point composite (weight × sub-score).
- Cash flow +11.6/30.0
- ARV discount +7.5/15.0
- Livability +3.7/5.0
- Schools +3.5/10.0
- DSCR +3.4/10.0
- 1% rule +3.0/10.0
- Rent growth +3.0/5.0
- Condition / age +2.5/5.0
- Appreciation +0.0/10.0
$274,990
🖨 Deal sheet 📄 Offer letter ✓ Due diligence
Listing remarks
Under Construction. Brand new, energy-efficient home available by Aug 2025! Open floor plan creates a unified living space with a large great room that overlooks the kitchen. Visit Villamar and explore new single-family homes for sale in Winter Haven, FL. Residents will have access to two resort-style amenity centers featuring a clubhouse, pool, and playground. Winter Haven is known for its beautiful chain of lakes with lakeside restaurants and its award-winning community theater. Nearby attractions include Legoland Florida and Peppa Pig Theme Park. A brand-new model and new phase are coming soon. Each of our homes is built with innovative, energy-efficient features designed to help you enj
Key facts
- Open floor plan
- Amenity centers
- Clubhouse
Tags
Neighborhood map
What this means for you Summary
Snapshot
- This is a 4-bed/3.0-bath land listed at $275k.
Deal economics
- At list price, monthly cash flow is $-85 ($-1k/yr) — negative.
- To cash-flow at today's rent, offer at most $260k (5.5% below list).
- To meet the 1% rule (rent ≥ 1% of price), the offer needs to be $221k (19.8% below list).
- Recommended offer: $221k (19.8% below list) — sets the bar for 1% rule.
Location & tenants
- Location reads 74/100 on livability (#291 in FL, #4,898 nationally) — a middle-class / working-renter tenant base. Strengths: cost of living A+, housing A+, health & safety A; Watch: employment C-, amenities F, commute F.
- Polk (suburban): math 39% / reading 43% proficiency, ranked #62 of 73 in FL (top 85%) — families likely to look elsewhere, expect single-tenant / working-renter base with shorter leases.
- Zoned schools: Chain of Lakes Elementary School (math 63% / reading 60%, grade B, #634 of 2,144 statewide, top 30%, 1,130 students, 37% FRL); Lake Region High School (math 14% / reading 22%, grade F, #570 of 667 statewide, top 86%, 1,545 students, 61% FRL).
- Market conditions: Rents rising (+1.9%/yr); 680 active listings in the ZIP; 32 comparable units currently listed for rent nearby; rentals at typical pace (median 24d on market — plan ~3-4 weeks tenant-placement turnaround); 10,384 units permitted in Polk County in 2024 (1,716 in 5+ unit buildings).
- This rent runs 38% of the median local income ($70k/yr) — at the standard rent-burdened threshold; future hikes will face affordability resistance.
Forward outlook
- Local home prices are declining (-3.0%/yr); year-one equity from $2k of loan paydown is wiped out by about $8k of value loss. Plan a longer hold.
- Polk County population projected at +33% by 2050 — long-run rental-demand tailwind backs the buy-and-hold thesis.
Negotiation context
- It's been on market 268 days — a 12% lower offer ($242k) is reasonable based on typical stale-listing flexibility.
Questions for the listing agent
- What do current leases actually rent for vs. the listed asking? Can we see a recent rent roll and the last 12 months of T-12 income?
- It's been on market 268 days. Have you received any prior offers? Is the seller open to a 20% concession, seller financing, or rate buy-down credit?
- What does the HOA fee cover, when was the last increase, and are there any pending special assessments or reserve-fund shortfalls?
- Why hasn't it sold? Are there any deal-killer items the seller is aware of (foundation, flood, title, zoning, code violations)?
- Is there a deadline driving the sale (1031 exchange, divorce, estate, relocation)? That informs how much negotiation room exists.
- The area grade is low — what's the realistic commute time and amenity access for the typical tenant pool here? Any planned neighborhood developments (good or bad) we should know about?
- What's the average days-on-market for RENTAL listings here right now (not sales)? A rising rental-DOM trend means longer vacancies and softer asking-rent achievability than the comps imply.
- What's the recent tenant-quality profile in this submarket — average credit score on applications, eviction rate, late-payment / NSF rate, and stable-employment percentage? A property-management company in the area should have these aggregated.
- How much new for-sale + rental construction is in the pipeline within 1–3 miles? Heavy new supply typically softens prices + rents 12–24 months out; constrained supply supports both.
Investment metrics
- 1% rule
- 0.80% ✗
- Cap rate
- 5.92%
- Cash-on-cash
- -1.32%
- DSCR
- 0.94
- GRM
- 10.4
CMA / ARV
No comps found within radius.
Projected returns pro-forma
-3.0% appreciation · 1.9% rent growth · sell at horizon
- IRR
- -19.7%
- Equity multiple
- 0.32×
- Total profit
- $-52,398
- Equity at exit
- $41,002
- IRR
- -14.9%
- Equity multiple
- 0.19×
- Total profit
- $-62,336
- Equity at exit
- $23,776
Cash invested: $76,997 (down + closing). Projections, not guarantees.
Landlord ↔ Tenant lean methodology
- Overall (STATE)
- 87 Strongly Landlord-Friendly
- State Florida
- 87 Strongly Landlord-Friendly · R+3
- County
- — inherits STATE
- City
- — inherits STATE
ZIP-level market 33884
- Home prices YoY
- -34.1%
- Rents YoY
- 1.9%
- Active inventory
- 680
- Price-to-rent
- 10.4×
Monthly cashflow live
- Estimated rent
- $2,206 high interval (Pro) →
- Mortgage (P&I)
- −$1,442
- Tax from tax record
- −$256 /mo · $3,073/yr
- Insurance
- −$115
- HOA
- −$15
- Vacancy / Maint / Mgmt
- −$463
- Net cashflow
- $-85
Break-even live
UW: 25.0% down · 7.5% · 30yr · 1.5% tax · 5.0% vac · 8.0% maint · 8.0% mgmt
Financing live
Cash to close
- Down payment
- $68,748
- Closing costs
- $8,250
- Reserves months
- —
- Total cash needed
- —
Loan-product check · same deal, 3 products live
Conventional
25% down · 7.5% · 30yr
- Down + closing
- —
- Monthly P&I
- —
- Monthly cashflow
- —
- DSCR
- —
- Eligible?
- —
Personal DTI + credit; lowest rate.
DSCR
20% down · 8.5% · 30yr
- Down + closing
- —
- Monthly P&I
- —
- Monthly cashflow
- —
- DSCR
- —
- Eligible?
- —
No personal income docs; deal must DSCR.
Hard money
10% down · 12.0% · 12mo
- Down + closing
- —
- Monthly P&I
- —
- Monthly cashflow
- —
- DSCR
- —
- Eligible?
- —
Short-term bridge; refi at stabilization.
Rent comps 32 comps
| Address | Beds | Baths | Sqft | Rent | $/sqft | DOM | Units | Dist |
|---|---|---|---|---|---|---|---|---|
| 4981 Kaia Ave Winter Haven, FL | 3.0 | 2.0 | 1269 | $1,875 | $1.48 | 19d | 1 | 0.02mi |
| 4973 Kaia Ave Winter Haven, FL | 3.0 | 2.0 | 1483 | $1,900 | $1.28 | 3d | 1 | 0.03mi |
| 3889 Giorgio Dr Winter Haven, FL | 3.0 | 2.0 | 1483 | $2,000 | $1.35 | 23d | 1 | 0.03mi |
| 3912 Giorgio Dr Winter Haven, FL | 3.0 | 2.0 | 1483 | $1,900 | $1.28 | 21d | 1 | 0.05mi |
| 3905 Giorgio Dr Winter Haven, FL | 3.0 | 2.0 | 1707 | $2,050 | $1.20 | 3d | 1 | 0.06mi |
| 3916 Giorgio Dr Winter Haven, FL | 3.0 | 2.0 | 1280 | $1,695 | $1.32 | 3d | 1 | 0.06mi |
| 6472 Domizio Dr Winter Haven, FL | 5.0 | 2.5 | 2112 | $2,300 | $1.09 | 23d | 1 | 0.12mi |
| 6428 Domizio Dr Winter Haven, FL | 5.0 | 2.5 | 2112 | $2,200 | $1.04 | 23d | 1 | 0.16mi |
| 3436 Costello Cir Winter Haven, FL | 3.0 | 2.0 | 1504 | $1,750 | $1.16 | 3d | 1 | 0.16mi |
| 3511 Costello Cir Winter Haven, FL | 4.0 | 2.0 | 2234 | $2,100 | $0.94 | 23d | 1 | 0.17mi |
| 3412 Costello Cir Winter Haven, FL | 5.0 | 3.0 | 2540 | $2,500 | $0.98 | 23d | 1 | 0.20mi |
| 6204 Botticella Blvd Winter Haven, FL | 5.0 | 2.5 | 2280 | $2,350 | $1.03 | 3d | 1 | 0.22mi |
| 2772 San Marco Way Winter Haven, FL | 4.0 | 3.0 | 1988 | $2,200 | $1.11 | 23d | 1 | 0.31mi |
| 4506 Rapallo Ave Winter Haven, FL | 4.0 | 2.0 | 1754 | $1,899 | $1.08 | 23d | 1 | 0.32mi |
| 4458 Rapallo Ave Winter Haven, FL | 3.0 | 2.5 | 1568 | $2,000 | $1.28 | 23d | 1 | 0.36mi |
| 4442 Rapallo Ave Winter Haven, FL | 4.0 | 2.0 | 1607 | $1,895 | $1.18 | 23d | 1 | 0.38mi |
| 3063 Laurel Oak Ln Winter Haven, FL | 3.0 | 2.0 | 1269 | $1,695 | $1.34 | 14d | 1 | 0.46mi |
| 3063 Laurel Oak Ln Winter Haven, FL | 3.0 | 2.0 | 1269 | $1,695 | $1.34 | 23d | 1 | 0.46mi |
| 2107 Cartgate Ln Winter Haven, FL | 4.0 | 3.0 | 2217 | $2,600 | $1.17 | 23d | 1 | 0.55mi |
| 2116 Cartgate Ln Winter Haven, FL | 4.0 | 3.0 | 2217 | $2,500 | $1.13 | 23d | 1 | 0.56mi |
| 1734 Carnostie Rd Winter Haven, FL | 3.0 | 2.0 | 1418 | $2,050 | $1.45 | 23d | 1 | 0.57mi |
| 1735 Carnostie Rd Winter Haven, FL | 3.0 | 2.0 | 1515 | $1,900 | $1.25 | 23d | 1 | 0.58mi |
| 632 Vittorio Dr Winter Haven, FL | 4.0 | 2.0 | 1597 | $1,895 | $1.19 | 23d | 1 | 0.65mi |
| 1310 Benevento Dr Winter Haven, FL | 4.0 | 2.0 | 1964 | $2,500 | $1.27 | 23d | 1 | 0.68mi |
| 1343 Benevento Dr Winter Haven, FL | 4.0 | 2.0 | 1849 | $2,000 | $1.08 | 14d | 1 | 0.69mi |
| 1002 Corso Dr Winter Haven, FL | 3.0 | 2.0 | 1545 | $1,945 | $1.26 | 23d | 1 | 0.73mi |
| 397 Corso Loop Winter Haven, FL | 4.0 | 2.0 | 1851 | $2,395 | $1.29 | 3d | 1 | 0.86mi |
| 850 Terranova Rd Winter Haven, FL | 4.0 | 2.0 | 1770 | $2,176 | $1.23 | 3d | 1 | 0.96mi |
| 810 Terranova Rd Winter Haven, FL | 4.0 | 2.0 | 2056 | $1,900 | $0.92 | 23d | 1 | 0.97mi |
| 554 Reddicks Cir Winter Haven, FL | 4.0 | 2.0 | 2000 | $2,000 | $1.00 | 10d | 1 | 1.06mi |
| 670 Eagle Landing Blvd Winter Haven, FL | 3.0 | 2.0 | 1480 | $1,999 | $1.35 | 3d | 1 | 1.17mi |
| 219 Cloverdale Rd Winter Haven, FL | 4.0 | 2.0 | 1858 | $2,300 | $1.24 | 23d | 1 | 1.47mi |
HOA detail
- Monthly dues
- $15 · $180/yr
- Likely covers
- pool
Listing history 16 events
-
2026-06-13statusdays on market $274,990 Pending 268 DOM
-
2026-06-10days on market $274,990 Active 267 DOM
-
2026-06-09days on market $274,990 Active 266 DOM
-
2026-06-08days on market $274,990 Active 265 DOM
-
2026-06-07days on market $274,990 Active 264 DOM
-
2026-06-05days on market $274,990 Active 261 DOM
-
2026-06-03days on market $274,990 Active 259 DOM
-
2026-06-02status $274,990 Active 258 DOM
-
2026-04-06status Pending
-
2026-04-02price $274,990
-
2026-03-21price $289,990
-
2026-02-19price $299,990
-
2025-11-04price $317,390
-
2025-09-15price $314,390
-
2025-08-13price $317,390
-
2025-07-22$342,390 Active
ⓘ Source: listings_history table (triggers on properties + properties_extension) + one-shot
backfill from property_details.listing_events for pre-trigger history.
Tax reassessment forecast FL · Resets to sale price
- Current annual tax
- $3,073 · $256/mo
- Projected year-2 tax
- $3,073 · $256/mo
- Expected delta
- $0/yr ($0/mo · 0.0%)
ⓘ Screening estimate from a state-policy table — verify with the county assessor before closing.
Nearby sold comps map
Loading sold comps map…
Walkable amenities ~0.75 mi
Loading nearby amenities…
Taxation est. · year 1
- Rental income
- $26,473
- − Mortgage interest
- −$15,404
- − Property taxes
- −$3,073
- − Insurance
- −$1,375
- − Repairs & maintenance
- −$2,118
- − Management
- −$2,118
- − HOA
- −$180
- − Depreciation
- −$8,000
- Taxable loss
- −$5,794
- Est. tax savings @ 24.0%
- +$1,391
- After-tax cash flow
- $371/yr
For passive investors: Depreciation is non-cash, so a rental often shows a tax loss while cash-flowing — sheltering income. Rental losses are passive: they offset passive income freely, and up to $25,000/yr can offset ordinary (W-2) income if you actively participate and your MAGI is under $100k (phasing out to $0 by $150k); unused losses carry forward. On sale, claimed depreciation is recaptured at up to 25%, and gains may owe capital-gains tax (a 1031 exchange can defer both). Figures are a year-1 estimate at your 24.0% rate — not tax advice; consult a CPA.
Schools (NCES district)
- District
- Polk
- NCES district ID
- 1201590
- Math proficiency
- 39% ▼ -11.00%
- Reading proficiency
- 43% ▼ -4.00%
- Median HH income
- $43,979
- Composite
- 34.74/100
- National rank
- #5132
- State rank
- #62 of 73 in FL
Livability — Winter Haven
- Score
- 74/100
- State rank
- #291
- US rank
- #4898
Category grades
Schools grade is shown separately in the Schools card above.
Census & demographics
- Census place
- Winter Haven, FL
- County
- Polk County · 740,051 people
- City population
- 121,740
- Metro
- Lakeland-Winter Haven, FL
- Population (ZIP)
- 37,561
- Household income
- $70,443
- Rent vs Own
- Severe rent burden
- 949.0
Population outlook (Polk County) Hauer SSP2
- Today (2025)
- 752,975 people
- By 2030
- 804,621 · +6.9%
- By 2040
- 906,117 · +20.3%
- By 2050
- 1,000,476 · +32.9%
- By 2075
- 1,197,520 · +59.0%
- By 2100
- 1,271,518 · +68.9%
Race, ethnicity, and origin ACS 2023
- Neighborhood character
- Diverse neighborhood (Simpson 0.55)
- Race & ethnicity
- White 63% Hispanic / Latino 19% Black 14% Two or more races 7% Asian 2%
- Hispanic origin (detail)
- Mexican 2% Puerto Rican 10% Cuban 2%
- Common ancestry
- Romanian 2% Lithuanian 2% Hispanic 2%
- Foreign-born
- 7% · Canada, Jamaica
- Languages at home
- 84% English-only · Spanish 12% French/Haitian/Cajun 1% Other Indo-European 1%
Political lean MEDSL · Polk
- 2024 margin
- Strong R (+20.7) · D 39.2% · R 59.9%
- 2008→2024 swing
- -14.6pp toward R · 2008: -6.1pp · 2024: -20.7pp
- All cycles
- 2024: R+20.7 2020: R+14.4 2016: R+14.1 2012: R+6.8 2008: R+6.1
Not yet ingested
- Civics
- —
Market trends
- HPI YoY
- ▼ -134.69%
- Current HPI
- 260.1421
- Rent YoY
- ▲ 1.90%
- Metro
- Lakeland-Winter Haven, FL
- State GDP YoY
- ▲ 3.28%
- F500 in state
- 36
Industry mix (Fortune 500 HQ in FL)
| Industry | F500 HQs | Revenue |
|---|---|---|
| Industrial Technology | 2 | $29B |
|
||
| Insurance | 2 | $17B |
|
||
| Retail | 1 | $60B |
|
||
| Technology Distribution | 1 | $58B |
|
||
| Homebuilding | 1 | $35B |
|
||
| Technology Manufacturing | 1 | $35B |
|
||
Price history
-19.7% since first listed8 events — show timeline
- 2026-04-06 Pending — Stellar MLS as Distributed by MLS Grid
- 2026-04-02 Price Changed $274,990 Stellar MLS as Distributed by MLS Grid
- 2026-03-21 Price Changed $289,990 Stellar MLS as Distributed by MLS Grid
- 2026-02-19 Price Changed $299,990 Stellar MLS as Distributed by MLS Grid
- 2025-11-04 Price Changed $317,390 Stellar MLS as Distributed by MLS Grid
- 2025-09-15 Price Changed $314,390 Stellar MLS as Distributed by MLS Grid
- 2025-08-13 Price Changed $317,390 Stellar MLS as Distributed by MLS Grid
- 2025-07-22 Listed $342,390 Stellar MLS as Distributed by MLS Grid
Cash-flow waterfall
monthlySold comps — $/sqft
last 12 mo · ≤1 miLoading sold comps…