 Duplex
2026 N 39th St #2028 · Milwaukee, WI
Flood risk 1/10 · Minimal
- FEMA flood zone
- X (unshaded)
- Chance of flooding over 30 yrs
- 0.0%
- Est. flood insurance / yr
- $473 – $860
Fire risk 1/10 · Minimal
- Est. fire insurance / yr
- $636 – $1,182
Heat risk 2/10 · Minimal
- Hot days now (above 98°F)
- 7 days/yr
- Hot days in 30 yrs
- 13 days/yr
Wind risk 2/10 · Minimal
- Chance of severe wind over 30 yrs
- —
Air-quality risk 2/10 · Minimal
- Unhealthy air days now
- 2 days/yr
- Unhealthy air days in 30 yrs
- 2 days/yr
Risk factors via First Street. Map © Google.
Why this score? — see what drove the C grade
The composite is a weighted blend of 9 inputs, each scored 0–100. Each bar is that input's sub-score; the figure is the points it added to the 100-point composite (weight × sub-score).
- Cash flow +26.9/30.0
- DSCR +9.3/10.0
- 1% rule +7.3/10.0
- Rent growth +5.0/5.0
- Livability +4.0/5.0
- Condition / age +2.2/5.0
- Schools +1.2/10.0
- ARV discount +0.0/15.0
- Appreciation +0.0/10.0
$189,900
🖨 Deal sheet 📄 Offer letter ✓ Due diligence
Multi-family units
County records classify this as Multi-Family (2-4 Unit). Listing-text estimate: 2 units. confirmed
Listing remarks MLS
Roomy duplex, spacious living rooms, dinning rooms with buffet and lots of woodwork throughout, updated kitchens and baths. Backyard updated on the extra lot surrounded with a new fence. Nice size patio area for family BBQ's. 4 parking spaces. 2018 roofing. Solid Duplex.
Key facts
- Formal dining room
- Built-in buffet
- French doors
Tags
Property features AI
Finance
- Other: Inclusions: 2 ovens/ranges and 2 refrigerators; Exclusions: Tenant's personal property
Exterior
- Parking: Total garage capacity for 4+ cars; Listed as 4 garage parking spaces; Additional parking: 1 space
- Utilities: Municipal water; Municipal sewer; 2 electric meters; 2 gas meters
- Home design: Two-story duplex; Multi-family property (2 units); Year built: Assessor/Public Record
- Construction: Vinyl siding
- Exterior features: Vinyl exterior; Lot is approximately 0.25 acre; Zoned RT4 Residential
Interior
- Kitchen: Unit 2 kitchen on upper level; Includes 2 ovens/ranges and 2 refrigerators (included)
- Bedrooms: Unit 1: 2 bedrooms; Unit 2: 2 bedrooms (master and second bedroom on upper level)
- Bathrooms: Unit 1: 1 full bathroom; Unit 2: 1 full bathroom
- Interior features: Full block basement
- Laundry & utility: No washer/dryer details provided
Neighborhood map
What this means for you Summary
Snapshot
- This is a 2 × 2-bed/1.0-bath units multifamily listed at $190k. Condition is rated fair.
Deal economics
- At list price, monthly cash flow is $528 ($6k/yr) — positive. Per door: $264/mo.
- The deal already cash-flows at list — no discount required.
- Meets the 1% rule at list price ($2k rent vs $190k).
- Cap rate 9.6% vs local median 5.1% in Milwaukee — top-decile yield for the area; either an underpriced asset or a hidden risk that comps aren't pricing in. Stress-test before assuming the spread holds.
Location & tenants
- Location reads 81/100 on livability (#55 in WI, #1,534 nationally) — a professional / high-income tenant draw. Strengths: amenities A+, commute A+, cost of living A+; Watch: employment D+, schools F, crime F.
- Milwaukee School District (urban): math 10% / reading 18% proficiency, ranked #337 of 342 in WI (top 98%) — low school quality limits family demand, transient renter base, plan for 1-2y turnover; 77% free/reduced lunch — lower-income household profile, screen leases tightly.
- Market conditions: Rents rising fast (+10.8%/yr); 92 active listings in the ZIP; 2 comparable units currently listed for rent nearby; 1,017 units permitted in Milwaukee County in 2024 (803 in 5+ unit buildings).
- At $2,330/mo this rent would consume 53% of the median local household income ($53k/yr) (locally 1568% of renters already pay >50% of income on rent) — very limited rent-growth headroom before tenants either downsize or default.
Forward outlook
- Local home prices are declining (-3.0%/yr); year-one equity from $1k of loan paydown is wiped out by about $6k of value loss. Plan a longer hold.
- Milwaukee County population projected at +4% by 2050 — modest demand growth; plan on rents tracking national, not racing it.
- At projected returns (-3.0% appreciation + 8.0% rent growth), your $53k cash investment doubles in ~7 years — after that, you're playing with house money.
Negotiation context
- Only 11 days on market — expect competitive offers; lowballing is unlikely to land.
- 3 sale attempts since 3y ago with the ask held roughly flat each time — persistent listings suggest the price (not the market) is what's stuck; bring a comps-based counter.
- Current owner paid $151k; 26% above their basis — modest negotiation headroom, anchor on the comps not their cost.
Risks & watch-outs
- Watch-outs: built in 1922 — expect roof / HVAC / electrical / plumbing capex.
Questions for the listing agent
- Can we see the unit-by-unit rent roll, current vacancy, and any below-market leases? What's the average tenancy length?
- What capital expenditures (roof, boiler, parking lot, exteriors) have been made in the last 5 years, and what's planned in the next 2?
- Have any recent inspections been done? Can we get a copy of the seller's disclosures and any deferred-maintenance estimates?
- Built in 1922 — when were the roof, HVAC, electrical panel, plumbing, and water heater last replaced?
- Is there a deadline driving the sale (1031 exchange, divorce, estate, relocation)? That informs how much negotiation room exists.
- Schools are F-rated, which usually means shorter tenancies and higher turnover. Who's the typical renter profile here, and what's been the actual vacancy rate?
- Crime grade is F in this area — have there been break-ins, vandalism, or insurance claims at this property in the last 3 years? What carrier currently insures it and at what premium?
- What's the average days-on-market for RENTAL listings here right now (not sales)? A rising rental-DOM trend means longer vacancies and softer asking-rent achievability than the comps imply.
- What's the recent tenant-quality profile in this submarket — average credit score on applications, eviction rate, late-payment / NSF rate, and stable-employment percentage? A property-management company in the area should have these aggregated.
- How much new apartment / multifamily construction is in the pipeline within 1–3 miles? Heavy new supply (>2% of stock underway) typically softens rents 12–24 months out; light construction supports rent growth.
Investment metrics
- 1% rule
- 1.23% ✓
- Cap rate
- 9.63%
- Cash-on-cash
- 11.92%
- DSCR
- 1.53
- GRM
- 6.8
CMA / ARV
- ARV (on-the-fly)
- $126,616
- Comps found
- 12
Show comp detail 12 sales within ~0.75 mi
| Address | Dist | Beds/Ba | Sqft | Sold | Price | $/sf | Match |
|---|---|---|---|---|---|---|---|
| 2118 N 38th St #2120 | 0.08mi | 4/2.0 | 2,341 (-9%) | 0mo | $62,500 | $27 | 80 |
| 3513 W Lloyd St #3515 | 0.21mi | 4/2.0 | 2,470 (-4%) | 3mo | $220,000 | $89 | 80 |
| 2342 N 45th St #2344 | 0.50mi | 4/2.0 | 2,577 (-0%) | 3mo | $125,000 | $49 | 74 |
| 3733 W Sarnow St #3735 | 0.22mi | 4/2.0 | 2,288 (-12%) | 2mo | $157,000 | $69 | 69 |
| 2014 N 35th St #2016 | 0.24mi | 4/2.0 | 2,208 (-15%) | 2mo | $72,000 | $33 | 62 |
| 1350 N 36th St #1352 | 0.63mi | 4/2.0 | 2,649 (+2%) | 4mo | $130,000 | $49 | 62 |
| 2182 N 48th St | 0.58mi | 4/2.0 | 2,410 (-7%) | 4mo | $199,900 | $83 | 58 |
| 2661 N 39th St #2663 | 0.71mi | 4/2.0 | 2,469 (-4%) | 2mo | $145,000 | $59 | 58 |
| 3127 W Garfield Ave #3129 | 0.45mi | 5/2.0 (+1) | 2,332 (-10%) | 0mo | $130,000 | $56 | 57 |
| 2631 N 33rd St #2633 | 0.75mi | 4/2.0 | 2,470 (-4%) | 1mo | $72,500 | $29 | 57 |
| 1922 N 27th St #1924 | 0.75mi | 5/2.0 (+1) | 2,454 (-5%) | 4mo | $90,000 | $37 | 48 |
| 1925 N 27th St #1927 | 0.72mi | 4/2.0 | 2,266 (-12%) | 4mo | $90,000 | $40 | 43 |
Match score weights: distance 35% · size 25% · config 20% · recency 20%. Top-matched comps best support the ARV.
Projected returns pro-forma
-3.0% appreciation · 8.0% rent growth · sell at horizon
- IRR
- 6.9%
- Equity multiple
- 1.29×
- Total profit
- $15,227
- Equity at exit
- $28,315
- IRR
- 20.3%
- Equity multiple
- 3.12×
- Total profit
- $112,777
- Equity at exit
- $16,419
Cash invested: $53,172 (down + closing). Projections, not guarantees.
Landlord ↔ Tenant lean methodology
- Overall (STATE)
- 73 Landlord-Friendly
- State Wisconsin
- 73 Landlord-Friendly · R+2
- County
- — inherits STATE
- City
- — inherits STATE
ZIP-level market 53208
- Home prices YoY
- -27.1%
- Rents YoY
- 10.8%
- Active inventory
- 92
- Price-to-rent
- 13.6×
Monthly cashflow live
- Estimated rent
- $2,330 high interval (Pro) →
- Mortgage (P&I)
- −$996
- Tax est. 1.5%
- −$237 /mo · $2,848/yr
- Insurance
- −$79
- HOA
- −$0
- Vacancy / Maint / Mgmt
- −$489
- Net cashflow
- $528
Break-even live
2-unit breakdown (identical units grouped — click to expand)
| Units | Beds | Baths | Est. rent |
|---|---|---|---|
| 2× units | 2 | 1 | $2,330 |
| #1 | 2 | 1 | $1,165 |
| #2 | 2 | 1 | $1,165 |
| Total (2 units) | $2,330 | ||
UW: 25.0% down · 7.5% · 30yr · 1.5% tax · 5.0% vac · 8.0% maint · 8.0% mgmt
Financing live
Cash to close
- Down payment
- $47,475
- Closing costs
- $5,697
- Reserves months
- —
- Total cash needed
- —
Loan-product check · same deal, 3 products live
Conventional
25% down · 7.5% · 30yr
- Down + closing
- —
- Monthly P&I
- —
- Monthly cashflow
- —
- DSCR
- —
- Eligible?
- —
Personal DTI + credit; lowest rate.
DSCR
20% down · 8.5% · 30yr
- Down + closing
- —
- Monthly P&I
- —
- Monthly cashflow
- —
- DSCR
- —
- Eligible?
- —
No personal income docs; deal must DSCR.
Hard money
10% down · 12.0% · 12mo
- Down + closing
- —
- Monthly P&I
- —
- Monthly cashflow
- —
- DSCR
- —
- Eligible?
- —
Short-term bridge; refi at stabilization.
Rent comps 2 comps
| Address | Beds | Baths | Sqft | Rent | $/sqft | DOM | Units | Dist |
|---|---|---|---|---|---|---|---|---|
| 2432 N 28th St Milwaukee, WI | 5.0 | 1.5 | 1876 | $1,600 | $0.85 | 43d | 1 | 0.81mi |
| 2119 W Brown St Milwaukee, WI | 3.0 | 1.0 | 1754 | $995 | $0.57 | 3d | 1 | 1.14mi |
Listing history 9 events
-
2026-06-18days on market $189,900 Active 11 DOM
-
2026-06-17days on market $189,900 Active 10 DOM
-
2026-06-16days on market $189,900 Active 9 DOM
-
2026-06-15days on market $189,900 Active 8 DOM
-
2026-06-13days on market $189,900 Active 6 DOM
-
2026-06-13days on market $189,900 Active 5 DOM
-
2026-06-09days on market $189,900 Active 2 DOM
-
2026-06-08remarks 442-char remark
-
2026-06-08$189,900 Active 1 DOM
ⓘ Source: listings_history table (triggers on properties + properties_extension) + one-shot
backfill from property_details.listing_events for pre-trigger history.
Climate risk First Street
- Flood 1/10 Low FEMA zone X (unshaded) · 0% chance over 30 yrs
- Wildfire 1/10 Low
- Heat 2/10 Low 7 d/yr ≥98°F today · 13 d/yr by 30 yrs out
- Wind 2/10 Low
- Air quality 2/10 Low 2 unhealthy d/yr today · 2 by 30 yrs out
Nearby sold comps map
Loading sold comps map…
Walkable amenities ~0.75 mi
Loading nearby amenities…
Taxation est. · year 1
- Rental income
- $27,960
- − Mortgage interest
- −$10,637
- − Property taxes
- −$2,848
- − Insurance
- −$950
- − Repairs & maintenance
- −$2,237
- − Management
- −$2,237
- − Depreciation
- −$5,524
- Taxable income
- $3,527
- Est. tax owed @ 24.0%
- −$846
- After-tax cash flow
- $5,494/yr
For passive investors: Depreciation is non-cash, so a rental often shows a tax loss while cash-flowing — sheltering income. Rental losses are passive: they offset passive income freely, and up to $25,000/yr can offset ordinary (W-2) income if you actively participate and your MAGI is under $100k (phasing out to $0 by $150k); unused losses carry forward. On sale, claimed depreciation is recaptured at up to 25%, and gains may owe capital-gains tax (a 1031 exchange can defer both). Figures are a year-1 estimate at your 24.0% rate — not tax advice; consult a CPA.
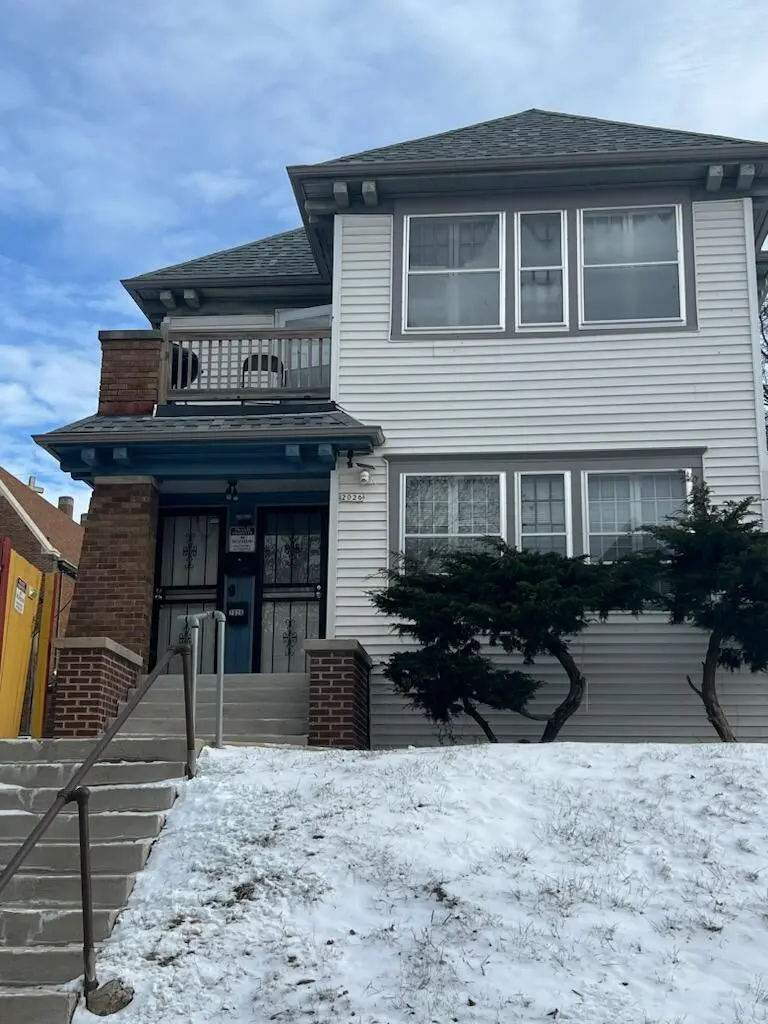
Condition & rehab AI · 2 photos
The home requires significant repairs and maintenance, particularly to the roof and exterior, to improve its condition and value.
Repairs flagged
- Major roof — The satellite image suggests potential roof damage.
- Major exterior siding — The siding is peeling and the paint is faded.
- Major landscaping — The landscaping is sparse and needs improvement to enhance curb appeal.
Value-add opportunities
- Both repair roof — Repairing the roof would improve the home's structural integrity and curb appeal.
- Both repair exterior siding and paint — Repairing the siding and repainting would enhance the home's appearance and curb appeal.
- Both landscaping — Improving the landscaping would enhance the home's curb appeal and make it more attractive to potential buyers or renters.
Renovation cost estimate screening
| Repair item | Severity | Est. cost |
|---|---|---|
| roof · The satellite image suggests potential roof damage. | Major | $15,000–50,000 |
| exterior siding · The siding is peeling and the paint is faded. | Major | $15,000–50,000 |
| landscaping · The landscaping is sparse and needs improvement to enhance curb appeal. | Major | $15,000–50,000 |
| Total estimated repair cost · 3 items | $45,000–150,000 |
Value-add ROI direction
- Both repair roof — Repairing the roof would improve the home's structural integrity and curb appeal. ↑
- Both repair exterior siding and paint — Repairing the siding and repainting would enhance the home's appearance and curb appeal. ↑
- Both landscaping — Improving the landscaping would enhance the home's curb appeal and make it more attractive to potential buyers or renters. ↑
ⓘ Cost ranges are severity-bucket heuristics (US national rule-of-thumb). Get contractor quotes + a written scope before underwriting a rehab budget.
Schools (NCES district)
- District
- Milwaukee School District
- NCES district ID
- 5509600
- Math proficiency
- 10% ▼ -5.00%
- Reading proficiency
- 18% ▬ 0.00%
- Median HH income
- $36,339
- Composite
- 11.61/100
- National rank
- #9696
- State rank
- #337 of 342 in WI
Livability — Milwaukee
- Score
- 81/100
- State rank
- #55
- US rank
- #1534
Category grades
Schools grade is shown separately in the Schools card above.
Census & demographics
- Census place
- Milwaukee, WI
- County
- Milwaukee County · 926,379 people
- City population
- 573,768
- Metro
- Milwaukee-Waukesha, WI
- Population (ZIP)
- 27,201
- Household income
- $52,690
- Rent vs Own
- Severe rent burden
- 1568.0
Population outlook (Milwaukee County) Hauer SSP2
- Today (2025)
- 995,758 people
- By 2030
- 1,009,124 · +1.3%
- By 2040
- 1,028,128 · +3.3%
- By 2050
- 1,040,066 · +4.4%
- By 2075
- 1,057,849 · +6.2%
- By 2100
- 1,039,774 · +4.4%
Race, ethnicity, and origin ACS 2023
- Neighborhood character
- Diverse neighborhood (Simpson 0.69)
- Race & ethnicity
- Black 41% White 36% Hispanic / Latino 10% Asian 9% Two or more races 6%
- Hispanic origin (detail)
- Mexican 7% Puerto Rican 2%
- Common ancestry
- Romanian 5% Italian 2% Lithuanian 2%
- Foreign-born
- 9% · Canada, Philippines
- Languages at home
- 84% English-only · Other Asian/Pacific 6% Spanish 6% French/Haitian/Cajun 1%
Political lean MEDSL · Milwaukee
- 2024 margin
- Solid D (+38.5) · D 68.3% · R 29.8% · Other 1.8%
- 2008→2024 swing
- +2.7pp toward D · 2008: 35.9pp · 2024: 38.5pp
- All cycles
- 2024: D+38.5 2020: D+39.9 2016: D+37.5 2012: D+34.6 2008: D+35.9
Not yet ingested
- Civics
- —
Market trends
- HPI YoY
- ▼ -123.92%
- Current HPI
- 333.7268
- Rent YoY
- ▲ 10.78%
- Metro
- Milwaukee-Waukesha, WI
- State GDP YoY
- ▲ 2.10%
- F500 in state
- 20
Industry mix (Fortune 500 HQ in WI)
| Industry | F500 HQs | Revenue |
|---|---|---|
| Industrial Machinery | 4 | $23B |
|
||
| Industrial Technology | 2 | $36B |
|
||
| Insurance | 1 | $36B |
|
||
| Professional Services | 1 | $19B |
|
||
| Utilities | 1 | $9B |
|
||
| Consumer Goods | 1 | $3B |
|
||
Price history
+18.7% since first listed7 events — show timeline
- 2026-06-07 Listed $189,900 METROMLS
- 2023-05-19 Sold (MLS) $151,000 METROMLS
- 2023-04-04 Pending — METROMLS
- 2023-03-22 Price Changed $155,000 METROMLS
- 2023-03-15 Relisted — METROMLS
- 2023-01-26 Pending — METROMLS
- 2023-01-06 Listed $160,000 METROMLS
Cash-flow waterfall
monthlySold comps — $/sqft
last 12 mo · ≤1 miLoading sold comps…