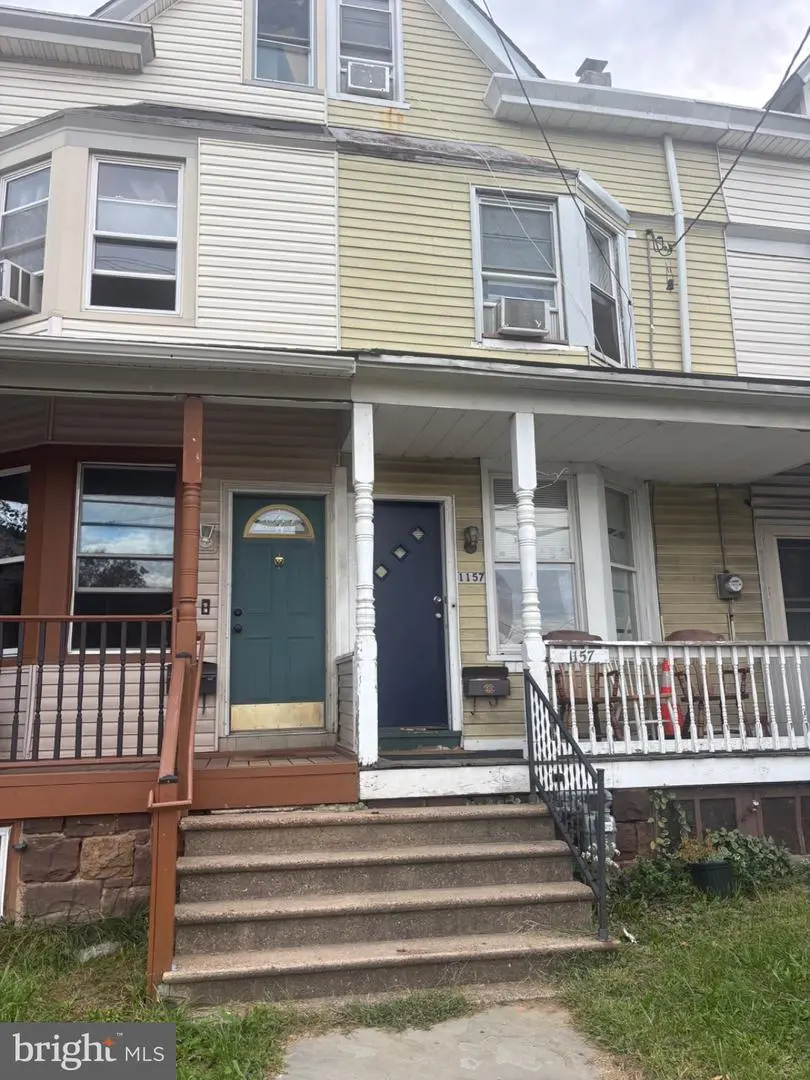
1157 Chambers St · Trenton, NJ
Flood risk 1/10 · Minimal
- FEMA flood zone
- X (unshaded)
- Chance of flooding over 30 yrs
- 0.0%
- Est. flood insurance / yr
- $507 – $1,088
Fire risk 3/10 · Minor
- Est. fire insurance / yr
- $526 – $976
Heat risk 6/10 · Moderate
- Hot days now (above 102°F)
- 7 days/yr
- Hot days in 30 yrs
- 15 days/yr
Wind risk 6/10 · Moderate
- Chance of severe wind over 30 yrs
- 27.0%
Air-quality risk 5/10 · Moderate
- Unhealthy air days now
- 6 days/yr
- Unhealthy air days in 30 yrs
- 8 days/yr
Risk factors via First Street. Map © Google.
Why this score? — see what drove the B grade
The composite is a weighted blend of 9 inputs, each scored 0–100. Each bar is that input's sub-score; the figure is the points it added to the 100-point composite (weight × sub-score).
- Cash flow +28.1/30.0
- ARV discount +15.0/15.0
- DSCR +10.0/10.0
- 1% rule +8.3/10.0
- Livability +3.8/5.0
- Rent growth +2.5/5.0
- Condition / age +2.5/5.0
- Schools +0.7/10.0
- Appreciation +0.0/10.0
$179,000
🖨 Deal sheet (PDF) 📄 Offer letter ✓ Due diligence
Listing remarks MLS
1st Floor: Living Room, Dining Room, and Eat in Kitchen. 2nd Floor: 3 Bedrooms and Full Bath. 3rd Floor: Attic-Finished No heat. House needs Rehab. Cash "AS IS" Only.
Key facts
- Third floor attic
- Built 1910
- Listed 27 days
Tags
Property features AI
Exterior
- Parking: Street parking; Alley access
- Utilities: Public water; Public sewer; Natural gas service
- Home design: Interior townhouse/rowhouse; Fee simple ownership
- Construction: Frame construction; Brick/mortar foundation; Estimated year built
- Exterior features: Not in a federal flood zone
Interior
- Bedrooms: Three bedrooms on the first upper level
- Bathrooms: One full bathroom
- Heating & cooling: Forced air heating; Natural gas hot water
- Interior features: Average condition; Unfinished basement
- Laundry & utility: Laundry located in the basement
Neighborhood map
What this means for you Summary
Snapshot
- This is a 3-bed/1.0-bath townhouse listed at $179k.
Deal economics
- At list price, monthly cash flow is $565 ($7k/yr) — positive.
- The deal already cash-flows at list — no discount required.
- Meets the 1% rule at list price ($2k rent vs $179k).
- Recommended offer: $176k (1.5% below list) — sets the bar for market timing.
- Cap rate 10.1% vs local median 5.7% in Trenton — top-decile yield for the area; either an underpriced asset or a hidden risk that comps aren't pricing in. Stress-test before assuming the spread holds.
Location & tenants
- Location reads 76/100 on livability (#133 in NJ, #3,533 nationally) — a middle-class / working-renter tenant base. Strengths: amenities A+, commute A+, health & safety A+; Watch: crime F, employment F.
- Trenton Public School District (urban): math 2% / reading 16% proficiency, ranked #471 of 472 in NJ (top 100%) — low school quality limits family demand, transient renter base, plan for 1-2y turnover; 80% free/reduced lunch — lower-income household profile, screen leases tightly.
- Zoned schools: Franklin Elementary School (math 3% / reading 14%, grade F, #1,261 of 1,303 statewide, top 97%, 349 students, 57% FRL); Dunn Middle School (math 2% / reading 19%, grade F, #424 of 431 statewide, top 98%, 670 students, 60% FRL); Trenton Central High School - Main Campus (math 2% / reading 10%, grade F, #396 of 399 statewide, top 99%, 2,255 students, 56% FRL) — zoned schools average 58% FRL vs 80% district-wide (23 pts lower); this property's tenant base skews higher-income than the district average.
- Market conditions: 118 active listings in the ZIP; 32 comparable units currently listed for rent nearby; rentals at typical pace (median 23d on market — plan ~3-4 weeks tenant-placement turnaround); solid renter incomes; 2,256 units permitted in Mercer County in 2024 (1,303 in 5+ unit buildings).
Forward outlook
- Local home prices are declining (-3.0%/yr); year-one equity from $1k of loan paydown is wiped out by about $5k of value loss. Plan a longer hold.
- Mercer County population projected at +4% by 2050 — modest demand growth; plan on rents tracking national, not racing it.
- At projected returns (-3.0% appreciation + 3.0% rent growth), your $50k cash investment doubles in ~9 years — after that, you're playing with house money.
Negotiation context
- It's been on market 27 days — a 2% lower offer ($176k) is reasonable based on typical stale-listing flexibility.
- 2 sale attempts since 24y ago with the ask held roughly flat each time — persistent listings suggest the price (not the market) is what's stuck; bring a comps-based counter.
- Current owner paid $30k; list at $179k implies a 499% gain — meaningful room to come down on a strong offer.
Risks & watch-outs
- Watch-outs: built in 1910 — expect roof / HVAC / electrical / plumbing capex.
- Climate carrying-cost: major wind risk, 27% chance of damaging wind over 30y; extreme-heat days projected 7→15/yr by 2055 (HVAC capex compounding) — expect insurance premiums to compound above CPI over the hold.
Questions for the listing agent
- Built in 1910 — when were the roof, HVAC, electrical panel, plumbing, and water heater last replaced?
- Is there a deadline driving the sale (1031 exchange, divorce, estate, relocation)? That informs how much negotiation room exists.
- Schools are F-rated, which usually means shorter tenancies and higher turnover. Who's the typical renter profile here, and what's been the actual vacancy rate?
- Crime grade is F in this area — have there been break-ins, vandalism, or insurance claims at this property in the last 3 years? What carrier currently insures it and at what premium?
- What's the average days-on-market for RENTAL listings here right now (not sales)? A rising rental-DOM trend means longer vacancies and softer asking-rent achievability than the comps imply.
- What's the recent tenant-quality profile in this submarket — average credit score on applications, eviction rate, late-payment / NSF rate, and stable-employment percentage? A property-management company in the area should have these aggregated.
- How much new for-sale + rental construction is in the pipeline within 1–3 miles? Heavy new supply typically softens prices + rents 12–24 months out; constrained supply supports both.
Investment metrics
- 1% rule
- 1.33% ✓
- Cap rate
- 10.08%
- Cash-on-cash
- 13.52%
- DSCR
- 1.60
- GRM
- 6.3
CMA / ARV
- ARV (on-the-fly)
- $259,325
- Comps found
- 12
Show comp detail 12 sales within ~0.75 mi
| Address | Dist | Beds/Ba | Sqft | Sold | Price | $/sf | Match |
|---|---|---|---|---|---|---|---|
| 814 Chestnut Ave | 0.47mi | 3/1.5 | 1,292 (+2%) | 0mo | $265,000 | $205 | 72 |
| 1553 Chambers St | 0.39mi | 3/1.0 | 1,182 (-7%) | 1mo | $225,000 | $190 | 70 |
| 508 Dayton St | 0.46mi | 3/1.0 | 1,376 (+9%) | 4mo | $250,000 | $182 | 61 |
| 175 Anderson St | 0.45mi | 4/1.0 (+1) | 1,136 (-10%) | 1mo | $225,000 | $198 | 56 |
| 336 Columbus Ave | 0.42mi | 3/3.0 | 1,162 (-8%) | 3mo | $370,000 | $318 | 56 |
| 541 Emmett Ave | 0.63mi | 4/1.5 (+1) | 1,204 (-5%) | 1mo | $275,000 | $228 | 54 |
| 2102 Liberty St | 0.66mi | 3/2.0 | 1,201 (-5%) | 3mo | $252,000 | $210 | 54 |
| 1315 S Broad St | 0.45mi | 2/1.5 (-1) | 1,400 (+11%) | 2mo | $205,000 | $146 | 53 |
| 1229 S Broad St | 0.44mi | 4/1.5 (+1) | 1,410 (+12%) | 2mo | $250,000 | $177 | 51 |
| 18 Panfili Ln | 0.46mi | 3/3.0 | 1,410 (+12%) | 1mo | $390,000 | $277 | 51 |
| 11 Panfili Ln | 0.45mi | 3/3.5 | 1,394 (+10%) | 2mo | $378,500 | $272 | 50 |
| 345 Genesee St | 0.66mi | 3/1.0 | 1,080 (-15%) | 1mo | $110,000 | $102 | 44 |
Match score weights: distance 35% · size 25% · config 20% · recency 20%. Top-matched comps best support the ARV.
Projected returns pro-forma
-3.0% appreciation · 3.0% rent growth · sell at horizon
- IRR
- 3.6%
- Equity multiple
- 1.14×
- Total profit
- $7,035
- Equity at exit
- $26,689
- IRR
- 13.2%
- Equity multiple
- 2.05×
- Total profit
- $52,765
- Equity at exit
- $15,477
Cash invested: $50,120 (down + closing). Projections, not guarantees.
Landlord ↔ Tenant lean methodology
- Overall (STATE)
- 21 Tenant-Leaning
- State New Jersey
- 21 Tenant-Leaning · D+6
- County
- — inherits STATE
- City
- — inherits STATE
ZIP-level market 08610
- Active inventory
- 118
- Price-to-rent
- 6.3×
Monthly cashflow live
- Estimated rent
- $2,379 high interval (Pro) →
- Mortgage (P&I)
- −$939
- Tax from tax record
- −$301 /mo · $3,616/yr
- Insurance
- −$75
- HOA
- −$0
- Vacancy / Maint / Mgmt
- −$500
- Net cashflow
- $565
Break-even live
Sensitivity live
| Price | -10% $666 | -5% $615 | +0% $565 | +5% $514 | +10% $463 |
|---|---|---|---|---|---|
| Rent | -10% $377 | -5% $471 | +0% $565 | +5% $659 | +10% $752 |
| Rate | -1.0pp $655 | -0.5pp $610 | base $565 | +0.5pp $518 | +1.0pp $471 |
UW: 25.0% down · 7.5% · 30yr · 1.5% tax · 5.0% vac · 8.0% maint · 8.0% mgmt
Financing live
Cash to close
- Down payment
- $44,750
- Closing costs
- $5,370
- Reserves months
- —
- Total cash needed
- —
Loan-product check · same deal, 3 products live
Conventional
25% down · 7.5% · 30yr
- Down + closing
- —
- Monthly P&I
- —
- Monthly cashflow
- —
- DSCR
- —
- Eligible?
- —
Personal DTI + credit; lowest rate.
DSCR
20% down · 8.5% · 30yr
- Down + closing
- —
- Monthly P&I
- —
- Monthly cashflow
- —
- DSCR
- —
- Eligible?
- —
No personal income docs; deal must DSCR.
Hard money
10% down · 12.0% · 12mo
- Down + closing
- —
- Monthly P&I
- —
- Monthly cashflow
- —
- DSCR
- —
- Eligible?
- —
Short-term bridge; refi at stabilization.
Rent comps 32 comps
| Address | Beds | Baths | Sqft | Rent | $/sqft | DOM | Units | Dist |
|---|---|---|---|---|---|---|---|---|
| 234 Howell St Trenton, NJ | 3.0 | 3.0 | 1656 | $3,600 | $2.17 | 22d | 1 | 0.14mi |
| 705 Anderson St Trenton, NJ | 3.0 | 1.0 | 1132 | $1,800 | $1.59 | 15d | 1 | 0.27mi |
| 1049 Genesee St Trenton, NJ | 3.0 | 1.0 | 1270 | $2,300 | $1.81 | 22d | 1 | 0.36mi |
| 1132 Genesee St Unit 1132 Trenton, NJ | 3.0 | 1.0 | 1198 | $2,500 | $2.09 | 22d | 1 | 0.36mi |
| 1103 Division St Trenton, NJ | 4.0 | 1.0 | 1296 | $2,000 | $1.54 | 22d | 1 | 0.45mi |
| 1078 Lalor St Unit 2 Trenton, NJ | 2.0 | 1.0 | 1488 | $1,785 | $1.20 | 22d | 1 | 0.50mi |
| 1078 Lalor St Unit 1 Trenton, NJ | 2.0 | 1.0 | 1488 | $1,895 | $1.27 | 22d | 1 | 0.50mi |
| 176 Division St Apt 106 Trenton, NJ | 2.0 | 1.0 | 975 | $1,700 | $1.74 | 22d | 1 | 0.50mi |
| 121 Columbus Ave Trenton, NJ | 3.0 | 1.0 | 1050 | $1,900 | $1.81 | 22d | 1 | 0.60mi |
| 233 Virginia Ave Trenton, NJ | 3.0 | 1.0 | 1302 | $2,500 | $1.92 | 14d | 1 | 0.61mi |
| 635 Chambers St Trenton, NJ | 4.0 | 2.0 | 1312 | $2,500 | $1.91 | 15d | 1 | 0.65mi |
| 973 S Olden Ave Unit 2ND FLOOR Trenton, NJ | 2.0 | 1.0 | 1664 | $1,850 | $1.11 | 22d | 1 | 0.66mi |
| 313 Home Ave Trenton, NJ | 3.0 | 1.0 | 1112 | $2,100 | $1.89 | 15d | 1 | 0.70mi |
| 203 Genesee St Unit 2 Trenton, NJ | 2.0 | 1.0 | 1452 | $1,700 | $1.17 | 22d | 1 | 0.76mi |
| 720 Monmouth St Unit 204 Trenton, NJ | 2.0 | 1.0 | 1011 | $1,750 | $1.73 | 22d | 1 | 0.80mi |
| 244 Jersey St Trenton, NJ | 3.0 | 1.5 | 1368 | $2,300 | $1.68 | 15d | 1 | 0.86mi |
| 239 Ardmore Ave Trenton, NJ | 4.0 | 2.0 | 1665 | $2,750 | $1.65 | 22d | 1 | 0.94mi |
| 71 Clark St Trenton, NJ | 1.0–2.0 | 1.0–2.0 | 975 | $2,350 | $2.41 | 15d | 4 | 0.97mi |
| 700 Schiller Ave Trenton, NJ | 3.0 | 1.0 | 1558 | $2,500 | $1.60 | 15d | 1 | 1.02mi |
| 428 Cleveland Ave Trenton, NJ | 4.0 | 2.0 | 1400 | $2,500 | $1.79 | 22d | 1 | 1.02mi |
| 105 Walnut Ave Unit 1 Trenton, NJ | 2.0 | 1.0 | 1200 | $2,000 | $1.67 | 22d | 1 | 1.07mi |
| 234 Walnut Ave Trenton, NJ | 4.0 | 1.0 | 1480 | $2,200 | $1.49 | 22d | 1 | 1.10mi |
| 417 Walnut Ave Trenton, NJ | 3.0 | 1.0 | 992 | $2,050 | $2.07 | 22d | 1 | 1.13mi |
| 547 Centre St Trenton, NJ | 3.0 | 1.0 | 1060 | $1,850 | $1.75 | 22d | 1 | 1.16mi |
| 1165 E State St Trenton, NJ | 3.0 | 1.0 | 900 | $1,749 | $1.94 | 15d | 1 | 1.28mi |
| 219 Woodlawn Ave Trenton, NJ | 3.0 | 1.0 | 1456 | $2,355 | $1.62 | 15d | 1 | 1.31mi |
| 340 Connecticut Ave Unit 2 Hamilton Township, NJ | 3.0 | 1.0 | 1400 | $2,850 | $2.04 | 15d | 1 | 1.33mi |
| 340 Connecticut Ave Unit 1 Hamilton Township, NJ | 2.0 | 1.0 | 1000 | $2,500 | $2.50 | 15d | 1 | 1.33mi |
| 210 Kuser Rd Trenton, NJ | 3.0 | 1.5 | 1360 | $2,700 | $1.99 | 22d | 1 | 1.38mi |
| 34 Southard St #2 Trenton, NJ | 2.0 | 2.0 | 1808 | $2,150 | $1.19 | 22d | 1 | 1.45mi |
| 42 Grant St Trenton, NJ | 4.0 | 1.0 | 1000 | $2,000 | $2.00 | 15d | 1 | 1.46mi |
| 88 Sundance Dr Trenton, NJ | 3.0 | 2.5 | 1730 | $3,103 | $1.79 | 45d | 1 | 1.47mi |
Listing history 6 events
-
2026-05-17status Pending
-
2026-04-20$179,000 Active
-
2002-06-06soldstatus $29,900 176-char remark
Show marketing remark (176 chars)
1st Floor: Living Room, Dining Room, and Eat in Kitchen. 2nd Floor: 3 Bedrooms and Full Bath. 3rd Floor: Attic-Finished No heat. House needs Rehab. Cash "AS IS" Only.
-
2002-03-08historical 176-char remark
Show marketing remark (176 chars)
1st Floor: Living Room, Dining Room, and Eat in Kitchen. 2nd Floor: 3 Bedrooms and Full Bath. 3rd Floor: Attic-Finished No heat. House needs Rehab. Cash "AS IS" Only.
-
2002-03-05$29,900 176-char remark
Show marketing remark (176 chars)
1st Floor: Living Room, Dining Room, and Eat in Kitchen. 2nd Floor: 3 Bedrooms and Full Bath. 3rd Floor: Attic-Finished No heat. House needs Rehab. Cash "AS IS" Only.
-
1977-07-11soldstatus $15,000
ⓘ Source: listings_history table (triggers on properties + properties_extension) + one-shot
backfill from property_details.listing_events for pre-trigger history.
Tax reassessment forecast NJ · Partial reset (capped growth)
- Current annual tax
- $3,616 · $301/mo
- Projected year-2 tax
- $4,037 · $336/mo
- Expected delta
- +$420/yr (+$35/mo · 11.6%)
ⓘ Screening estimate from a state-policy table — verify with the county assessor before closing.
Climate risk First Street
- Flood 1/10 Low FEMA zone X (unshaded) · 0% chance over 30 yrs
- Wildfire 3/10 Moderate
- Heat 6/10 Major 7 d/yr ≥102°F today · 15 d/yr by 30 yrs out
- Wind 6/10 Major 27% chance of damaging wind over 30 yrs
- Air quality 5/10 Major 6 unhealthy d/yr today · 8 by 30 yrs out
Nearby sold comps map
Loading sold comps map…
Walkable amenities ~0.75 mi
Loading nearby amenities…
Taxation est. · year 1
- Rental income
- $28,545
- − Mortgage interest
- −$10,027
- − Property taxes
- −$3,616
- − Insurance
- −$895
- − Repairs & maintenance
- −$2,284
- − Management
- −$2,284
- − Depreciation
- −$5,207
- Taxable income
- $4,232
- Est. tax owed @ 24.0%
- −$1,016
- After-tax cash flow
- $5,759/yr
For passive investors: Depreciation is non-cash, so a rental often shows a tax loss while cash-flowing — sheltering income. Rental losses are passive: they offset passive income freely, and up to $25,000/yr can offset ordinary (W-2) income if you actively participate and your MAGI is under $100k (phasing out to $0 by $150k); unused losses carry forward. On sale, claimed depreciation is recaptured at up to 25%, and gains may owe capital-gains tax (a 1031 exchange can defer both). Figures are a year-1 estimate at your 24.0% rate — not tax advice; consult a CPA.
Schools (NCES district)
- District
- Trenton Public School District
- NCES district ID
- 3416290
- Math proficiency
- 2% ▼ -8.00%
- Reading proficiency
- 16% ▼ -4.00%
- Median HH income
- $35,078
- Composite
- 7.31/100
- National rank
- #9956
- State rank
- #471 of 472 in NJ
Livability — Trenton
- Score
- 76/100
- State rank
- #133
- US rank
- #3533
Category grades
Schools grade is shown separately in the Schools card above.
Census & demographics
- Census place
- Trenton, NJ
- County
- Mercer County · 327,655 people
- City population
- 177,819
- Metro
- Trenton-Princeton, NJ
- Population (ZIP)
- 33,465
- Household income
- $83,906
- Rent vs Own
- Severe rent burden
- 1166.0
Population outlook (Mercer County) Hauer SSP2
- Today (2025)
- 381,395 people
- By 2030
- 384,640 · +0.9%
- By 2040
- 391,431 · +2.6%
- By 2050
- 397,845 · +4.3%
- By 2075
- 417,281 · +9.4%
- By 2100
- 420,327 · +10.2%
Race, ethnicity, and origin ACS 2023
- Neighborhood character
- Diverse neighborhood (Simpson 0.65)
- Race & ethnicity
- Hispanic / Latino 43% White 39% Black 15% Two or more races 13% Asian 3%
- Hispanic origin (detail)
- Puerto Rican 12% Dominican 9%
- Common ancestry
- Romanian 5% Hispanic 3% Italian 1%
- Foreign-born
- 25% · Canada, Jamaica, Guatemala
- Languages at home
- 55% English-only · Spanish 37% French/Haitian/Cajun 3% Other Indo-European 1%
Political lean MEDSL · Mercer
- 2024 margin
- Solid D (+33.9) · D 65.9% · R 32.0% · Other 2.1%
- 2008→2024 swing
- -2.2pp toward R · 2008: 36.1pp · 2024: 33.9pp
- All cycles
- 2024: D+33.9 2020: D+40.0 2016: D+36.2 2012: D+36.8 2008: D+36.1
Not yet ingested
- Civics
- —
Market trends
- HPI YoY
- ▼ -412.61%
- Current HPI
- 296.6642
- Rent YoY
- —
- Metro
- Trenton-Princeton, NJ
- State GDP YoY
- ▲ 2.05%
- F500 in state
- 34
Industry mix (Fortune 500 HQ in NJ)
| Industry | F500 HQs | Revenue |
|---|---|---|
| Consumer Goods | 3 | $31B |
|
||
| Pharmaceuticals | 2 | $153B |
|
||
| Technology | 2 | $21B |
|
||
| Insurance | 2 | $20B |
|
||
| Healthcare | 2 | $19B |
|
||
| Financial Services | 1 | $70B |
|
||
Price history
+1093.3% since first listed6 events — show timeline
- 2026-05-17 Pending — BRIGHT MLS
- 2026-04-20 Listed $179,000 BRIGHT MLS
- 2002-06-06 Sold (MLS) $29,900 BRIGHT MLS
- 2002-03-08 Listing Removed — BRIGHT MLS
- 2002-03-05 Listed $29,900 BRIGHT MLS
- 1977-07-11 Sold (Public Records) $15,000 Public Records
Property tax history
+2.1%/yrLatest (2025): $3,616 · +1.5% YoY. Source: county tax records.
Cash-flow waterfall
monthlySold comps — $/sqft
last 12 mo · ≤1 miLoading sold comps…