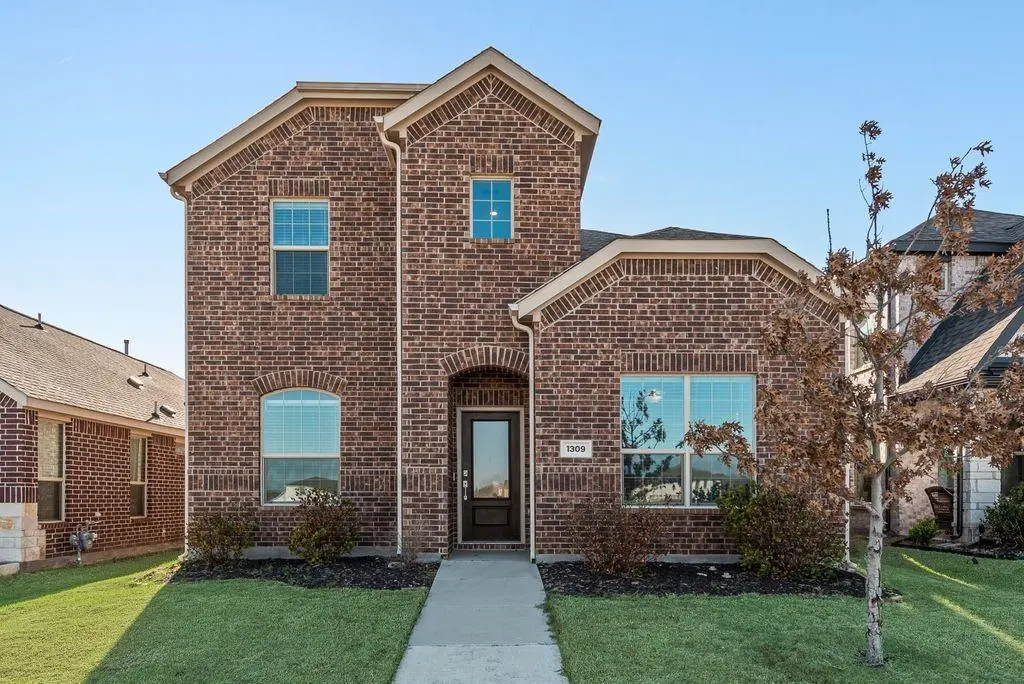
1309 Canuela Way · Fort Worth, TX
Flood risk 1/10 · Minimal
- FEMA flood zone
- X (unshaded)
- Chance of flooding over 30 yrs
- 0.0%
- Est. flood insurance / yr
- $507 – $1,088
Fire risk 3/10 · Minor
- Est. fire insurance / yr
- $1,222 – $2,270
Heat risk 8/10 · Major
- Hot days now (above 109°F)
- 7 days/yr
- Hot days in 30 yrs
- 22 days/yr
Wind risk 6/10 · Moderate
- Chance of severe wind over 30 yrs
- 27.0%
Air-quality risk 3/10 · Minor
- Unhealthy air days now
- 3 days/yr
- Unhealthy air days in 30 yrs
- 4 days/yr
Risk factors via First Street. Map © Google.
Why this score? — see what drove the D grade
The composite is a weighted blend of 9 inputs, each scored 0–100. Each bar is that input's sub-score; the figure is the points it added to the 100-point composite (weight × sub-score).
- ARV discount +14.6/15.0
- Cash flow +7.3/30.0
- Schools +4.6/10.0
- Livability +4.0/5.0
- 1% rule +3.2/10.0
- Condition / age +2.5/5.0
- Rent growth +2.4/5.0
- DSCR +1.5/10.0
- Appreciation +0.0/10.0
$340,000
🖨 Deal sheet (PDF) 📄 Offer letter ✓ Due diligence
Listing remarks
Welcome to your own private retreat in Wildflower Ranch—where comfort and lifestyle come together. This beautifully designed 3-bedroom, 3-bath home offers an open, airy floorplan that feels both inviting and functional, with peaceful views that make it easy to unwind at the end of the day. Life in Wildflower Ranch is all about enjoying the everyday. Spend weekends floating the resort-style lazy river, relaxing by the pool and clubhouse, or exploring miles of scenic trails. The community also features a playground, dog park, and open green spaces perfect for gathering with friends and family. Conveniently located near major highways, you’re just minutes from Tanger Outlets, Texas
Key facts
- Pool and clubhouse
- Scenic trails
- Dog park
Tags
Property features AI
Finance
- Other: Located in Denton County, subdivision Tradition Central Ph 1b
- HOA & community: Mandatory HOA with semi-annual fee; HOA fee covers full use of facilities and management fees; HOA management: Visions Management
Exterior
- Parking: Attached 2-car garage with garage door opener (garage faces rear); 2 covered parking spaces
- Utilities: MUD water and MUD sewer; Natural gas available; Cable available; Municipal Utility District; Electric service
- Home design: Single family residence; Residential property; Two levels; Built in 2022; Preowned
- Construction: Brick construction; Composition roof; Slab foundation
- Exterior features: Covered porch(es); Wood fencing; Few trees; Interior lot; Landscaped yard; Sprinkler system; Located in a subdivision
Interior
- Kitchen: Dishwasher; Gas range; Microwave; Disposal; Plumbed for gas in kitchen; Gas water heater
- Bedrooms: Primary bedroom on level 1 with dual sinks, ensuite bath and garden tub; Total of 3 bedrooms
- Flooring: Carpet; Tile; Vinyl
- Bathrooms: 3 full bathrooms
- Heating & cooling: Central heating (natural gas); Central air conditioning; Ceiling fans; ENERGY STAR qualified equipment
- Interior features: Open floorplan with cathedral ceilings; Eat-in kitchen with kitchen island; Granite counters; Flat screen wiring; Cable TV available; High-speed internet available; Walk-in closets; Two living areas; One dining area; Room count: 4
- Laundry & utility: Gas water heater
Neighborhood map
What this means for you Summary
Snapshot
- This is a 4-bed/3.0-bath single-family listed at $340k.
Deal economics
- At list price, monthly cash flow is $-449 ($-5k/yr) — negative.
- To cash-flow at today's rent, offer at most $261k (23.4% below list).
- To meet the 1% rule (rent ≥ 1% of price), the offer needs to be $279k (18.0% below list).
- Recommended offer: $261k (23.4% below list) — sets the bar for cash-flow.
- Cap rate 4.7% vs local median 3.9% in Fort Worth — meaningfully above typical; check what's discounted (condition, days-on-market, listing class) to confirm the premium yield is real.
Location & tenants
- Location reads 80/100 on livability (#49 in TX, #1,954 nationally) — a professional / high-income tenant draw. Strengths: amenities A+, cost of living A+, housing A+; Watch: crime F.
- Northwest ISD (rural): math 48% / reading 52% proficiency, ranked #120 of 826 in TX (top 14%) — acceptable for families but not a draw, mixed tenant base, ~2y average lease.
- Zoned schools: W R Hatfield El (math 48% / reading 46%, grade D-, #1,006 of 4,322 statewide, top 25%, 613 students, 29% FRL); Gene Pike Middle (math 47% / reading 46%, grade D+, #443 of 1,662 statewide, top 28%, 1,150 students, 29% FRL); Northwest H S (math 55% / reading 64%, grade C+, #275 of 1,632 statewide, top 19%, 2,264 students, 0% FRL) — zoned schools at 19% FRL track the district average.
- Market conditions: Rents soft (-0.5%/yr); 1516 active listings in the ZIP; 36 comparable units currently listed for rent nearby; rentals at typical pace (median 24d on market — plan ~3-4 weeks tenant-placement turnaround); high-income renter base; 10,531 units permitted in Denton County in 2024 (2,713 in 5+ unit buildings).
Forward outlook
- Local home prices are declining (-3.0%/yr); year-one equity from $2k of loan paydown is wiped out by about $10k of value loss. Plan a longer hold.
- Denton County population projected at +66% by 2050 — long-run rental-demand tailwind backs the buy-and-hold thesis.
Negotiation context
- It's been on market 24 days — a 2% lower offer ($335k) is reasonable based on typical stale-listing flexibility.
- 4 sale attempts with the ask held roughly flat each time — persistent listings suggest the price (not the market) is what's stuck; bring a comps-based counter.
Risks & watch-outs
- Climate carrying-cost: major wind risk, 27% chance of damaging wind over 30y; extreme-heat days projected 7→22/yr by 2055 (HVAC capex compounding) — expect insurance premiums to compound above CPI over the hold.
Questions for the listing agent
- What do current leases actually rent for vs. the listed asking? Can we see a recent rent roll and the last 12 months of T-12 income?
- What does the HOA fee cover, when was the last increase, and are there any pending special assessments or reserve-fund shortfalls?
- Is there a deadline driving the sale (1031 exchange, divorce, estate, relocation)? That informs how much negotiation room exists.
- Schools are D-rated, which usually means shorter tenancies and higher turnover. Who's the typical renter profile here, and what's been the actual vacancy rate?
- Crime grade is F in this area — have there been break-ins, vandalism, or insurance claims at this property in the last 3 years? What carrier currently insures it and at what premium?
- The area grade is low — what's the realistic commute time and amenity access for the typical tenant pool here? Any planned neighborhood developments (good or bad) we should know about?
- What's the average days-on-market for RENTAL listings here right now (not sales)? A rising rental-DOM trend means longer vacancies and softer asking-rent achievability than the comps imply.
- What's the recent tenant-quality profile in this submarket — average credit score on applications, eviction rate, late-payment / NSF rate, and stable-employment percentage? A property-management company in the area should have these aggregated.
- How much new for-sale + rental construction is in the pipeline within 1–3 miles? Heavy new supply typically softens prices + rents 12–24 months out; constrained supply supports both.
Investment metrics
- 1% rule
- 0.82% ✗
- Cap rate
- 4.71%
- Cash-on-cash
- -5.67%
- DSCR
- 0.75
- GRM
- 10.2
CMA / ARV
- ARV (median comp)
- $404,043
- List price
- $340,000
- Delta
- -15.85%
- Verdict
- UNDERPRICED
- Comps
- 20 within 1.0 mi
Show comp detail 12 sales within ~0.75 mi
| Address | Dist | Beds/Ba | Sqft | Sold | Price | $/sf | Match |
|---|---|---|---|---|---|---|---|
| 1152 Canuela Way | 0.18mi | 4/2.0 | 1,945 (-7%) | 4mo | $397,999 | $205 | 73 |
| 16529 Woodside Dr | 0.49mi | 4/2.0 | 2,093 (+0%) | 1mo | $295,000 | $141 | 72 |
| 1377 Dillard Creek Dr | 0.60mi | 4/2.0 | 2,081 (-0%) | 4mo | $349,900 | $168 | 64 |
| 1801 Kittredge Way | 0.64mi | 4/2.5 | 2,136 (+2%) | 2mo | $310,000 | $145 | 63 |
| 1361 Dillard Creek Dr | 0.61mi | 4/3.0 | 2,215 (+6%) | 1mo | $399,000 | $180 | 61 |
| 16860 Eastern Red | 0.59mi | 3/2.5 (-1) | 2,064 (-1%) | 4mo | $449,000 | $218 | 60 |
| 16924 Eastern Red | 0.63mi | 3/2.0 (-1) | 2,082 (-0%) | 4mo | $449,000 | $216 | 58 |
| 716 Tyronza Dr | 0.69mi | 4/2.0 | 1,980 (-5%) | 2mo | $429,000 | $217 | 53 |
| 17004 Mimbre Dr | 0.25mi | 3/2.0 (-1) | 1,813 (-13%) | 5mo | $370,990 | $205 | 53 |
| 16912 Eastern Red Blvd | 0.62mi | 3/2.0 (-1) | 1,998 (-4%) | 2mo | $427,900 | $214 | 53 |
| 1345 Elkford Ln | 0.71mi | 3/2.0 (-1) | 2,021 (-3%) | 0mo | $320,000 | $158 | 52 |
| 812 Mountain Aloe Dr | 0.72mi | 3/2.5 (-1) | 1,992 (-5%) | 0mo | $449,000 | $225 | 51 |
Match score weights: distance 35% · size 25% · config 20% · recency 20%. Top-matched comps best support the ARV.
Projected returns pro-forma
-3.0% appreciation · 0.0% rent growth · sell at horizon
- IRR
- -29.8%
- Equity multiple
- 0.04×
- Total profit
- $-91,660
- Equity at exit
- $50,695
- IRR
- -53.9%
- Equity multiple
- -0.55×
- Total profit
- $-147,314
- Equity at exit
- $29,397
Cash invested: $95,200 (down + closing). Projections, not guarantees.
Landlord ↔ Tenant lean methodology
- Overall (STATE)
- 87 Strongly Landlord-Friendly
- State Texas
- 87 Strongly Landlord-Friendly · R+5
- County
- — inherits STATE
- City
- — inherits STATE
ZIP-level market 76247
- Home prices YoY
- -13.3%
- Rents YoY
- -0.5%
- Active inventory
- 1516
- Price-to-rent
- 10.2×
Monthly cashflow live
- Estimated rent
- $2,787 high interval (Pro) →
- Mortgage (P&I)
- −$1,783
- Tax from tax record
- −$653 /mo · $7,839/yr
- Insurance
- −$142
- HOA
- −$73
- Vacancy / Maint / Mgmt
- −$585
- Net cashflow
- $-449
Break-even live
Sensitivity live
| Price | -10% $-257 | -5% $-353 | +0% $-449 | +5% $-546 | +10% $-642 |
|---|---|---|---|---|---|
| Rent | -10% $-670 | -5% $-560 | +0% $-449 | +5% $-339 | +10% $-229 |
| Rate | -1.0pp $-278 | -0.5pp $-363 | base $-449 | +0.5pp $-538 | +1.0pp $-627 |
UW: 25.0% down · 7.5% · 30yr · 1.5% tax · 5.0% vac · 8.0% maint · 8.0% mgmt
Financing live
Cash to close
- Down payment
- $85,000
- Closing costs
- $10,200
- Reserves months
- —
- Total cash needed
- —
Loan-product check · same deal, 3 products live
Conventional
25% down · 7.5% · 30yr
- Down + closing
- —
- Monthly P&I
- —
- Monthly cashflow
- —
- DSCR
- —
- Eligible?
- —
Personal DTI + credit; lowest rate.
DSCR
20% down · 8.5% · 30yr
- Down + closing
- —
- Monthly P&I
- —
- Monthly cashflow
- —
- DSCR
- —
- Eligible?
- —
No personal income docs; deal must DSCR.
Hard money
10% down · 12.0% · 12mo
- Down + closing
- —
- Monthly P&I
- —
- Monthly cashflow
- —
- DSCR
- —
- Eligible?
- —
Short-term bridge; refi at stabilization.
Rent comps 36 comps
| Address | Beds | Baths | Sqft | Rent | $/sqft | DOM | Units | Dist |
|---|---|---|---|---|---|---|---|---|
| 16933 Sophora Ave Justin, TX | 4.0 | 3.5 | 2574 | $2,999 | $1.17 | 45d | 1 | 0.04mi |
| 1237 Milfoil Dr Justin, TX | 4.0 | 3.5 | 2561 | $2,950 | $1.15 | 7d | 1 | 0.10mi |
| 1275 Western Yarrow Ave Justin, TX | 3.0 | 3.0 | 2099 | $2,750 | $1.31 | 26d | 1 | 0.14mi |
| 1133 Canuela Way Justin, TX | 4.0 | 3.0 | 2371 | $3,000 | $1.27 | 5d | 1 | 0.18mi |
| 1309 Water Canna Dr Northlake, TX | 3.0–4.0 | 2.0–3.0 | 1833 | $3,350 | $1.83 | 0d | 17 | 0.20mi |
| 1329 Water Canna Dr Northlake, TX | 3.0 | 2.0 | 1600 | $2,403 | $1.50 | 45d | 1 | 0.21mi |
| 1104 Milfoil Dr Justin, TX | 3.0 | 2.0 | 1745 | $2,500 | $1.43 | 4d | 1 | 0.23mi |
| 1336 Water Canna Dr Justin, TX | 4.0 | 3.0 | 1914 | $2,819 | $1.47 | 45d | 1 | 0.24mi |
| 1448 Sun Garden Way Justin, TX | 4.0 | 2.5 | 2514 | $3,000 | $1.19 | 18d | 1 | 0.24mi |
| 1104 Superbloom Ave Justin, TX | 4.0 | 2.0 | 1992 | $3,000 | $1.51 | 26d | 1 | 0.24mi |
| 1444 Indian Mallow Ct Northlake, TX | 4.0 | 3.0 | 2066 | $3,020 | $1.46 | 14d | 1 | 0.30mi |
| 1073 Canuela Way Fort Worth, TX | 4.0 | 3.0 | 2519 | $2,795 | $1.11 | 4d | 1 | 0.31mi |
| 1440 Native Blooms Way Northlake, TX | 3.0 | 2.0 | 1706 | $2,760 | $1.62 | 9d | 1 | 0.33mi |
| 1453 Native Blooms Way Northlake, TX | 3.0 | 2.0 | 1707 | $2,760 | $1.62 | 24d | 1 | 0.37mi |
| 1617 Rialto Way Justin, TX | 3.0 | 2.0 | 1701 | $1,940 | $1.14 | 14d | 1 | 0.45mi |
| 1713 Baxter Springs Dr Justin, TX | 4.0 | 2.0 | 2093 | $2,200 | $1.05 | 45d | 1 | 0.50mi |
| 1724 Trego Dr Justin, TX | 3.0 | 2.0 | 1710 | $1,900 | $1.11 | 45d | 1 | 0.51mi |
| 1705 Carolina Ridge Way Justin, TX | 3.0 | 2.0 | 1507 | $1,945 | $1.29 | 45d | 1 | 0.53mi |
| 1708 Sierra Meadow Ln Justin, TX | 3.0 | 2.0 | 1647 | $2,125 | $1.29 | 24d | 1 | 0.59mi |
| 16453 Severn Ln Justin, TX | 4.0 | 2.0 | 1839 | $2,400 | $1.31 | 3d | 1 | 0.61mi |
| 845 Ranchland Rd Justin, TX | 4.0 | 3.0 | 2673 | $3,400 | $1.27 | 26d | 1 | 0.63mi |
| 1724 Arbuckle Dr Justin, TX | 3.0 | 2.0 | 1647 | $1,850 | $1.12 | 20d | 1 | 0.64mi |
| 16408 Severn Ln Justin, TX | 4.0 | 2.0 | 1839 | $2,475 | $1.35 | 26d | 1 | 0.66mi |
| 1401 Elkford Ln Justin, TX | 3.0 | 2.0 | 1872 | $2,400 | $1.28 | 26d | 1 | 0.70mi |
| 16329 Severn Ln Justin, TX | 4.0 | 2.0 | 2093 | $2,550 | $1.22 | 19d | 1 | 0.77mi |
| 1325 Amazon Dr Justin, TX | 3.0 | 2.0 | 1616 | $2,050 | $1.27 | 13d | 1 | 0.80mi |
| 949 Schuberts Rd Fort Worth, TX | 3.0 | 2.0 | 2016 | $2,900 | $1.44 | 6d | 1 | 0.80mi |
| 949 Schuberts Rd Fort Worth, TX | 3.0 | 2.0 | 2016 | $2,900 | $1.44 | 3d | 1 | 0.80mi |
| 1212 Amazon Dr Justin, TX | 3.0 | 2.0 | 1507 | $1,950 | $1.29 | 45d | 1 | 0.84mi |
| 1973 Lariat Dr Justin, TX | 3.0 | 2.0 | 1507 | $1,895 | $1.26 | 20d | 1 | 0.93mi |
| 16028 Bronte Ln Justin, TX | 4.0 | 2.0 | 2127 | $2,595 | $1.22 | 26d | 1 | 1.04mi |
| 16028 Bronte Ln Justin, TX | 4.0 | 2.0 | 2099 | $2,550 | $1.21 | 45d | 1 | 1.04mi |
| 16012 Bronte Ln Justin, TX | 4.0 | 2.0 | 2142 | $2,600 | $1.21 | 45d | 1 | 1.05mi |
| 2036 Navada Way Justin, TX | 4.0 | 2.5 | 2609 | $2,260 | $0.87 | 17d | 1 | 1.25mi |
| 1224 Napier Way Justin, TX | 4.0 | 2.0 | 2185 | $2,650 | $1.21 | 45d | 1 | 1.38mi |
| 2124 Blanco Ln Justin, TX | 3.0 | 2.0 | 1647 | $1,995 | $1.21 | 0d | 1 | 1.40mi |
HOA detail
- Monthly dues
- $73 · $876/yr
- Likely covers
- pool
Listing history 25 events
-
2026-06-22days on market $340,000 Active 24 DOM
-
2026-06-18days on market $340,000 Active 21 DOM
-
2026-06-17days on market $340,000 Active 20 DOM
-
2026-06-16days on market $340,000 Active 19 DOM
-
2026-06-15days on market $340,000 Active 18 DOM
-
2026-06-13days on market $340,000 Active 16 DOM
-
2026-06-09days on market $340,000 Active 12 DOM
-
2026-06-08days on market $340,000 Active 11 DOM
-
2026-06-07days on market $340,000 Active 10 DOM
-
2026-06-04days on market $340,000 Active 7 DOM
-
2026-06-03days on market $340,000 Active 6 DOM
-
2026-06-02days on market $340,000 Active 5 DOM
-
2026-06-01days on market $340,000 Active 4 DOM
-
2026-05-31days on market $340,000 Active 3 DOM
-
2026-04-24price $340,000 960-char remark
-
2026-03-23$350,000 Active 960-char remark
-
2026-01-21status Pending
-
2026-01-20status Active Option Contract
-
2026-01-18historical
-
2026-01-18historical Active Option Contract
-
2026-01-17historical
-
2025-10-24price $350,000
-
2025-09-23price $355,000
-
2025-09-05price $366,000
-
2025-08-18$355,000 Active
ⓘ Source: listings_history table (triggers on properties + properties_extension) + one-shot
backfill from property_details.listing_events for pre-trigger history.
Tax reassessment forecast TX · Resets to sale price
- Current annual tax
- $7,839 · $653/mo
- Projected year-2 tax
- $7,839 · $653/mo
- Expected delta
- $0/yr ($0/mo · -0.0%)
ⓘ Screening estimate from a state-policy table — verify with the county assessor before closing.
Climate risk First Street
- Flood 1/10 Low FEMA zone X (unshaded) · 0% chance over 30 yrs
- Wildfire 3/10 Moderate
- Heat 8/10 Severe 7 d/yr ≥109°F today · 22 d/yr by 30 yrs out
- Wind 6/10 Major 27% chance of damaging wind over 30 yrs
- Air quality 3/10 Moderate 3 unhealthy d/yr today · 4 by 30 yrs out
Nearby sold comps map
Loading sold comps map…
Walkable amenities ~0.75 mi
Loading nearby amenities…
Taxation est. · year 1
- Rental income
- $33,439
- − Mortgage interest
- −$19,045
- − Property taxes
- −$7,839
- − Insurance
- −$1,700
- − Repairs & maintenance
- −$2,675
- − Management
- −$2,675
- − HOA
- −$876
- − Depreciation
- −$9,891
- Taxable loss
- −$11,262
- Est. tax savings @ 24.0%
- +$2,703
- After-tax cash flow
- $-2,691/yr
For passive investors: Depreciation is non-cash, so a rental often shows a tax loss while cash-flowing — sheltering income. Rental losses are passive: they offset passive income freely, and up to $25,000/yr can offset ordinary (W-2) income if you actively participate and your MAGI is under $100k (phasing out to $0 by $150k); unused losses carry forward. On sale, claimed depreciation is recaptured at up to 25%, and gains may owe capital-gains tax (a 1031 exchange can defer both). Figures are a year-1 estimate at your 24.0% rate — not tax advice; consult a CPA.
Schools (NCES district)
- District
- Northwest ISD
- NCES district ID
- 4833180
- Math proficiency
- 48% ▼ -15.00%
- Reading proficiency
- 52% ▼ -8.00%
- Median HH income
- $85,315
- Composite
- 46.15/100
- National rank
- #2504
- State rank
- #120 of 826 in TX
Livability — Fort Worth
- Score
- 80/100
- State rank
- #49
- US rank
- #1954
Category grades
Schools grade is shown separately in the Schools card above.
Census & demographics
- County
- Denton County · 901,654 people
- City population
- 911,619
- Metro
- Dallas-Fort Worth-Arlington, TX
- Population (ZIP)
- 21,726
- Household income
- $124,383
- Rent vs Own
- Severe rent burden
- 91.0
Population outlook (Denton County) Hauer SSP2
- Today (2025)
- 1,053,010 people
- By 2030
- 1,192,269 · +13.2%
- By 2040
- 1,472,920 · +39.9%
- By 2050
- 1,746,506 · +65.9%
- By 2075
- 2,358,497 · +124.0%
- By 2100
- 2,779,183 · +163.9%
Race, ethnicity, and origin ACS 2023
- Neighborhood character
- Predominantly White (74%)
- Race & ethnicity
- White 74% Hispanic / Latino 15% Two or more races 13% Black 3% Asian 3%
- Hispanic origin (detail)
- Mexican 8% Puerto Rican 4%
- Common ancestry
- Serbian 2% Romanian 1% Italian 1%
- Foreign-born
- 4% · Canada
- Languages at home
- 93% English-only · Spanish 4% Other Indo-European 1% Tagalog/Filipino 1%
Political lean MEDSL · Denton
- 2024 margin
- R (+13.2) · D 42.7% · R 55.8% · Other 1.5%
- 2008→2024 swing
- +11.0pp toward D · 2008: -24.2pp · 2024: -13.2pp
- All cycles
- 2024: R+13.2 2020: R+8.1 2016: R+20.2 2012: R+31.7 2008: R+24.2
Not yet ingested
- Civics
- —
Market trends
- HPI YoY
- ▼ -42.16%
- Current HPI
- 274.368
- Rent YoY
- ▼ -0.46%
- Metro
- Dallas-Fort Worth-Arlington, TX
- State GDP YoY
- ▲ 3.95%
- F500 in state
- 110
Industry mix (Fortune 500 HQ in TX)
| Industry | F500 HQs | Revenue |
|---|---|---|
| Energy | 16 | $1,198B |
|
||
| Technology | 5 | $198B |
|
||
| Engineering / Construction | 4 | $72B |
|
||
| Energy Services | 3 | $60B |
|
||
| Utilities | 3 | $41B |
|
||
| Healthcare | 2 | $330B |
|
||
Price history
-4.2% since first listed13 events — show timeline
- 2026-05-28 Listed $340,000 NTREIS
- 2026-05-22 Listing Removed — NTREIS
- 2026-04-24 Price Changed $340,000 NTREIS
- 2026-03-23 Listed $350,000 NTREIS
- 2026-01-21 Pending — NTREIS
- 2026-01-20 Relisted — NTREIS
- 2026-01-18 Listing Removed — NTREIS
- 2026-01-18 Contingent — NTREIS
- 2026-01-17 Listing Removed — NTREIS
- 2025-10-24 Price Changed $350,000 NTREIS
- 2025-09-23 Price Changed $355,000 NTREIS
- 2025-09-05 Price Changed $366,000 NTREIS
- 2025-08-18 Listed $355,000 NTREIS
Property tax history
+62.6%/yrLatest (2025): $7,839 · -10.4% YoY. Source: county tax records.
Cash-flow waterfall
monthlySold comps — $/sqft
last 12 mo · ≤1 miLoading sold comps…