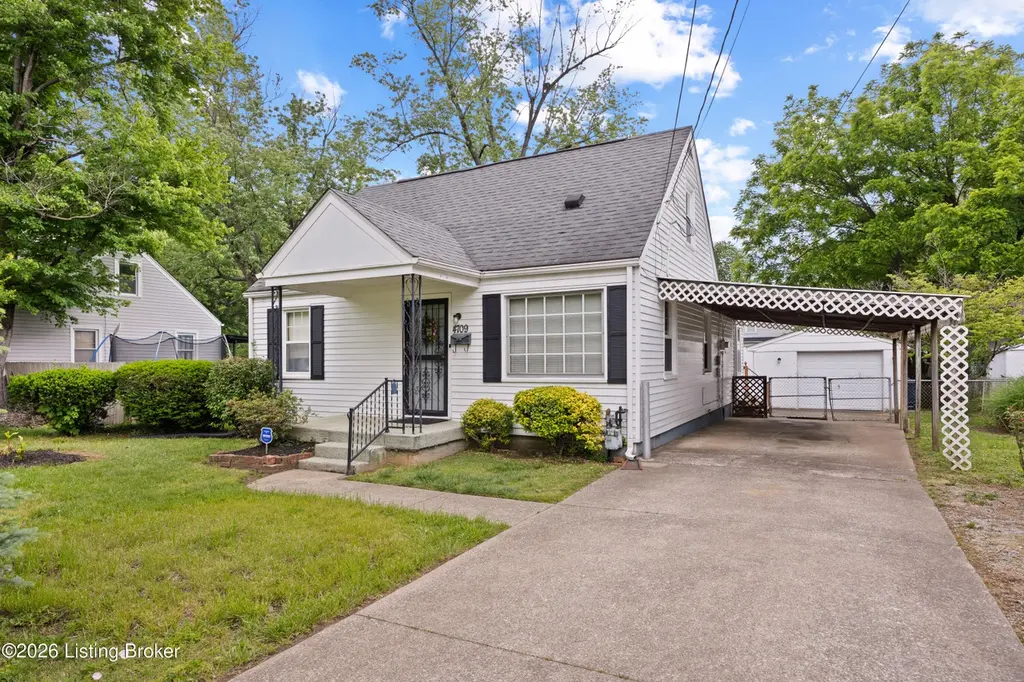
4709 Dohn Rd · Shively, KY
Flood risk 1/10 · Minimal
- FEMA flood zone
- X
- Chance of flooding over 30 yrs
- 0.0%
- Est. flood insurance / yr
- $507 – $1,088
Fire risk 1/10 · Minimal
- Est. fire insurance / yr
- $839 – $1,559
Heat risk 5/10 · Moderate
- Hot days now (above 105°F)
- 7 days/yr
- Hot days in 30 yrs
- 19 days/yr
Wind risk 2/10 · Minimal
- Chance of severe wind over 30 yrs
- 2.0%
Air-quality risk 2/10 · Minimal
- Unhealthy air days now
- 1 days/yr
- Unhealthy air days in 30 yrs
- 3 days/yr
Risk factors via First Street. Map © Google.
Why this score? — see what drove the C- grade
The composite is a weighted blend of 9 inputs, each scored 0–100. Each bar is that input's sub-score; the figure is the points it added to the 100-point composite (weight × sub-score).
- Cash flow +15.9/30.0
- ARV discount +15.0/15.0
- DSCR +4.9/10.0
- Livability +3.9/5.0
- 1% rule +3.2/10.0
- Rent growth +2.6/5.0
- Condition / age +2.5/5.0
- Schools +2.3/10.0
- Appreciation +0.0/10.0
$164,900
🖨 Deal sheet (PDF) 📄 Offer letter ✓ Due diligence
Key facts
- Living room
- Carport
- Family room
Tags
Property features AI
Finance
- Other: Listed as residential property; Directions: Rockford Ln to Dohn Rd
- HOA & community: No association fee
Exterior
- Parking: Detached garage (1 car)
- Utilities: Electricity connected; Natural gas available
- Home design: Single-family residence; Cape Cod style; Two stories
- Construction: Built in 1953; Vinyl siding and wood frame construction; Shingle roof; Crawl space foundation
- Exterior features: Chain link fencing; Lot dimensions approximately 64.5 x 140
Interior
- Kitchen: Kitchen on the first floor
- Bedrooms: Two bedrooms total; Primary bedroom on the first floor; One bedroom on the second floor
- Bathrooms: One full bathroom (on the first floor)
- Heating & cooling: Forced air heating; Heat pump providing heating and cooling
- Interior features: Six total rooms; Four closets; No basement; First-floor full bathroom; First-floor primary bedroom; Second-floor additional bedroom; Second-floor other room
- Laundry & utility: Laundry room on the first floor
Neighborhood map
What this means for you Summary
Snapshot
- This is a 2-bed/1.0-bath single-family listed at $165k.
Deal economics
- At list price, monthly cash flow is $78 ($939/yr) — positive.
- The deal already cash-flows at list — no discount required.
- To meet the 1% rule (rent ≥ 1% of price), the offer needs to be $136k (17.6% below list).
- Recommended offer: $136k (17.6% below list) — sets the bar for 1% rule.
- Cap rate 6.9% vs local median 5.3% in Shively — meaningfully above typical; check what's discounted (condition, days-on-market, listing class) to confirm the premium yield is real.
Location & tenants
- Location reads 78/100 on livability (#78 in KY, #2,520 nationally) — a middle-class / working-renter tenant base. Strengths: commute A+, cost of living A+, housing A+; Watch: crime D, employment D, amenities F.
- Jefferson County (urban): math 19% / reading 35% proficiency, ranked #121 of 165 in KY (top 73%) — low school quality limits family demand, transient renter base, plan for 1-2y turnover.
- Zoned schools: Kerrick Elementary (math 2% / reading 17%, grade F, #648 of 676 statewide, top 98%, 397 students, 70% FRL); Farnsley Middle (math 15% / reading 38%, grade F, #175 of 217 statewide, top 81%, 1,038 students, 70% FRL); Western High (math 2% / reading 12%, grade F, #248 of 254 statewide, top 98%, 869 students, 77% FRL) — zoned schools average 72% FRL vs 56% district-wide (16 pts higher); higher-poverty schools than district average — tighter screening recommended.
- Zoned-school proficiency averages 14% at this address vs 27% district-wide (-12 pts) — the specific schools serving this property underperform the Jefferson County average; the district grade overstates school quality for this exact location.
- Market conditions: Rents flat; 210 active listings in the ZIP; 13 comparable units currently listed for rent nearby; rentals leasing fast (median 13d on market — plan ~1-2 weeks tenant-placement turnaround); 2,836 units permitted in Jefferson County in 2024 (1,558 in 5+ unit buildings).
Forward outlook
- Local home prices are declining (-3.0%/yr); year-one equity from $1k of loan paydown is wiped out by about $5k of value loss. Plan a longer hold.
- Jefferson County population projected at +13% by 2050 — modest demand growth; plan on rents tracking national, not racing it.
Negotiation context
- It's been on market 44 days — a 3% lower offer ($160k) is reasonable based on typical stale-listing flexibility.
Risks & watch-outs
- Watch-outs: built in 1953 — expect roof / HVAC / electrical / plumbing capex.
- Climate carrying-cost: extreme-heat days projected 7→19/yr by 2055 (HVAC capex compounding) — expect insurance premiums to compound above CPI over the hold.
Questions for the listing agent
- It's been on market 44 days. Have you received any prior offers? Is the seller open to a 18% concession, seller financing, or rate buy-down credit?
- Built in 1953 — when were the roof, HVAC, electrical panel, plumbing, and water heater last replaced?
- Is there a deadline driving the sale (1031 exchange, divorce, estate, relocation)? That informs how much negotiation room exists.
- Crime grade is D in this area — have there been break-ins, vandalism, or insurance claims at this property in the last 3 years? What carrier currently insures it and at what premium?
- What's the average days-on-market for RENTAL listings here right now (not sales)? A rising rental-DOM trend means longer vacancies and softer asking-rent achievability than the comps imply.
- What's the recent tenant-quality profile in this submarket — average credit score on applications, eviction rate, late-payment / NSF rate, and stable-employment percentage? A property-management company in the area should have these aggregated.
- How much new for-sale + rental construction is in the pipeline within 1–3 miles? Heavy new supply typically softens prices + rents 12–24 months out; constrained supply supports both.
Investment metrics
- 1% rule
- 0.82% ✗
- Cap rate
- 6.86%
- Cash-on-cash
- 2.03%
- DSCR
- 1.09
- GRM
- 10.1
CMA / ARV
- ARV (on-the-fly)
- $231,174
- Comps found
- 12
Show comp detail 12 sales within ~0.75 mi
| Address | Dist | Beds/Ba | Sqft | Sold | Price | $/sf | Match |
|---|---|---|---|---|---|---|---|
| 4600 Kiefer Rd | 0.29mi | 3/1.0 (+1) | 1,342 (-6%) | 0mo | $200,000 | $149 | 71 |
| 2604 Elmhurst Ave | 0.45mi | 2/1.0 | 1,378 (-3%) | 4mo | $95,000 | $69 | 70 |
| 2207 Rockford Ln | 0.12mi | 3/2.0 (+1) | 1,555 (+9%) | 3mo | $149,000 | $96 | 68 |
| 1904 Lampter St | 0.47mi | 3/1.0 (+1) | 1,525 (+7%) | 2mo | $247,000 | $162 | 60 |
| 4704 Quinn Dr | 0.17mi | 3/2.0 (+1) | 1,245 (-13%) | 2mo | $250,000 | $201 | 60 |
| 4706 Quinn Dr | 0.17mi | 3/2.0 (+1) | 1,245 (-13%) | 4mo | $250,000 | $201 | 59 |
| 4930 Fielding Way | 0.57mi | 3/1.0 (+1) | 1,365 (-4%) | 3mo | $230,000 | $168 | 58 |
| 2414 Helen Ave | 0.64mi | 3/2.0 (+1) | 1,440 (+1%) | 6mo | $234,900 | $163 | 55 |
| 2509 Guelat Ave | 0.48mi | 3/1.5 (+1) | 1,304 (-9%) | 3mo | $225,500 | $173 | 54 |
| 2413 Donna Rd | 0.39mi | 3/1.0 (+1) | 1,224 (-14%) | 6mo | $100,000 | $82 | 48 |
| 5001 Graston Ave | 0.60mi | 3/1.0 (+1) | 1,262 (-12%) | 2mo | $145,000 | $115 | 46 |
| 4313 Dover Rd | 0.66mi | 3/2.0 (+1) | 1,255 (-12%) | 2mo | $194,000 | $155 | 39 |
Match score weights: distance 35% · size 25% · config 20% · recency 20%. Top-matched comps best support the ARV.
Projected returns pro-forma
-3.0% appreciation · 0.57% rent growth · sell at horizon
- IRR
- -15.6%
- Equity multiple
- 0.46×
- Total profit
- $-25,047
- Equity at exit
- $24,587
- IRR
- -11.3%
- Equity multiple
- 0.39×
- Total profit
- $-28,344
- Equity at exit
- $14,258
Cash invested: $46,172 (down + closing). Projections, not guarantees.
Landlord ↔ Tenant lean methodology
- Overall (STATE)
- 83 Strongly Landlord-Friendly
- State Kentucky
- 83 Strongly Landlord-Friendly · R+16
- County
- — inherits STATE
- City
- — inherits STATE
ZIP-level market 40216
- Rents YoY
- 0.6%
- Active inventory
- 210
- Price-to-rent
- 10.1×
Monthly cashflow live
- Estimated rent
- $1,359 high interval (Pro) →
- Mortgage (P&I)
- −$865
- Tax from tax record
- −$62 /mo · $738/yr
- Insurance
- −$69
- HOA
- −$0
- Vacancy / Maint / Mgmt
- −$285
- Net cashflow
- $78
Break-even live
Sensitivity live
| Price | -10% $172 | -5% $125 | +0% $78 | +5% $32 | +10% $-15 |
|---|---|---|---|---|---|
| Rent | -10% $-29 | -5% $25 | +0% $78 | +5% $132 | +10% $186 |
| Rate | -1.0pp $161 | -0.5pp $120 | base $78 | +0.5pp $36 | +1.0pp $-8 |
UW: 25.0% down · 7.5% · 30yr · 1.5% tax · 5.0% vac · 8.0% maint · 8.0% mgmt
Financing live
Cash to close
- Down payment
- $41,225
- Closing costs
- $4,947
- Reserves months
- —
- Total cash needed
- —
Loan-product check · same deal, 3 products live
Conventional
25% down · 7.5% · 30yr
- Down + closing
- —
- Monthly P&I
- —
- Monthly cashflow
- —
- DSCR
- —
- Eligible?
- —
Personal DTI + credit; lowest rate.
DSCR
20% down · 8.5% · 30yr
- Down + closing
- —
- Monthly P&I
- —
- Monthly cashflow
- —
- DSCR
- —
- Eligible?
- —
No personal income docs; deal must DSCR.
Hard money
10% down · 12.0% · 12mo
- Down + closing
- —
- Monthly P&I
- —
- Monthly cashflow
- —
- DSCR
- —
- Eligible?
- —
Short-term bridge; refi at stabilization.
Rent comps 13 comps
| Address | Beds | Baths | Sqft | Rent | $/sqft | DOM | Units | Dist |
|---|---|---|---|---|---|---|---|---|
| 2304 Rockford Ln Louisville, KY | 3.0 | 1.5 | 1400 | $1,620 | $1.16 | 25d | 1 | 0.20mi |
| 1840 Kendall Ln Apt 25 Louisville, KY | 2.0 | 1.0 | 952 | $1,250 | $1.31 | 25d | 1 | 0.64mi |
| 4330 Bayberry Dr Louisville, KY | 3.0 | 1.0 | 1134 | $1,395 | $1.23 | 25d | 1 | 0.64mi |
| 4700 Walnut Grove Ave Unit 1 Louisville, KY | 2.0 | 1.0 | 900 | $799 | $0.89 | 25d | 1 | 0.70mi |
| 4414 Tara Gale Ct Louisville, KY | 3.0 | 1.5 | 1000 | $1,450 | $1.45 | 5d | 1 | 0.75mi |
| 1602 Clover St Louisville, KY | 2.0 | 1.5 | 867 | $1,060 | $1.22 | 3d | 5 | 0.78mi |
| 4203 Searcy Dr Louisville, KY | 3.0 | 2.0 | 980 | $1,550 | $1.58 | 18d | 1 | 0.84mi |
| 5700 Bruns Dr Louisville, KY | 2.0–3.0 | 2.0 | 1118 | $1,153 | $1.03 | 13d | 1 | 0.91mi |
| 1632 Stafford Ave Louisville, KY | 3.0 | 1.0 | 1152 | $1,450 | $1.26 | 18d | 1 | 1.03mi |
| 3222 Patricia Dr Louisville, KY | 3.0 | 1.0 | 936 | $1,590 | $1.70 | 3d | 1 | 1.14mi |
| 4319 Sanders Ln Louisville, KY | 2.0 | 1.0 | 950 | $925 | $0.97 | 5d | 1 | 1.17mi |
| 3401 Shanks Ln Louisville, KY | 1.0–2.0 | 1.0 | 875 | $1,079 | $1.23 | 3d | 3 | 1.35mi |
| 1837 Lower Hunters Trce Louisville, KY | 3.0 | 1.0 | 1335 | $1,850 | $1.39 | 5d | 1 | 1.50mi |
Listing history 15 events
-
2026-06-21days on market $164,900 Active 44 DOM
-
2026-06-18days on market $164,900 Active 41 DOM
-
2026-06-17days on market $164,900 Active 40 DOM
-
2026-06-16days on market $164,900 Active 39 DOM
-
2026-06-15days on market $164,900 Active 38 DOM
-
2026-06-13pricedays on market $164,900 Active 36 DOM
-
2026-06-10days on market $169,900 Active 33 DOM
-
2026-06-09days on market $169,900 Active 32 DOM
-
2026-06-08days on market $169,900 Active 31 DOM
-
2026-06-07days on market $169,900 Active 30 DOM
-
2026-06-03days on market $169,900 Active 26 DOM
-
2026-06-02days on market $169,900 Active 25 DOM
-
2026-06-01days on market $169,900 Active 24 DOM
-
2026-05-31days on market $169,900 Active 23 DOM
-
2026-05-08$175,000 Active
ⓘ Source: listings_history table (triggers on properties + properties_extension) + one-shot
backfill from property_details.listing_events for pre-trigger history.
Tax reassessment forecast KY · Resets to sale price
- Current annual tax
- $738 · $62/mo
- Projected year-2 tax
- $1,418 · $118/mo
- Expected delta
- +$680/yr (+$57/mo · 92.1%)
ⓘ Screening estimate from a state-policy table — verify with the county assessor before closing.
Climate risk First Street
- Flood 1/10 Low FEMA zone X · 0% chance over 30 yrs
- Wildfire 1/10 Low
- Heat 5/10 Major 7 d/yr ≥105°F today · 19 d/yr by 30 yrs out
- Wind 2/10 Low 2% chance of damaging wind over 30 yrs
- Air quality 2/10 Low 1 unhealthy d/yr today · 3 by 30 yrs out
Nearby sold comps map
Loading sold comps map…
Walkable amenities ~0.75 mi
Loading nearby amenities…
Taxation est. · year 1
- Rental income
- $16,303
- − Mortgage interest
- −$9,237
- − Property taxes
- −$738
- − Insurance
- −$824
- − Repairs & maintenance
- −$1,304
- − Management
- −$1,304
- − Depreciation
- −$4,797
- Taxable loss
- −$1,903
- Est. tax savings @ 24.0%
- +$457
- After-tax cash flow
- $1,396/yr
For passive investors: Depreciation is non-cash, so a rental often shows a tax loss while cash-flowing — sheltering income. Rental losses are passive: they offset passive income freely, and up to $25,000/yr can offset ordinary (W-2) income if you actively participate and your MAGI is under $100k (phasing out to $0 by $150k); unused losses carry forward. On sale, claimed depreciation is recaptured at up to 25%, and gains may owe capital-gains tax (a 1031 exchange can defer both). Figures are a year-1 estimate at your 24.0% rate — not tax advice; consult a CPA.
Schools (NCES district)
- District
- Jefferson County
- NCES district ID
- 2102990
- Math proficiency
- 19% ▼ -17.00%
- Reading proficiency
- 35% ▼ -11.00%
- Median HH income
- $47,885
- Composite
- 23.45/100
- National rank
- #7884
- State rank
- #121 of 165 in KY
Livability — Shively
- Score
- 78/100
- State rank
- #78
- US rank
- #2520
Category grades
Schools grade is shown separately in the Schools card above.
Census & demographics
- Census place
- Shively, KY
- County
- Jefferson County · 790,184 people
- Metro
- Louisville/Jefferson County, KY-IN
- Population (ZIP)
- 44,047
- Household income
- $56,441
- Rent vs Own
- Severe rent burden
- 1434.0
Population outlook (Jefferson County) Hauer SSP2
- Today (2025)
- 823,112 people
- By 2030
- 849,343 · +3.2%
- By 2040
- 895,696 · +8.8%
- By 2050
- 933,630 · +13.4%
- By 2075
- 1,028,262 · +24.9%
- By 2100
- 1,072,675 · +30.3%
Race, ethnicity, and origin ACS 2023
- Neighborhood character
- Diverse neighborhood (Simpson 0.60)
- Race & ethnicity
- Black 45% White 43% Hispanic / Latino 6% Two or more races 6% Asian 1%
- Hispanic origin (detail)
- Mexican 2% Cuban 3%
- Common ancestry
- Lithuanian 1% Italian 1% Slovak 1%
- Foreign-born
- 8% · Canada, Vietnam
- Languages at home
- 89% English-only · Spanish 7% French/Haitian/Cajun 1% Arabic 1%
Political lean MEDSL · Jefferson
- 2024 margin
- D (+16.6) · D 57.4% · R 40.9% · Other 1.7%
- 2008→2024 swing
- +4.5pp toward D · 2008: 12.0pp · 2024: 16.6pp
- All cycles
- 2024: D+16.6 2020: D+20.1 2016: D+13.3 2012: D+11.1 2008: D+12.0
Not yet ingested
- Civics
- —
Market trends
- HPI YoY
- ▼ -234.72%
- Current HPI
- 269.5447
- Rent YoY
- ▲ 0.57%
- Metro
- Louisville/Jefferson County, KY-IN
- State GDP YoY
- ▲ 1.81%
- F500 in state
- 4
Industry mix (Fortune 500 HQ in KY)
| Industry | F500 HQs | Revenue |
|---|---|---|
| Healthcare | 1 | $118B |
|
||
| Food / Beverage | 1 | $7B |
|
||
Price history
1 event — show timeline
- 2026-05-08 Listed $175,000 Metro Search MLS
Property tax history
+5.0%/yrLatest (2025): $738 · -5.8% YoY. Source: county tax records.
Cash-flow waterfall
monthlySold comps — $/sqft
last 12 mo · ≤1 miLoading sold comps…