393 NE 9th St · Carbon Hill, AL
Flood risk 1/10 · Minimal
- FEMA flood zone
- X (unshaded)
- Chance of flooding over 30 yrs
- 0.0%
- Est. flood insurance / yr
- $507 – $1,088
Fire risk 4/10 · Minor
- Est. fire insurance / yr
- $916 – $1,700
Heat risk 6/10 · Moderate
- Hot days now (above 106°F)
- 7 days/yr
- Hot days in 30 yrs
- 20 days/yr
Wind risk 6/10 · Moderate
- Chance of severe wind over 30 yrs
- 27.0%
Air-quality risk 2/10 · Minimal
- Unhealthy air days now
- 2 days/yr
- Unhealthy air days in 30 yrs
- 2 days/yr
Risk factors via First Street. Map © Google.
Why this score? — see what drove the D- grade
The composite is a weighted blend of 9 inputs, each scored 0–100. Each bar is that input's sub-score; the figure is the points it added to the 100-point composite (weight × sub-score).
- Cash flow +10.5/30.0
- Appreciation +8.2/10.0
- Condition / age +4.0/5.0
- 1% rule +3.1/10.0
- Livability +3.1/5.0
- DSCR +3.0/10.0
- Rent growth +2.5/5.0
- Schools +2.2/10.0
- ARV discount +0.0/15.0
$119,000
🖨 Deal sheet (PDF) 📄 Offer letter ✓ Due diligence
Listing remarks
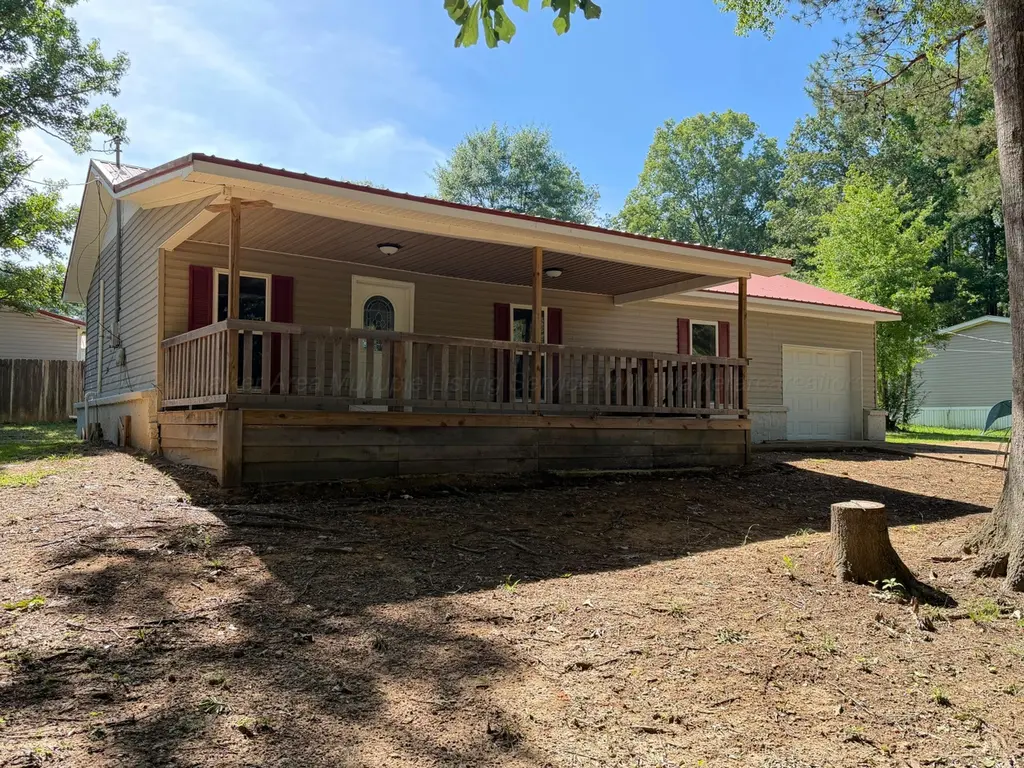
Charming and move-in ready, this 3BR, 1.5BA home offers approx 1,300 sq ft of living space on a 0.03 acre lot. Recent updates include a remodeled kitchen and bathroom, along with new flooring throughout. Features include a large porch, one car garage, and conveniently located to Bill & Sons grocery store. Perfect for first time buyers, downsizers, or investors.
Key facts
- Remodeled bathroom
- Remodeled kitchen
- Large porch
Tags
Property features AI
Exterior
- Parking: Attached garage (1 car); Carport; Attached parking
- Home design: Single-family residential property; Residential property type
- Construction: Vinyl siding
- Exterior features: Front porch
Interior
- Flooring: Carpet; Laminate
- Heating & cooling: Central heating (electric); Central air conditioning (electric)
- Interior features: Carpet and laminate flooring; Porch (listed under exterior but accessed from interior/exterior transition)
Neighborhood map
What this means for you Summary
Snapshot
- This is a 3-bed/2.0-bath single-family listed at $119k. Condition is rated good.
Deal economics
- At list price, monthly cash flow is $-60 ($-720/yr) — negative.
- To cash-flow at today's rent, offer at most $110k (7.3% below list).
- To meet the 1% rule (rent ≥ 1% of price), the offer needs to be $96k (18.9% below list).
- Recommended offer: $96k (18.9% below list) — sets the bar for 1% rule.
Location & tenants
- Location reads 62/100 on livability (#208 in AL) — a middle-class / working-renter tenant base. Strengths: crime A+, cost of living A+, housing A+; Watch: health & safety D, amenities F, commute F.
- Walker County (rural): math 13% / reading 39% proficiency, ranked #89 of 129 in AL (top 69%) — low school quality limits family demand, transient renter base, plan for 1-2y turnover.
- Zoned schools: Carbon Hill Elementaryjunior High School (math 13% / reading 31%, grade F, #442 of 627 statewide, top 72%, 492 students, 70% FRL) — zoned schools average 70% FRL vs 53% district-wide (17 pts higher); higher-poverty schools than district average — tighter screening recommended.
- Market conditions: 24 active listings in the ZIP; 1 comparable units currently listed for rent nearby; 36 units permitted in Walker County in 2024 (0 in 5+ unit buildings).
Forward outlook
- In year one you build about $9k of equity ($823 loan paydown + $8k appreciation (6.5% local appreciation)).
- Walker County population projected at -21% by 2050 — secular population decline; favor cash flow + early exit over multi-decade hold.
- At projected returns (6.5% appreciation + 3.0% rent growth), your $33k cash investment doubles in ~4 years — after that, you're playing with house money.
- By year 5, paydown + projected appreciation supports a ~$38k cash-out refi (75% LTV) — recoverable capital for the next deal without selling this one.
Negotiation context
- Only 2 days on market — expect competitive offers; lowballing is unlikely to land.
Risks & watch-outs
- Climate carrying-cost: major wind risk, 27% chance of damaging wind over 30y; extreme-heat days projected 7→20/yr by 2055 (HVAC capex compounding) — expect insurance premiums to compound above CPI over the hold.
Questions for the listing agent
- What do current leases actually rent for vs. the listed asking? Can we see a recent rent roll and the last 12 months of T-12 income?
- Is there a deadline driving the sale (1031 exchange, divorce, estate, relocation)? That informs how much negotiation room exists.
- Schools are F-rated, which usually means shorter tenancies and higher turnover. Who's the typical renter profile here, and what's been the actual vacancy rate?
- The area grade is low — what's the realistic commute time and amenity access for the typical tenant pool here? Any planned neighborhood developments (good or bad) we should know about?
- What's the average days-on-market for RENTAL listings here right now (not sales)? A rising rental-DOM trend means longer vacancies and softer asking-rent achievability than the comps imply.
- What's the recent tenant-quality profile in this submarket — average credit score on applications, eviction rate, late-payment / NSF rate, and stable-employment percentage? A property-management company in the area should have these aggregated.
- How much new for-sale + rental construction is in the pipeline within 1–3 miles? Heavy new supply typically softens prices + rents 12–24 months out; constrained supply supports both.
Investment metrics
- 1% rule
- 0.81% ✗
- Cap rate
- 5.69%
- Cash-on-cash
- -2.16%
- DSCR
- 0.90
- GRM
- 10.3
CMA / ARV
- ARV (on-the-fly)
- $98,800
- Comps found
- 1
Show comp detail 1 sale within ~0.75 mi
| Address | Dist | Beds/Ba | Sqft | Sold | Price | $/sf | Match |
|---|---|---|---|---|---|---|---|
| 501 4th Ave | 0.58mi | 3/1.0 | 1,323 (+2%) | 14mo | $100,000 | $76 | 54 |
Match score weights: distance 35% · size 25% · config 20% · recency 20%. Top-matched comps best support the ARV.
Projected returns pro-forma
6.48% appreciation · 3.0% rent growth · sell at horizon
- IRR
- 14.8%
- Equity multiple
- 2.02×
- Total profit
- $33,965
- Equity at exit
- $78,442
- IRR
- 14.9%
- Equity multiple
- 4.06×
- Total profit
- $102,124
- Equity at exit
- $145,498
Cash invested: $33,320 (down + closing). Projections, not guarantees.
Landlord ↔ Tenant lean methodology
- Overall (STATE)
- 90 Strongly Landlord-Friendly
- State Alabama
- 90 Strongly Landlord-Friendly · R+15
- County
- — inherits STATE
- City
- — inherits STATE
ZIP-level market 35549
- Home prices YoY
- 3.9%
- Active inventory
- 24
- Price-to-rent
- 10.3×
Monthly cashflow live
- Estimated rent
- $965 medium interval (Pro) →
- Mortgage (P&I)
- −$624
- Tax est. 1.5%
- −$149 /mo · $1,785/yr
- Insurance
- −$50
- HOA
- −$0
- Vacancy / Maint / Mgmt
- −$203
- Net cashflow
- $-60
Break-even live
Sensitivity live
| Price | -10% $22 | -5% $-19 | +0% $-60 | +5% $-101 | +10% $-142 |
|---|---|---|---|---|---|
| Rent | -10% $-136 | -5% $-98 | +0% $-60 | +5% $-22 | +10% $16 |
| Rate | -1.0pp $0 | -0.5pp $-30 | base $-60 | +0.5pp $-91 | +1.0pp $-122 |
UW: 25.0% down · 7.5% · 30yr · 1.5% tax · 5.0% vac · 8.0% maint · 8.0% mgmt
Financing live
Cash to close
- Down payment
- $29,750
- Closing costs
- $3,570
- Reserves months
- —
- Total cash needed
- —
Loan-product check · same deal, 3 products live
Conventional
25% down · 7.5% · 30yr
- Down + closing
- —
- Monthly P&I
- —
- Monthly cashflow
- —
- DSCR
- —
- Eligible?
- —
Personal DTI + credit; lowest rate.
DSCR
20% down · 8.5% · 30yr
- Down + closing
- —
- Monthly P&I
- —
- Monthly cashflow
- —
- DSCR
- —
- Eligible?
- —
No personal income docs; deal must DSCR.
Hard money
10% down · 12.0% · 12mo
- Down + closing
- —
- Monthly P&I
- —
- Monthly cashflow
- —
- DSCR
- —
- Eligible?
- —
Short-term bridge; refi at stabilization.
Rent comps 1 comps
| Address | Beds | Baths | Sqft | Rent | $/sqft | DOM | Units | Dist |
|---|---|---|---|---|---|---|---|---|
| 812 4th Ave NE Carbon Hill, AL | 3.0 | 1.0 | 1075 | $965 | $0.90 | 3d | 1 | 0.32mi |
Listing history 2 events
-
2026-06-22remarks 365-char remark
-
2026-06-22$119,000 Active 2 DOM
ⓘ Source: listings_history table (triggers on properties + properties_extension) + one-shot
backfill from property_details.listing_events for pre-trigger history.
Climate risk First Street
- Flood 1/10 Low FEMA zone X (unshaded) · 0% chance over 30 yrs
- Wildfire 4/10 Moderate
- Heat 6/10 Major 7 d/yr ≥106°F today · 20 d/yr by 30 yrs out
- Wind 6/10 Major 27% chance of damaging wind over 30 yrs
- Air quality 2/10 Low 2 unhealthy d/yr today · 2 by 30 yrs out
Nearby sold comps map
Loading sold comps map…
Walkable amenities ~0.75 mi
Loading nearby amenities…
Taxation est. · year 1
- Rental income
- $11,580
- − Mortgage interest
- −$6,666
- − Property taxes
- −$1,785
- − Insurance
- −$595
- − Repairs & maintenance
- −$926
- − Management
- −$926
- − Depreciation
- −$3,462
- Taxable loss
- −$2,780
- Est. tax savings @ 24.0%
- +$667
- After-tax cash flow
- $-53/yr
For passive investors: Depreciation is non-cash, so a rental often shows a tax loss while cash-flowing — sheltering income. Rental losses are passive: they offset passive income freely, and up to $25,000/yr can offset ordinary (W-2) income if you actively participate and your MAGI is under $100k (phasing out to $0 by $150k); unused losses carry forward. On sale, claimed depreciation is recaptured at up to 25%, and gains may owe capital-gains tax (a 1031 exchange can defer both). Figures are a year-1 estimate at your 24.0% rate — not tax advice; consult a CPA.
Condition & rehab AI · 13 photos
This move-in ready home features recent updates including a remodeled kitchen and bathroom, new flooring, and a fresh exterior. It's in good condition with minor maintenance needed for painting and landscaping.
Value-add opportunities
- Resale paint exterior — Fresh paint enhances curb appeal and home value
- Both landscaping — Well-maintained landscaping improves curb appeal and rental value
Renovation cost estimate screening
Value-add ROI direction
- Resale paint exterior — Fresh paint enhances curb appeal and home value ↑
- Both landscaping — Well-maintained landscaping improves curb appeal and rental value ↑
ⓘ Cost ranges are severity-bucket heuristics (US national rule-of-thumb). Get contractor quotes + a written scope before underwriting a rehab budget.
Schools (NCES district)
- District
- Walker County
- NCES district ID
- 0103450
- Math proficiency
- 13% ▼ -28.00%
- Reading proficiency
- 39% ▼ -5.00%
- Median HH income
- $36,664
- Composite
- 21.51/100
- National rank
- #8321
- State rank
- #89 of 129 in AL
Livability — Carbon Hill
- Score
- 62/100
- State rank
- #208
- US rank
- #16127
Category grades
Schools grade is shown separately in the Schools card above.
Census & demographics
- Census place
- Carbon Hill, AL
- Population (ZIP)
- 3,018
Population outlook (Walker County) Hauer SSP2
- Today (2025)
- 61,037 people
- By 2030
- 58,391 · -4.3%
- By 2040
- 53,080 · -13.0%
- By 2050
- 48,031 · -21.3%
- By 2075
- 37,799 · -38.1%
- By 2100
- 29,001 · -52.5%
Race, ethnicity, and origin ACS 2023
- Neighborhood character
- Predominantly White (86%)
- Race & ethnicity
- White 86% Black 8% Two or more races 3% Hispanic / Latino 2%
- Common ancestry
- Romanian 1% Slovak 1% Italian 1%
- Foreign-born
- 1% · Canada
- Languages at home
- 97% English-only · Spanish 2% Russian/Polish/Slavic 1%
Political lean MEDSL · Walker
- 2024 margin
- Solid R (+71.8) · D 13.8% · R 85.6%
- 2008→2024 swing
- -25.4pp toward R · 2008: -46.4pp · 2024: -71.8pp
- All cycles
- 2024: R+71.8 2020: R+67.9 2016: R+67.4 2012: R+52.9 2008: R+46.4
Not yet ingested
- Civics
- —
Market trends
- HPI YoY
- ▲ 6.48%
- Current HPI
- 172.3523
- Rent YoY
- —
- Metro
- —
- State GDP YoY
- ▲ 2.94%
- F500 in state
- 4
Industry mix (Fortune 500 HQ in AL)
| Industry | F500 HQs | Revenue |
|---|---|---|
| Financial Services | 1 | $8B |
|
||
| Healthcare | 1 | $5B |
|
||
Price history
1 event — show timeline
- 2026-06-19 Listed $119,000 Walker County Area MLS
Cash-flow waterfall
monthlySold comps — $/sqft
last 12 mo · ≤1 miLoading sold comps…