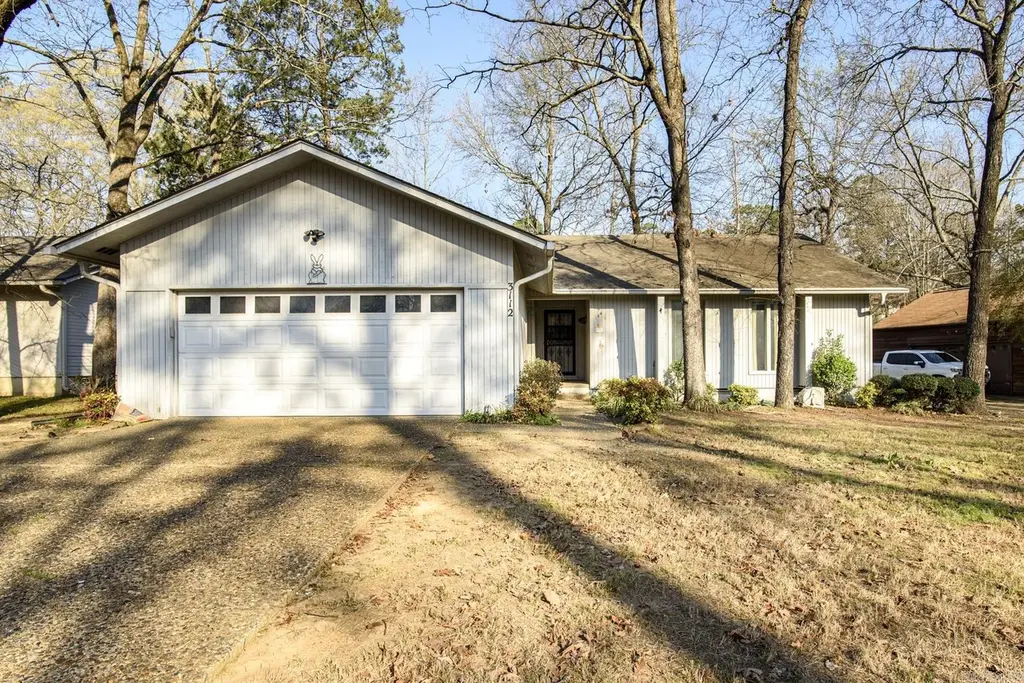
3112 Valley Park Dr · Little Rock, AR
Flood risk 4/10 · Minor
- FEMA flood zone
- X (unshaded)
- Chance of flooding over 30 yrs
- 0.2%
- Est. flood insurance / yr
- $507 – $1,088
Fire risk 3/10 · Minor
- Est. fire insurance / yr
- $1,499 – $2,785
Heat risk 7/10 · Major
- Hot days now (above 110°F)
- 7 days/yr
- Hot days in 30 yrs
- 19 days/yr
Wind risk 4/10 · Minor
- Chance of severe wind over 30 yrs
- 9.0%
Air-quality risk 2/10 · Minimal
- Unhealthy air days now
- 0 days/yr
- Unhealthy air days in 30 yrs
- 1 days/yr
Risk factors via First Street. Map © Google.
Why this score? — see what drove the D grade
The composite is a weighted blend of 9 inputs, each scored 0–100. Each bar is that input's sub-score; the figure is the points it added to the 100-point composite (weight × sub-score).
- Cash flow +14.1/30.0
- ARV discount +10.2/15.0
- DSCR +4.3/10.0
- Livability +3.7/5.0
- 1% rule +3.0/10.0
- Rent growth +2.5/5.0
- Condition / age +2.5/5.0
- Schools +2.1/10.0
- Appreciation +0.0/10.0
$275,000
🖨 Deal sheet (PDF) 📄 Offer letter ✓ Due diligence
Listing remarks
One-level home in a highly desirable location! Situated on a level lot, this 3-bedroom, 2-bath home features a formal dining room, a spacious living area with a vaulted ceiling, and a bright breakfast nook. Sliding glass doors lead to a lovely screened-in back porch—perfect for relaxing or entertaining. With great bones and plenty of potential, this home is ready for your personal touch. Being sold as-is. Agents see remarks.
Key facts
- 9,583 sq ft lot
- 2 garage spots
- Built 1979
Property features AI
Finance
- Financial info: Potential financing: conventional loan or cash
Exterior
- Parking: Garage for 2 cars
- Utilities: Public sewer; Public water; Municipal electric (Entergy); Natural gas
- Home design: Frame exterior
- Construction: Crawl space foundation; Architectural shingle roof
- Exterior features: Screened porch; Fully fenced yard; Wood fence; Paved road; Level lot; Inside city limits; In subdivision
Interior
- Kitchen: Electric range; Wall oven; Dishwasher; Disposal; Pantry; Refrigerator stays
- Flooring: Carpet; Vinyl; Tile
- Bathrooms: 2 full bathrooms
- Heating & cooling: Central heat (gas); Central cooling (electric)
- Interior features: Washer stays; Dryer stays; Floored attic; Walk-in closet(s); Wood-burning fireplace with gas starter; Carpet, vinyl and tile flooring; Den/Family room
- Laundry & utility: Washer stays; Dryer stays
Neighborhood map
What this means for you Summary
Snapshot
- This is a 3-bed/2.0-bath single-family listed at $275k.
Deal economics
- At list price, monthly cash flow is $42 ($503/yr) — positive.
- The deal already cash-flows at list — no discount required.
- To meet the 1% rule (rent ≥ 1% of price), the offer needs to be $220k (20.0% below list).
- Recommended offer: $220k (20.0% below list) — sets the bar for 1% rule.
- Cap rate 6.5% vs local median 4.1% in Little Rock — top-decile yield for the area; either an underpriced asset or a hidden risk that comps aren't pricing in. Stress-test before assuming the spread holds.
Location & tenants
- Location reads 73/100 on livability (#22 in AR) — a middle-class / working-renter tenant base. Strengths: commute A+, cost of living A+, housing A+; Watch: crime F.
- Little Rock School District (urban): math 23% / reading 26% proficiency, ranked #183 of 238 in AR (top 77%) — low school quality limits family demand, transient renter base, plan for 1-2y turnover; 69% free/reduced lunch — lower-income household profile, screen leases tightly.
- Zoned schools: Don Roberts Elementary School (math 68% / reading 65%, grade B+, #19 of 454 statewide, top 4%, 1,004 students, 23% FRL) — zoned schools average 23% FRL vs 69% district-wide (46 pts lower); this property's tenant base skews higher-income than the district average.
- Zoned-school proficiency averages 66% at this address vs 24% district-wide (+42 pts) — the actual schools serving this property are materially stronger than the Little Rock School District average implies; a family-tenant draw the district grade alone would hide.
- Market conditions: 65 active listings in the ZIP; 9 comparable units currently listed for rent nearby; rentals at typical pace (median 25d on market — plan ~3-4 weeks tenant-placement turnaround); high-income renter base; 1,006 units permitted in Pulaski County in 2024 (0 in 5+ unit buildings).
Forward outlook
- Local home prices are declining (-3.0%/yr); year-one equity from $2k of loan paydown is wiped out by about $8k of value loss. Plan a longer hold.
- Pulaski County population projected at +6% by 2050 — modest demand growth; plan on rents tracking national, not racing it.
Negotiation context
- It's been on market 73 days — a 6% lower offer ($258k) is reasonable based on typical stale-listing flexibility.
Risks & watch-outs
- Climate carrying-cost: extreme-heat days projected 7→19/yr by 2055 (HVAC capex compounding) — expect insurance premiums to compound above CPI over the hold.
Questions for the listing agent
- It's been on market 73 days. Have you received any prior offers? Is the seller open to a 20% concession, seller financing, or rate buy-down credit?
- Built in 1979 — when were the roof, HVAC, electrical panel, plumbing, and water heater last replaced?
- Why hasn't it sold? Are there any deal-killer items the seller is aware of (foundation, flood, title, zoning, code violations)?
- Is there a deadline driving the sale (1031 exchange, divorce, estate, relocation)? That informs how much negotiation room exists.
- Crime grade is F in this area — have there been break-ins, vandalism, or insurance claims at this property in the last 3 years? What carrier currently insures it and at what premium?
- The area grade is low — what's the realistic commute time and amenity access for the typical tenant pool here? Any planned neighborhood developments (good or bad) we should know about?
- What's the average days-on-market for RENTAL listings here right now (not sales)? A rising rental-DOM trend means longer vacancies and softer asking-rent achievability than the comps imply.
- What's the recent tenant-quality profile in this submarket — average credit score on applications, eviction rate, late-payment / NSF rate, and stable-employment percentage? A property-management company in the area should have these aggregated.
- How much new for-sale + rental construction is in the pipeline within 1–3 miles? Heavy new supply typically softens prices + rents 12–24 months out; constrained supply supports both.
Investment metrics
- 1% rule
- 0.80% ✗
- Cap rate
- 6.48%
- Cash-on-cash
- 0.65%
- DSCR
- 1.03
- GRM
- 10.4
CMA / ARV
- ARV (on-the-fly)
- $292,448
- Comps found
- 12
Show comp detail 12 sales within ~0.75 mi
| Address | Dist | Beds/Ba | Sqft | Sold | Price | $/sf | Match |
|---|---|---|---|---|---|---|---|
| 3112 Valley Park Dr | 0.00mi | 3/2.0 | 1,924 (0%) | 1mo | $255,000 | $133 | 100 |
| 4 Liberty Bell Ct | 0.09mi | 3/2.0 | 1,976 (+3%) | 9mo | $320,000 | $162 | 84 |
| 2914 Valley Park Dr | 0.12mi | 3/2.0 | 1,863 (-3%) | 9mo | $315,000 | $169 | 81 |
| 1804 Sawgrass Dr | 0.29mi | 3/2.0 | 2,011 (+4%) | 3mo | $335,000 | $167 | 76 |
| 20 White Willow Ct | 0.47mi | 4/2.0 (+1) | 1,986 (+3%) | 9mo | $290,000 | $146 | 60 |
| 13209 Pleasant Forest Dr | 0.70mi | 3/2.0 | 1,985 (+3%) | 3mo | $275,000 | $139 | 59 |
| 1 White Aspen Ct | 0.63mi | 3/2.0 | 1,775 (-8%) | 4mo | $245,000 | $138 | 55 |
| 4 White Willow Ct | 0.56mi | 3/2.5 | 1,752 (-9%) | 3mo | $270,000 | $154 | 55 |
| 2201 Huntleigh Ct | 0.55mi | 3/2.5 | 2,092 (+9%) | 6mo | $319,500 | $153 | 53 |
| 13115 Pleasant Forest Dr | 0.73mi | 3/2.5 | 2,156 (+12%) | 2mo | $280,000 | $130 | 43 |
| 2203 Windsor Ct | 0.67mi | 3/2.5 | 2,137 (+11%) | 8mo | $325,000 | $152 | 42 |
| 5 Flourite Cv | 0.67mi | 3/2.0 | 1,646 (-14%) | 9mo | $208,280 | $127 | 37 |
Match score weights: distance 35% · size 25% · config 20% · recency 20%. Top-matched comps best support the ARV.
Projected returns pro-forma
-3.0% appreciation · 3.0% rent growth · sell at horizon
- IRR
- -15.3%
- Equity multiple
- 0.45×
- Total profit
- $-41,985
- Equity at exit
- $41,003
- IRR
- -6.8%
- Equity multiple
- 0.56×
- Total profit
- $-33,498
- Equity at exit
- $23,777
Cash invested: $77,000 (down + closing). Projections, not guarantees.
Landlord ↔ Tenant lean methodology
- Overall (STATE)
- 92 Strongly Landlord-Friendly
- State Arkansas
- 92 Strongly Landlord-Friendly · R+14
- County
- — inherits STATE
- City
- — inherits STATE
ZIP-level market 72212
- Active inventory
- 65
- Price-to-rent
- 10.4×
Monthly cashflow live
- Estimated rent
- $2,201 high interval (Pro) →
- Mortgage (P&I)
- −$1,442
- Tax from tax record
- −$140 /mo · $1,679/yr
- Insurance
- −$115
- HOA
- −$0
- Vacancy / Maint / Mgmt
- −$462
- Net cashflow
- $42
Break-even live
Sensitivity live
| Price | -10% $198 | -5% $120 | +0% $42 | +5% $-36 | +10% $-114 |
|---|---|---|---|---|---|
| Rent | -10% $-132 | -5% $-45 | +0% $42 | +5% $129 | +10% $216 |
| Rate | -1.0pp $180 | -0.5pp $112 | base $42 | +0.5pp $-29 | +1.0pp $-102 |
UW: 25.0% down · 7.5% · 30yr · 1.5% tax · 5.0% vac · 8.0% maint · 8.0% mgmt
Financing live
Cash to close
- Down payment
- $68,750
- Closing costs
- $8,250
- Reserves months
- —
- Total cash needed
- —
Loan-product check · same deal, 3 products live
Conventional
25% down · 7.5% · 30yr
- Down + closing
- —
- Monthly P&I
- —
- Monthly cashflow
- —
- DSCR
- —
- Eligible?
- —
Personal DTI + credit; lowest rate.
DSCR
20% down · 8.5% · 30yr
- Down + closing
- —
- Monthly P&I
- —
- Monthly cashflow
- —
- DSCR
- —
- Eligible?
- —
No personal income docs; deal must DSCR.
Hard money
10% down · 12.0% · 12mo
- Down + closing
- —
- Monthly P&I
- —
- Monthly cashflow
- —
- DSCR
- —
- Eligible?
- —
Short-term bridge; refi at stabilization.
Rent comps 9 comps
| Address | Beds | Baths | Sqft | Rent | $/sqft | DOM | Units | Dist |
|---|---|---|---|---|---|---|---|---|
| 13301 Pleasant Forest Dr Little Rock, AR | 3.0 | 2.0 | 1666 | $1,795 | $1.08 | 25d | 1 | 0.66mi |
| 8 Lisa Ct Little Rock, AR | 4.0 | 2.0 | 2072 | $1,995 | $0.96 | 25d | 1 | 1.01mi |
| 3806 Cameo Dr Little Rock, AR | 3.0 | 2.0 | 1615 | $2,225 | $1.38 | 45d | 1 | 1.07mi |
| 4800 Old Oak Dr Little Rock, AR | 3.0 | 2.5 | 1900 | $2,750 | $1.45 | 25d | 1 | 1.11mi |
| 15400 Taylor Loop Rd Little Rock, AR | 3.0 | 2.5 | 1988 | $2,200 | $1.11 | 25d | 1 | 1.12mi |
| 1801 Champlin Dr Little Rock, AR | 1.0–3.0 | 1.0–2.0 | 1118 | $1,939 | $1.73 | 15d | 9 | 1.28mi |
| 13717 Napoleon Rd Little Rock, AR | 3.0 | 2.0 | 1900 | $2,650 | $1.39 | 15d | 1 | 1.30mi |
| 46 Morrison Ct Little Rock, AR | 3.0 | 2.5 | 1800 | $2,200 | $1.22 | 22d | 1 | 1.32mi |
| 11901 Pleasant Ridge Rd Little Rock, AR | 1.0–3.0 | 1.0–2.0 | 1018 | $1,385 | $1.36 | 15d | 16 | 1.41mi |
Listing history 7 events
-
2026-06-03status $275,000 Under Contract 73 DOM
-
2026-06-02days on market $275,000 Take Backups 73 DOM
-
2026-06-01days on market $275,000 Take Backups 72 DOM
-
2026-05-31days on market $275,000 Take Backups 71 DOM
-
2026-05-31days on market $275,000 Take Backups 70 DOM
-
2026-04-28historical Take Backups
-
2026-03-21$275,000 New Listing
ⓘ Source: listings_history table (triggers on properties + properties_extension) + one-shot
backfill from property_details.listing_events for pre-trigger history.
Tax reassessment forecast AR · Resets to sale price
- Current annual tax
- $1,679 · $140/mo
- Projected year-2 tax
- $1,760 · $147/mo
- Expected delta
- +$81/yr (+$7/mo · 4.8%)
ⓘ Screening estimate from a state-policy table — verify with the county assessor before closing.
Climate risk First Street
- Flood 4/10 Moderate FEMA zone X (unshaded) · 20% chance over 30 yrs
- Wildfire 3/10 Moderate
- Heat 7/10 Severe 7 d/yr ≥110°F today · 19 d/yr by 30 yrs out
- Wind 4/10 Moderate 9% chance of damaging wind over 30 yrs
- Air quality 2/10 Low 0 unhealthy d/yr today · 1 by 30 yrs out
Nearby sold comps map
Loading sold comps map…
Walkable amenities ~0.75 mi
Loading nearby amenities…
Taxation est. · year 1
- Rental income
- $26,408
- − Mortgage interest
- −$15,404
- − Property taxes
- −$1,679
- − Insurance
- −$1,375
- − Repairs & maintenance
- −$2,113
- − Management
- −$2,113
- − Depreciation
- −$8,000
- Taxable loss
- −$4,276
- Est. tax savings @ 24.0%
- +$1,026
- After-tax cash flow
- $1,529/yr
For passive investors: Depreciation is non-cash, so a rental often shows a tax loss while cash-flowing — sheltering income. Rental losses are passive: they offset passive income freely, and up to $25,000/yr can offset ordinary (W-2) income if you actively participate and your MAGI is under $100k (phasing out to $0 by $150k); unused losses carry forward. On sale, claimed depreciation is recaptured at up to 25%, and gains may owe capital-gains tax (a 1031 exchange can defer both). Figures are a year-1 estimate at your 24.0% rate — not tax advice; consult a CPA.
Schools (NCES district)
- District
- Little Rock School District
- NCES district ID
- 0509000
- Math proficiency
- 23% ▼ -12.00%
- Reading proficiency
- 26% ▼ -8.00%
- Median HH income
- $43,346
- Composite
- 21.0/100
- National rank
- #8457
- State rank
- #183 of 238 in AR
Livability — Little Rock
- Score
- 73/100
- State rank
- #22
- US rank
- #5295
Category grades
Schools grade is shown separately in the Schools card above.
Census & demographics
- Census place
- Little Rock, AR
- County
- Pulaski County · 372,764 people
- City population
- 218,896
- Metro
- Little Rock-North Little Rock-Conway, AR
- Population (ZIP)
- 13,698
- Household income
- $114,140
- Rent vs Own
- Severe rent burden
- 101.0
Population outlook (Pulaski County) Hauer SSP2
- Today (2025)
- 415,378 people
- By 2030
- 423,720 · +2.0%
- By 2040
- 435,182 · +4.8%
- By 2050
- 440,904 · +6.1%
- By 2075
- 445,521 · +7.3%
- By 2100
- 419,173 · +0.9%
Race, ethnicity, and origin ACS 2023
- Neighborhood character
- Predominantly White (80%)
- Race & ethnicity
- White 80% Black 11% Two or more races 4% Hispanic / Latino 4% Asian 3%
- Common ancestry
- Portuguese 2% Italian 2% Lithuanian 2%
- Foreign-born
- 5% · Canada, China
- Languages at home
- 94% English-only · Spanish 3% Other Indo-European 1% Other Asian/Pacific 1%
Political lean MEDSL · Pulaski
- 2024 margin
- Strong D (+22.1) · D 59.8% · R 37.7% · Other 2.5%
- 2008→2024 swing
- +10.6pp toward D · 2008: 11.6pp · 2024: 22.1pp
- All cycles
- 2024: D+22.1 2020: D+22.5 2016: D+17.9 2012: D+11.4 2008: D+11.6
Not yet ingested
- Civics
- —
Market trends
- HPI YoY
- ▼ -154.02%
- Current HPI
- 204.889
- Rent YoY
- —
- Metro
- Little Rock-North Little Rock-Conway, AR
- State GDP YoY
- ▲ 3.80%
- F500 in state
- 10
Industry mix (Fortune 500 HQ in AR)
| Industry | F500 HQs | Revenue |
|---|---|---|
| Retail | 1 | $681B |
|
||
| Food / Agriculture | 1 | $53B |
|
||
| Retail / Energy | 1 | $22B |
|
||
| Transportation / Logistics | 1 | $12B |
|
||
| Energy | 1 | $4B |
|
||
Price history
2 events — show timeline
- 2026-04-28 Contingent — CARMLS
- 2026-03-21 Listed $275,000 CARMLS
Property tax history
-0.0%/yrLatest (2025): $1,679 · +0.0% YoY. Source: county tax records.
Cash-flow waterfall
monthlySold comps — $/sqft
last 12 mo · ≤1 miLoading sold comps…