11-3276 Ohia Ave · Eden Roc, HI
Flood risk 1/10 · Minimal
- FEMA flood zone
- X (unshaded)
- Chance of flooding over 30 yrs
- 0.0%
- Est. flood insurance / yr
- $507 – $1,088
Fire risk No data
- Est. fire insurance / yr
- —
Heat risk No data
- Hot days now (above threshold)
- —
- Hot days in 30 yrs
- —
Wind risk No data
- Chance of severe wind over 30 yrs
- —
Air-quality risk 1/10 · Minimal
- Unhealthy air days now
- —
- Unhealthy air days in 30 yrs
- —
Risk factors via First Street. Map © Google.
Why this score? — see what drove the B+ grade
The composite is a weighted blend of 9 inputs, each scored 0–100. Each bar is that input's sub-score; the figure is the points it added to the 100-point composite (weight × sub-score).
- Cash flow +30.0/30.0
- ARV discount +13.9/15.0
- DSCR +10.0/10.0
- 1% rule +9.6/10.0
- Appreciation +5.4/10.0
- Schools +3.7/10.0
- Livability +2.6/5.0
- Rent growth +2.5/5.0
- Condition / age +2.2/5.0
$109,000
🖨 Deal sheet 📄 Offer letter ✓ Due diligence
Listing remarks MLS
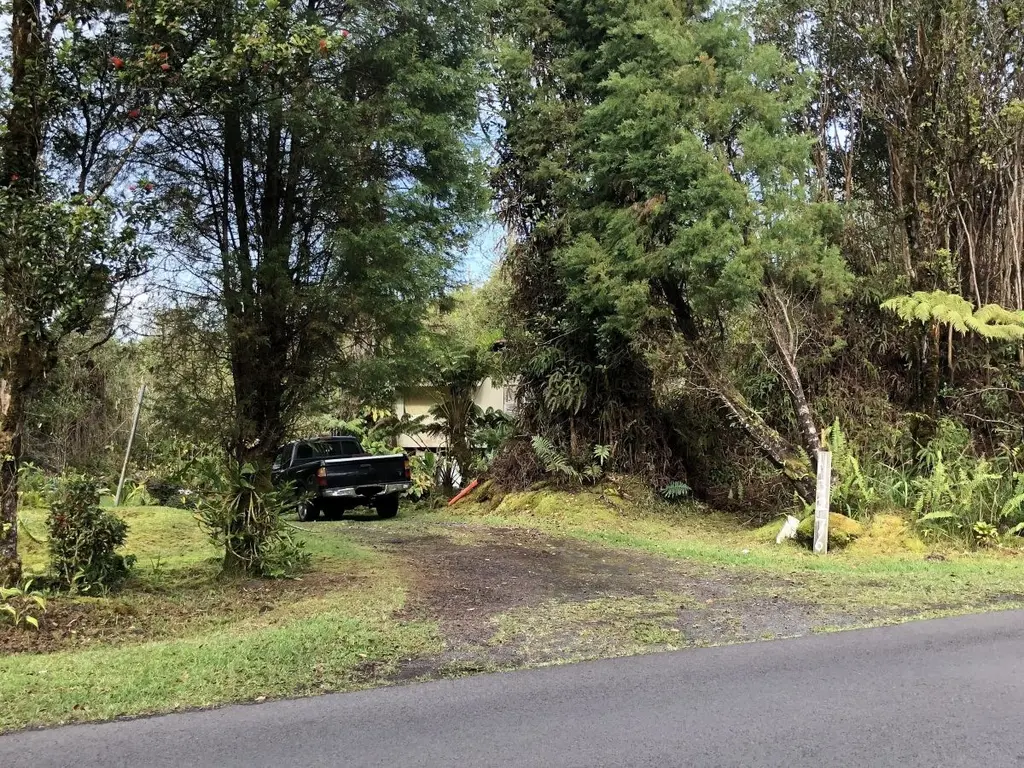
Quiet off-grid cabin on a mostly cleared 1-acre parcel located close to Volcano Village and Hawaiʻi Volcanoes National Park. Convenient access from a paved road. The cabin features a 12’ x 8’ kitchen and a 10’ x 20’ bedroom. A separate storage building provides additional space for tools, supplies, or equipment. The property offers privacy and a cool mountain climate. Suitable for those seeking a rustic living environment or a base for further improvement. Ample room for gardening or additional structures. Property is being sold in “as-is” condition. Buyer and buyer’s agent to verify all information and perform due diligence regarding utilities, permitting, and any intended uses. Motivated Seller.
Key facts
- Off-grid cabin
- Cleared parcel
- Room for gardening
Tags
Neighborhood map
What this means for you Summary
Snapshot
- This is a 2-bed/1.0-bath single-family listed at $109k. Condition is rated fair.
Deal economics
- At list price, monthly cash flow is $508 ($6k/yr) — positive.
- The deal already cash-flows at list — no discount required.
- Meets the 1% rule at list price ($2k rent vs $109k).
- Recommended offer: $96k (12.0% below list) — sets the bar for market timing.
Location & tenants
- Location reads 52/100 on livability (#145 in HI) — a working-class tenant base; expect higher turnover. Strengths: housing B+, cost of living B; Watch: health & safety C-, schools F, crime D-.
- Hawaii Department Of Education (suburban): math 32% / reading 50% proficiency, ranked #1 of 1 in HI (top 100%) — families likely to look elsewhere, expect single-tenant / working-renter base with shorter leases.
- Market conditions: 129 active listings in the ZIP; 982 units permitted in Hawaii County in 2024 (0 in 5+ unit buildings).
Forward outlook
- In year one you build about $2k of equity ($754 loan paydown + $803 appreciation (0.7% local appreciation)).
- Hawaii County population projected at +24% by 2050 — long-run rental-demand tailwind backs the buy-and-hold thesis.
- At projected returns (0.7% appreciation + 3.0% rent growth), your $31k cash investment doubles in ~4 years — after that, you're playing with house money.
Negotiation context
- It's been on market 219 days — a 12% lower offer ($96k) is reasonable based on typical stale-listing flexibility.
- 2 sale attempts since 3y ago with the ask held roughly flat each time — persistent listings suggest the price (not the market) is what's stuck; bring a comps-based counter.
Questions for the listing agent
- It's been on market 219 days. Have you received any prior offers? Is the seller open to a 12% concession, seller financing, or rate buy-down credit?
- Have any recent inspections been done? Can we get a copy of the seller's disclosures and any deferred-maintenance estimates?
- Why hasn't it sold? Are there any deal-killer items the seller is aware of (foundation, flood, title, zoning, code violations)?
- Is there a deadline driving the sale (1031 exchange, divorce, estate, relocation)? That informs how much negotiation room exists.
- Schools are F-rated, which usually means shorter tenancies and higher turnover. Who's the typical renter profile here, and what's been the actual vacancy rate?
- Crime grade is D in this area — have there been break-ins, vandalism, or insurance claims at this property in the last 3 years? What carrier currently insures it and at what premium?
- What's the average days-on-market for RENTAL listings here right now (not sales)? A rising rental-DOM trend means longer vacancies and softer asking-rent achievability than the comps imply.
- What's the recent tenant-quality profile in this submarket — average credit score on applications, eviction rate, late-payment / NSF rate, and stable-employment percentage? A property-management company in the area should have these aggregated.
- How much new for-sale + rental construction is in the pipeline within 1–3 miles? Heavy new supply typically softens prices + rents 12–24 months out; constrained supply supports both.
Investment metrics
- 1% rule
- 1.46% ✓
- Cap rate
- 11.89%
- Cash-on-cash
- 19.98%
- DSCR
- 1.89
- GRM
- 5.7
CMA / ARV
- ARV (median comp)
- $127,120
- List price
- $109,000
- Delta
- -14.25%
- Verdict
- UNDERPRICED
- Comps
- 1 within 2.0 mi
Projected returns pro-forma
0.74% appreciation · 3.0% rent growth · sell at horizon
- IRR
- 21.5%
- Equity multiple
- 2.08×
- Total profit
- $33,026
- Equity at exit
- $35,723
- IRR
- 24.8%
- Equity multiple
- 3.93×
- Total profit
- $89,293
- Equity at exit
- $46,342
Cash invested: $30,520 (down + closing). Projections, not guarantees.
Landlord ↔ Tenant lean methodology
- Overall (STATE)
- 37 Tenant-Leaning
- State Hawaii
- 37 Tenant-Leaning · D+13
- County
- — inherits STATE
- City
- — inherits STATE
ZIP-level market 96771
- Home prices YoY
- 0.4%
- Active inventory
- 129
- Price-to-rent
- 5.7×
Monthly cashflow live
- Estimated rent
- $1,597 medium interval (Pro) →
- Mortgage (P&I)
- −$572
- Tax est. 1.5%
- −$136 /mo · $1,635/yr
- Insurance
- −$45
- HOA
- −$0
- Vacancy / Maint / Mgmt
- −$335
- Net cashflow
- $508
Break-even live
UW: 25.0% down · 7.5% · 30yr · 1.5% tax · 5.0% vac · 8.0% maint · 8.0% mgmt
Financing live
Cash to close
- Down payment
- $27,250
- Closing costs
- $3,270
- Reserves months
- —
- Total cash needed
- —
Loan-product check · same deal, 3 products live
Conventional
25% down · 7.5% · 30yr
- Down + closing
- —
- Monthly P&I
- —
- Monthly cashflow
- —
- DSCR
- —
- Eligible?
- —
Personal DTI + credit; lowest rate.
DSCR
20% down · 8.5% · 30yr
- Down + closing
- —
- Monthly P&I
- —
- Monthly cashflow
- —
- DSCR
- —
- Eligible?
- —
No personal income docs; deal must DSCR.
Hard money
10% down · 12.0% · 12mo
- Down + closing
- —
- Monthly P&I
- —
- Monthly cashflow
- —
- DSCR
- —
- Eligible?
- —
Short-term bridge; refi at stabilization.
Listing history 18 events
-
2026-06-18days on market $109,000 Active 219 DOM
-
2026-06-17days on market $109,000 Active 218 DOM
-
2026-06-15days on market $109,000 Active 216 DOM
-
2026-06-13days on market $109,000 Active 214 DOM
-
2026-06-13days on market $109,000 Active 213 DOM
-
2026-06-10days on market $109,000 Active 211 DOM
-
2026-06-09days on market $109,000 Active 210 DOM
-
2026-06-08days on market $109,000 Active 209 DOM
-
2026-06-07days on market $109,000 Active 208 DOM
-
2026-06-05days on market $109,000 Active 205 DOM
-
2026-06-03days on market $109,000 Active 204 DOM
-
2026-06-02days on market $109,000 Active 203 DOM
-
2026-06-01days on market $109,000 Active 202 DOM
-
2026-05-31days on market $109,000 Active 201 DOM
-
2025-11-06$109,000 Active 748-char remark
Show marketing remark (748 chars)
Quiet off-grid cabin on a mostly cleared 1-acre parcel located close to Volcano Village and Hawaiʻi Volcanoes National Park. Convenient access from a paved road. The cabin features a 12’ x 8’ kitchen and a 10’ x 20’ bedroom. A separate storage building provides additional space for tools, supplies, or equipment. The property offers privacy and a cool mountain climate. Suitable for those seeking a rustic living environment or a base for further improvement. Ample room for gardening or additional structures. Property is being sold in “as-is” condition. Buyer and buyer’s agent to verify all information and perform due diligence regarding utilities, permitting, and any intended uses. Motivated Seller.
-
2024-04-01historical
-
2023-08-09price $99,000
-
2023-04-18$125,000 Active
ⓘ Source: listings_history table (triggers on properties + properties_extension) + one-shot
backfill from property_details.listing_events for pre-trigger history.
Climate risk First Street
- Flood 1/10 Low FEMA zone X (unshaded) · 0% chance over 30 yrs
- Air quality 1/10 Low
Nearby sold comps map
Loading sold comps map…
Walkable amenities ~0.75 mi
Loading nearby amenities…
Taxation est. · year 1
- Rental income
- $19,160
- − Mortgage interest
- −$6,106
- − Property taxes
- −$1,635
- − Insurance
- −$545
- − Repairs & maintenance
- −$1,533
- − Management
- −$1,533
- − Depreciation
- −$3,171
- Taxable income
- $4,638
- Est. tax owed @ 24.0%
- −$1,113
- After-tax cash flow
- $4,984/yr
For passive investors: Depreciation is non-cash, so a rental often shows a tax loss while cash-flowing — sheltering income. Rental losses are passive: they offset passive income freely, and up to $25,000/yr can offset ordinary (W-2) income if you actively participate and your MAGI is under $100k (phasing out to $0 by $150k); unused losses carry forward. On sale, claimed depreciation is recaptured at up to 25%, and gains may owe capital-gains tax (a 1031 exchange can defer both). Figures are a year-1 estimate at your 24.0% rate — not tax advice; consult a CPA.
Condition & rehab AI · 12 photos
This property requires significant repairs and maintenance to improve its condition and increase its value. The home is in fair condition with moderate rehabilitation needed.
Repairs flagged
- Major Kitchen flooring — Severe wear and damage
- Major Bathroom flooring — Severe wear and damage
- Major Exterior siding — Significant damage and wear
- Major Windows — Visible damage and wear
- Major Roof — Significant damage and wear
- Major HVAC/mechanicals — Significant damage and wear
- Major Landscaping — Overgrown and in poor condition
Value-add opportunities
- Both Clean and organize kitchen and bathroom — A clean and organized space enhances both resale and rental value.
- Both Replace damaged flooring — New flooring improves the overall appearance and functionality of the home.
- Both Repair and replace damaged siding — Aesthetic improvements to the exterior increase both resale and rental value.
- Both Replace damaged windows — New windows improve energy efficiency and enhance the home's curb appeal.
- Both Repair and replace damaged roof — A repaired or replaced roof ensures the home's structural integrity and enhances its value.
- Both Replace HVAC/mechanicals — Upgraded HVAC and mechanical systems improve comfort and energy efficiency, enhancing both resale and rental value.
- Both Trim and maintain landscaping — A well-maintained landscape enhances the home's curb appeal and adds value to both resale and rental properties.
Renovation cost estimate screening
| Repair item | Severity | Est. cost |
|---|---|---|
| Kitchen flooring · Severe wear and damage | Major | $15,000–50,000 |
| Bathroom flooring · Severe wear and damage | Major | $15,000–50,000 |
| Exterior siding · Significant damage and wear | Major | $15,000–50,000 |
| Windows · Visible damage and wear | Major | $15,000–50,000 |
| Roof · Significant damage and wear | Major | $15,000–50,000 |
| HVAC/mechanicals · Significant damage and wear | Major | $15,000–50,000 |
| Landscaping · Overgrown and in poor condition | Major | $15,000–50,000 |
| Total estimated repair cost · 7 items | $105,000–350,000 |
Value-add ROI direction
- Both Clean and organize kitchen and bathroom — A clean and organized space enhances both resale and rental value. ↑
- Both Replace damaged flooring — New flooring improves the overall appearance and functionality of the home. ↑
- Both Repair and replace damaged siding — Aesthetic improvements to the exterior increase both resale and rental value. ↑
- Both Replace damaged windows — New windows improve energy efficiency and enhance the home's curb appeal. ↑
- Both Repair and replace damaged roof — A repaired or replaced roof ensures the home's structural integrity and enhances its value. ↑
- Both Replace HVAC/mechanicals — Upgraded HVAC and mechanical systems improve comfort and energy efficiency, enhancing both resale and rental value. ↑
- Both Trim and maintain landscaping — A well-maintained landscape enhances the home's curb appeal and adds value to both resale and rental properties. ↑
ⓘ Cost ranges are severity-bucket heuristics (US national rule-of-thumb). Get contractor quotes + a written scope before underwriting a rehab budget.
Schools (NCES district)
- District
- Hawaii Department Of Education
- NCES district ID
- 1500030
- Math proficiency
- 32% ▼ -10.00%
- Reading proficiency
- 50% ▼ -3.00%
- Median HH income
- $69,005
- Composite
- 37.07/100
- National rank
- #4504
- State rank
- #1 of 1 in HI
Livability — Eden Roc
- Score
- 52/100
- State rank
- #145
- US rank
- #25131
Category grades
Schools grade is shown separately in the Schools card above.
Census & demographics
- Census place
- Eden Roc, HI
- Population (ZIP)
- 7,736
Population outlook (Hawaii County) Hauer SSP2
- Today (2025)
- 220,733 people
- By 2030
- 232,156 · +5.2%
- By 2040
- 252,486 · +14.4%
- By 2050
- 272,703 · +23.5%
- By 2075
- 332,113 · +50.5%
- By 2100
- 398,342 · +80.5%
Race, ethnicity, and origin ACS 2023
- Neighborhood character
- Highly diverse neighborhood (Simpson 0.87)
- Race & ethnicity
- Two or more races 41% White 33% Pacific Islander 16% Hispanic / Latino 14% Asian 6%
- Hispanic origin (detail)
- Mexican 1% Puerto Rican 9%
- Common ancestry
- Russian 10% Lithuanian 3% Slovak 3%
- Foreign-born
- 5% · Canada
- Languages at home
- 80% English-only · Other Asian/Pacific 7% Spanish 1% German/W. Germanic 1%
Political lean MEDSL · Hawaii
- 2024 margin
- Strong D (+28.3) · D 63.0% · R 34.7% · Other 2.3%
- 2008→2024 swing
- -25.4pp toward R · 2008: 53.7pp · 2024: 28.3pp
- All cycles
- 2024: D+28.3 2020: D+36.2 2016: D+36.6 2012: D+51.3 2008: D+53.7
Not yet ingested
- Civics
- —
Market trends
- HPI YoY
- ▲ 0.74%
- Current HPI
- 169.8292
- Rent YoY
- —
- Metro
- —
- State GDP YoY
- —
- F500 in state
- 0
Price history
-12.8% since first listed4 events — show timeline
- 2025-11-06 Listed $109,000 HI Information Service
- 2024-04-01 Listing Removed — HI Information Service
- 2023-08-09 Price Changed $99,000 HI Information Service
- 2023-04-18 Listed $125,000 HI Information Service
Cash-flow waterfall
monthlySold comps — $/sqft
last 12 mo · ≤1 miLoading sold comps…