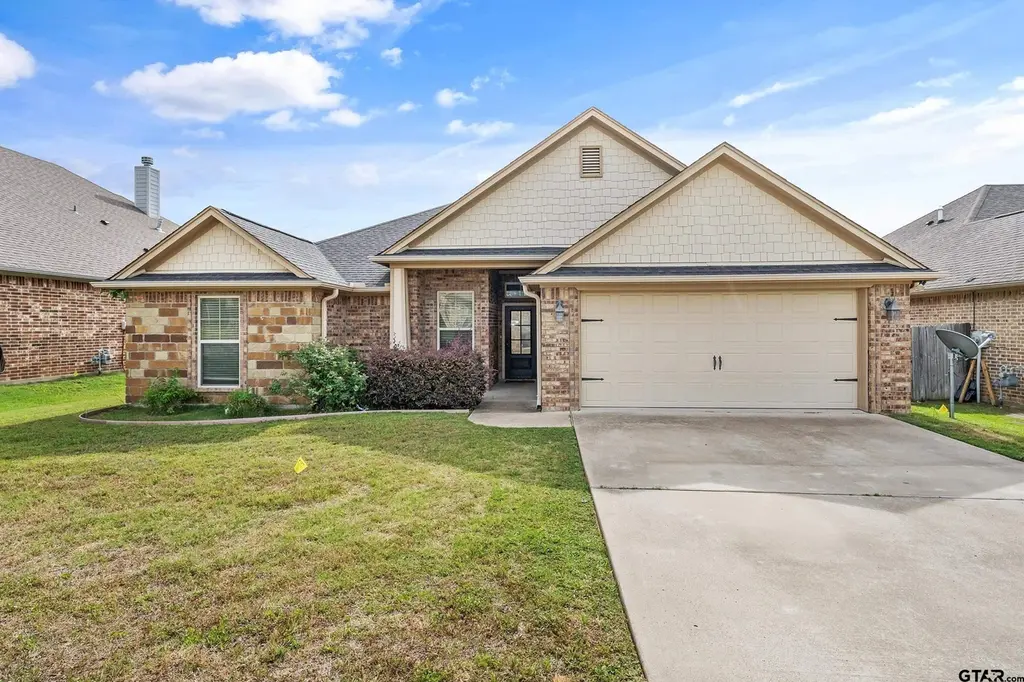
7376 Flat Rock Ln · Tyler, TX
Flood risk 7/10 · Major
- FEMA flood zone
- X (unshaded)
- Chance of flooding over 30 yrs
- 0.99%
- Est. flood insurance / yr
- $507 – $1,088
Fire risk 4/10 · Minor
- Est. fire insurance / yr
- $1,222 – $2,270
Heat risk 7/10 · Major
- Hot days now (above 109°F)
- 7 days/yr
- Hot days in 30 yrs
- 28 days/yr
Wind risk 6/10 · Moderate
- Chance of severe wind over 30 yrs
- 62.0%
Air-quality risk 2/10 · Minimal
- Unhealthy air days now
- 0 days/yr
- Unhealthy air days in 30 yrs
- 1 days/yr
Risk factors via First Street. Map © Google.
Why this score? — see what drove the D grade
The composite is a weighted blend of 9 inputs, each scored 0–100. Each bar is that input's sub-score; the figure is the points it added to the 100-point composite (weight × sub-score).
- Cash flow +13.8/30.0
- ARV discount +11.3/15.0
- DSCR +4.2/10.0
- 1% rule +4.1/10.0
- Livability +3.8/5.0
- Schools +3.3/10.0
- Condition / age +2.5/5.0
- Rent growth +2.0/5.0
- Appreciation +0.0/10.0
$329,000
🖨 Deal sheet 📄 Offer letter ✓ Due diligence
Listing remarks
Beautiful 4-bedroom, 2-bath home in a prime location just minutes from Fresh, Old Jacksonville, shopping, dining, and everyday conveniences. Located near Jack elementary school, this home combines functionality, comfort, and convenience in one inviting package. The open-concept layout is ideal for both entertaining and daily living, featuring a spacious living room with rich wood floors, an inviting fireplace, and plenty of room to gather with family and friends. The kitchen is the heart of the home with stately stained cabinetry, a large island, abundant counter space, and tons of storage. The split primary suite offers privacy and a comfortable retreat, while the nearby utility room adds
Key facts
- 2 garage spots
- Built 2014
- Listed 2 days
Property features AI
Exterior
- Parking: Attached garage with 2 spaces; Concrete driveway/parking
- Utilities: Public water; Cable available; Underground utilities
- Home design: Single-family detached home; Single-story
- Construction: Brick veneer construction
- Exterior features: Covered patio/porch; Wood fencing; Composition roof
Interior
- Kitchen: Dishwasher; Electric oven; Electric range; Microwave
- Flooring: Carpet; Tile; Wood
- Bathrooms: 2 full bathrooms
- Heating & cooling: Central heating (natural gas); Central air; Ceiling fans
- Interior features: Walk-in closets; Pantry; Gas-starter fireplace
- Laundry & utility: Gas water heater
Neighborhood map
What this means for you Summary
Snapshot
- This is a 4-bed/2.0-bath single-family listed at $329k.
Deal economics
- At list price, monthly cash flow is $-38 ($-458/yr) — negative.
- To cash-flow at today's rent, offer at most $322k (2.1% below list).
- To meet the 1% rule (rent ≥ 1% of price), the offer needs to be $299k (9.2% below list).
- Recommended offer: $299k (9.2% below list) — sets the bar for 1% rule.
- Cap rate 6.4% vs local median 3.6% in Tyler — top-decile yield for the area; either an underpriced asset or a hidden risk that comps aren't pricing in. Stress-test before assuming the spread holds.
Location & tenants
- Location reads 75/100 on livability (#147 in TX, #4,181 nationally) — a middle-class / working-renter tenant base. Strengths: cost of living A+, housing A+, health & safety A+; Watch: employment C-, crime D+, commute F.
- Tyler ISD (urban): math 39% / reading 38% proficiency, ranked #449 of 826 in TX (top 54%) — families likely to look elsewhere, expect single-tenant / working-renter base with shorter leases; 66% free/reduced lunch — lower-income household profile, screen leases tightly.
- Zoned schools: Dr Bryan C Jack El (math 53% / reading 51%, grade C-, #742 of 4,322 statewide, top 19%, 685 students, 46% FRL); Three Lakes Middle (math 35% / reading 42%, grade F, #704 of 1,662 statewide, top 43%, 873 students, 64% FRL); Tyler Legacy H S (math 34% / reading 49%, grade F, #767 of 1,632 statewide, top 47%, 2,594 students, 58% FRL).
- Market conditions: Rents soft (-1.9%/yr); 649 active listings in the ZIP; 7 comparable units currently listed for rent nearby; rentals lingering (median 44d on market — plan ~5-8 weeks vacancy on turnover, expect pricing pressure); 71% of comp listings sitting > 30 days — soft ceiling on asking rent; solid renter incomes; 595 units permitted in Smith County in 2024 (45 in 5+ unit buildings).
- At $2,989/mo this rent would consume 45% of the median local household income ($79k/yr) (locally 1585% of renters already pay >50% of income on rent) — very limited rent-growth headroom before tenants either downsize or default.
Forward outlook
- Local home prices are declining (-3.0%/yr); year-one equity from $2k of loan paydown is wiped out by about $10k of value loss. Plan a longer hold.
- Smith County population projected at +24% by 2050 — long-run rental-demand tailwind backs the buy-and-hold thesis.
Negotiation context
- Only 2 days on market — expect competitive offers; lowballing is unlikely to land.
Risks & watch-outs
- Watch-outs: flood insurance adds $66/mo.
- Climate carrying-cost: major flood risk; major wind risk, 62% chance of damaging wind over 30y; extreme-heat days projected 7→28/yr by 2055 (HVAC capex compounding) — expect insurance premiums to compound above CPI over the hold.
Questions for the listing agent
- What do current leases actually rent for vs. the listed asking? Can we see a recent rent roll and the last 12 months of T-12 income?
- What's the actual annual flood-insurance premium (NFIP or private), and is the property in a SFHA with mandatory coverage?
- Is there a deadline driving the sale (1031 exchange, divorce, estate, relocation)? That informs how much negotiation room exists.
- Schools are D-rated, which usually means shorter tenancies and higher turnover. Who's the typical renter profile here, and what's been the actual vacancy rate?
- Crime grade is D in this area — have there been break-ins, vandalism, or insurance claims at this property in the last 3 years? What carrier currently insures it and at what premium?
- The area grade is low — what's the realistic commute time and amenity access for the typical tenant pool here? Any planned neighborhood developments (good or bad) we should know about?
- What's the average days-on-market for RENTAL listings here right now (not sales)? A rising rental-DOM trend means longer vacancies and softer asking-rent achievability than the comps imply.
- What's the recent tenant-quality profile in this submarket — average credit score on applications, eviction rate, late-payment / NSF rate, and stable-employment percentage? A property-management company in the area should have these aggregated.
- How much new for-sale + rental construction is in the pipeline within 1–3 miles? Heavy new supply typically softens prices + rents 12–24 months out; constrained supply supports both.
Investment metrics
- 1% rule
- 0.91% ✗
- Cap rate
- 6.40%
- Cash-on-cash
- 0.37%
- DSCR
- 1.02
- GRM
- 9.2
CMA / ARV
- ARV (on-the-fly)
- $359,722
- Comps found
- 5
Show comp detail 5 sales within ~0.75 mi
| Address | Dist | Beds/Ba | Sqft | Sold | Price | $/sf | Match |
|---|---|---|---|---|---|---|---|
| 1741 Elk River Rd | 0.15mi | 3/2.0 (-1) | 1,775 (-3%) | 1mo | $319,950 | $180 | 82 |
| 7335 Kingsport Ln | 0.13mi | 3/2.0 (-1) | 1,850 (+1%) | 12mo | $365,000 | $197 | 77 |
| 1830 Rocky Mountain Ln | 0.11mi | 3/2.0 (-1) | 1,850 (+1%) | 19mo | $368,000 | $199 | 72 |
| 7367 Kingsport Ln | 0.10mi | 4/2.0 | 2,009 (+10%) | 14mo | $379,000 | $189 | 68 |
| 1929 Grassy Ridge Ln Ln | 0.32mi | 3/2.0 (-1) | 1,960 (+7%) | 24mo | $395,000 | $202 | 48 |
Match score weights: distance 35% · size 25% · config 20% · recency 20%. Top-matched comps best support the ARV.
Projected returns pro-forma
-3.0% appreciation · 0.0% rent growth · sell at horizon
- IRR
- -20.7%
- Equity multiple
- 0.30×
- Total profit
- $-64,382
- Equity at exit
- $49,055
- IRR
- -23.4%
- Equity multiple
- -0.00×
- Total profit
- $-92,549
- Equity at exit
- $28,446
Cash invested: $92,120 (down + closing). Projections, not guarantees.
Landlord ↔ Tenant lean methodology
- Overall (STATE)
- 87 Strongly Landlord-Friendly
- State Texas
- 87 Strongly Landlord-Friendly · R+5
- County
- — inherits STATE
- City
- — inherits STATE
ZIP-level market 75703
- Rents YoY
- -1.9%
- Active inventory
- 649
- Price-to-rent
- 9.2×
Monthly cashflow live
- Estimated rent
- $2,989 high interval (Pro) →
- Mortgage (P&I)
- −$1,725
- Tax from tax record
- −$471 /mo · $5,647/yr
- Insurance
- −$137
- Flood insurance flood zone
- −$66 /mo · $798/yr
- HOA
- −$0
- Vacancy / Maint / Mgmt
- −$628
- Net cashflow
- $-38
Break-even live
UW: 25.0% down · 7.5% · 30yr · 1.5% tax · 5.0% vac · 8.0% maint · 8.0% mgmt
Financing live
Cash to close
- Down payment
- $82,250
- Closing costs
- $9,870
- Reserves months
- —
- Total cash needed
- —
Loan-product check · same deal, 3 products live
Conventional
25% down · 7.5% · 30yr
- Down + closing
- —
- Monthly P&I
- —
- Monthly cashflow
- —
- DSCR
- —
- Eligible?
- —
Personal DTI + credit; lowest rate.
DSCR
20% down · 8.5% · 30yr
- Down + closing
- —
- Monthly P&I
- —
- Monthly cashflow
- —
- DSCR
- —
- Eligible?
- —
No personal income docs; deal must DSCR.
Hard money
10% down · 12.0% · 12mo
- Down + closing
- —
- Monthly P&I
- —
- Monthly cashflow
- —
- DSCR
- —
- Eligible?
- —
Short-term bridge; refi at stabilization.
Rent comps 7 comps
| Address | Beds | Baths | Sqft | Rent | $/sqft | DOM | Units | Dist |
|---|---|---|---|---|---|---|---|---|
| 7352 Kingsport Ln Tyler, TX | 3.0 | 2.0 | 1875 | $4,500 | $2.40 | 13d | 1 | 0.09mi |
| 1811 Spruce Pine Ln Tyler, TX | 3.0 | 2.0 | 1662 | $2,500 | $1.50 | 43d | 1 | 0.17mi |
| 16108 Echo Glen Dr Tyler, TX | 3.0 | 2.0 | 1225 | $1,795 | $1.47 | 43d | 1 | 0.64mi |
| 10801 Harvestwood Dr Tyler, TX | 4.0 | 2.5 | 1964 | $3,750 | $1.91 | 13d | 1 | 0.90mi |
| 4818 CR 219 Unit 702 Tyler, TX | 3.0 | 2.0 | 1365 | $1,850 | $1.36 | 43d | 1 | 0.92mi |
| 11201 County Road 166 Tyler, TX | 3.0 | 2.0 | 1635 | $2,595 | $1.59 | 43d | 1 | 1.20mi |
| 11086 County Road 167 Unit 11 Tyler, TX | 3.0 | 2.0 | 1495 | $1,900 | $1.27 | 43d | 1 | 1.25mi |
Listing history 2 events
-
2026-05-21$329,000 Active
-
2019-07-24soldstatus
ⓘ Source: listings_history table (triggers on properties + properties_extension) + one-shot
backfill from property_details.listing_events for pre-trigger history.
Tax reassessment forecast TX · Resets to sale price
- Current annual tax
- $5,647 · $471/mo
- Projected year-2 tax
- $6,021 · $502/mo
- Expected delta
- +$374/yr (+$31/mo · 6.6%)
ⓘ Screening estimate from a state-policy table — verify with the county assessor before closing.
Climate risk First Street
- Flood 7/10 Severe FEMA zone X (unshaded) · 99% chance over 30 yrs
- Wildfire 4/10 Moderate
- Heat 7/10 Severe 7 d/yr ≥109°F today · 28 d/yr by 30 yrs out
- Wind 6/10 Major 62% chance of damaging wind over 30 yrs
- Air quality 2/10 Low 0 unhealthy d/yr today · 1 by 30 yrs out
Nearby sold comps map
Loading sold comps map…
Walkable amenities ~0.75 mi
Loading nearby amenities…
Taxation est. · year 1
- Rental income
- $35,866
- − Mortgage interest
- −$18,429
- − Property taxes
- −$5,647
- − Insurance
- −$2,442
- − Repairs & maintenance
- −$2,869
- − Management
- −$2,869
- − Depreciation
- −$9,571
- Taxable loss
- −$5,961
- Est. tax savings @ 24.0%
- +$1,431
- After-tax cash flow
- $972/yr
For passive investors: Depreciation is non-cash, so a rental often shows a tax loss while cash-flowing — sheltering income. Rental losses are passive: they offset passive income freely, and up to $25,000/yr can offset ordinary (W-2) income if you actively participate and your MAGI is under $100k (phasing out to $0 by $150k); unused losses carry forward. On sale, claimed depreciation is recaptured at up to 25%, and gains may owe capital-gains tax (a 1031 exchange can defer both). Figures are a year-1 estimate at your 24.0% rate — not tax advice; consult a CPA.
Schools (NCES district)
- District
- Tyler ISD
- NCES district ID
- 4843470
- Math proficiency
- 39% ▼ -4.00%
- Reading proficiency
- 38% ▼ -1.00%
- Median HH income
- $44,090
- Composite
- 32.69/100
- National rank
- #5650
- State rank
- #449 of 826 in TX
Livability — Tyler
- Score
- 75/100
- State rank
- #147
- US rank
- #4181
Category grades
Schools grade is shown separately in the Schools card above.
Census & demographics
- Census place
- Tyler, TX
- County
- Smith County · 180,570 people
- City population
- 127,842
- Metro
- Tyler, TX
- Population (ZIP)
- 46,039
- Household income
- $79,194
- Rent vs Own
- Severe rent burden
- 1585.0
Population outlook (Smith County) Hauer SSP2
- Today (2025)
- 248,890 people
- By 2030
- 261,665 · +5.1%
- By 2040
- 286,114 · +15.0%
- By 2050
- 308,006 · +23.8%
- By 2075
- 354,171 · +42.3%
- By 2100
- 372,828 · +49.8%
Race, ethnicity, and origin ACS 2023
- Neighborhood character
- Predominantly White (66%)
- Race & ethnicity
- White 66% Black 17% Hispanic / Latino 10% Two or more races 7% Asian 4%
- Hispanic origin (detail)
- Mexican 8%
- Common ancestry
- Slovak 3% Italian 2% Lithuanian 2%
- Foreign-born
- 7% · Canada, China, Vietnam
- Languages at home
- 89% English-only · Spanish 6% Other Indo-European 1% Tagalog/Filipino 1%
Political lean MEDSL · Smith
- 2024 margin
- Solid R (+45.1) · D 27.0% · R 72.1%
- 2008→2024 swing
- -5.6pp toward R · 2008: -39.5pp · 2024: -45.1pp
- All cycles
- 2024: R+45.1 2020: R+39.4 2016: R+43.9 2012: R+46.9 2008: R+39.5
Not yet ingested
- Civics
- —
Market trends
- HPI YoY
- ▼ -218.79%
- Current HPI
- 182.3842
- Rent YoY
- ▼ -1.95%
- Metro
- Tyler, TX
- State GDP YoY
- ▲ 3.95%
- F500 in state
- 110
Industry mix (Fortune 500 HQ in TX)
| Industry | F500 HQs | Revenue |
|---|---|---|
| Energy | 16 | $1,198B |
|
||
| Technology | 5 | $198B |
|
||
| Engineering / Construction | 4 | $72B |
|
||
| Energy Services | 3 | $60B |
|
||
| Utilities | 3 | $41B |
|
||
| Healthcare | 2 | $330B |
|
||
Price history
2 events — show timeline
- 2026-05-21 Listed $329,000 GTAR
- 2019-07-24 Sold (Public Records) — Public Records
Property tax history
+3.4%/yrLatest (2024): $5,647 · +7.4% YoY. Source: county tax records.
Cash-flow waterfall
monthlySold comps — $/sqft
last 12 mo · ≤1 miLoading sold comps…