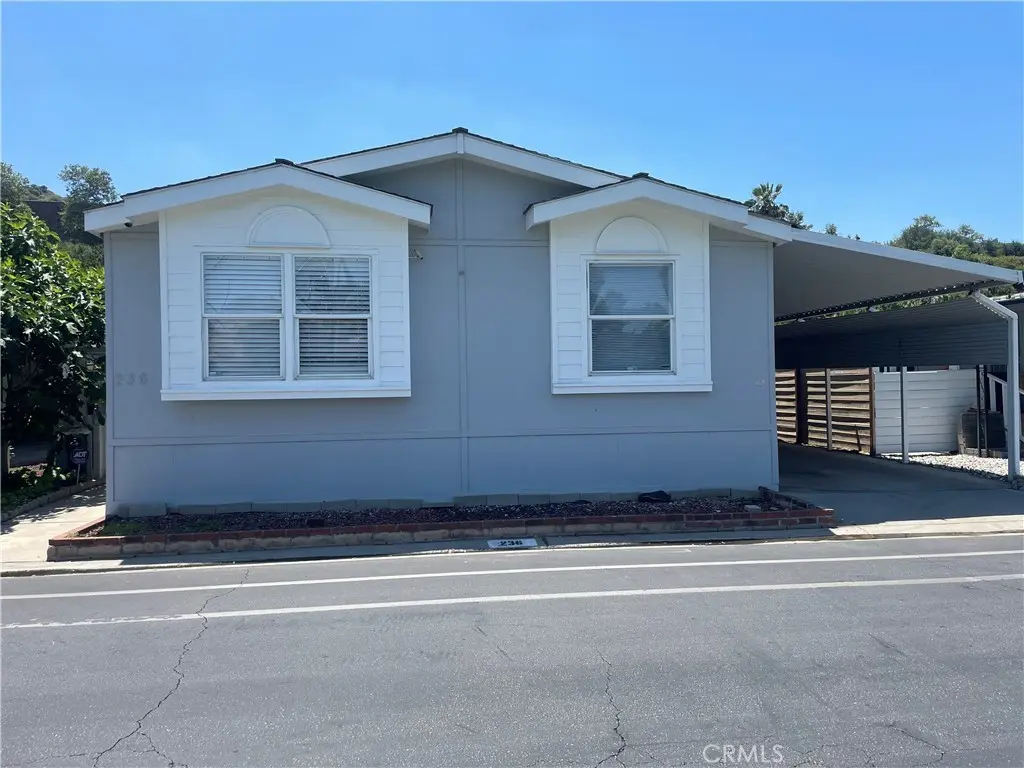
901 S 6th Ave #236 · Hacienda Heights, CA
Flood risk 5/10 · Moderate
- FEMA flood zone
- X (unshaded)
- Chance of flooding over 30 yrs
- 0.26%
- Est. flood insurance / yr
- $507 – $1,088
Fire risk 5/10 · Moderate
- Est. fire insurance / yr
- $659 – $1,223
Heat risk 6/10 · Moderate
- Hot days now (above 100°F)
- 7 days/yr
- Hot days in 30 yrs
- 21 days/yr
Wind risk 1/10 · Minimal
- Chance of severe wind over 30 yrs
- —
Air-quality risk 6/10 · Moderate
- Unhealthy air days now
- 9 days/yr
- Unhealthy air days in 30 yrs
- 10 days/yr
Risk factors via First Street. Map © Google.
Why this score? — see what drove the C- grade
The composite is a weighted blend of 9 inputs, each scored 0–100. Each bar is that input's sub-score; the figure is the points it added to the 100-point composite (weight × sub-score).
- Cash flow +19.7/30.0
- ARV discount +7.5/15.0
- DSCR +6.2/10.0
- Schools +4.5/10.0
- 1% rule +3.9/10.0
- Condition / age +3.8/5.0
- Livability +2.9/5.0
- Rent growth +2.8/5.0
- Appreciation +0.0/10.0
$327,999
🖨 Deal sheet 📄 Offer letter ✓ Due diligence
Listing remarks
Welcome to this beautifully updated 4 bedroom, 2 bathroom mobile home in one of Hacienda Heights' most sought-after communities. Move-in ready and refreshed from top to bottom, this home features a brand new roof, freshly painted interior and exterior, and new laminate flooring throughout, giving you a modern, turnkey living space with nothing left to do but unpack. Four spacious bedrooms and two full bathrooms provide plenty of room for families, guests, or a home office setup. The location simply can't be beat. You'll enjoy quick freeway access for easy commuting and the benefit of being within highly ranked school boundaries, making this an ideal choice for families. The community itself
Key facts
- Quick freeway access
- Fully equipped gym
- New roof
Tags
Property features AI
Finance
- Other: Park directions: 7th & Clark
- HOA & community: Located in Wildwood Mobile Country Club; Association amenities include pool, clubhouse, barbecue, banquet facilities, multipurpose/recreation room, picnic area, dog park, guard, and pet-friendly rules; Manager approval required; Land lease monthly: $1,300
Exterior
- Parking: Carport (3 spaces)
- Security: Community security
- Utilities: Public sewer; District/Public water; Natural gas connected; Electricity connected; Cable connected; Sewer connected; Water connected
- Home design: Mobile home (26' x 60') remains on site; Double body type; One story; Entry at side doors; Entry level 1
- Construction: Pier jacks foundation; Built (year per public records)
- Exterior features: Porch; Has patio; 1 shed; East-facing
Interior
- Kitchen: Pantry; Tile counters; Open floor plan kitchen
- Bedrooms: All bedrooms on main level
- Flooring: Tile flooring
- Bathrooms: 2 full bathrooms; Bathtub; Exhaust fan(s)
- Heating & cooling: Central heating (furnace); Central cooling
- Interior features: Ceiling fan; Pantry; Open floor plan; Storage space; Tile counters; Blinds
- Laundry & utility: In-unit laundry; Gas dryer hookup
Neighborhood map
What this means for you Summary
Snapshot
- This is a 4-bed/2.0-bath manufactured listed at $328k. Condition is rated good.
Deal economics
- At list price, monthly cash flow is $382 ($5k/yr) — positive.
- The deal already cash-flows at list — no discount required.
- To meet the 1% rule (rent ≥ 1% of price), the offer needs to be $292k (11.1% below list).
- Recommended offer: $292k (11.1% below list) — sets the bar for 1% rule.
- Cap rate 7.7% vs local median 2.4% in Hacienda Heights — top-decile yield for the area; either an underpriced asset or a hidden risk that comps aren't pricing in. Stress-test before assuming the spread holds.
Location & tenants
- Location reads 57/100 on livability (#732 in CA) — a working-class tenant base; expect higher turnover. Strengths: employment A+, commute A; Watch: crime C-, amenities F, cost of living F.
- Hacienda La Puente Unified (suburban): math 41% / reading 55% proficiency, ranked #443 of 1,400 in CA (top 32%) — families likely to look elsewhere, expect single-tenant / working-renter base with shorter leases; 62% free/reduced lunch — lower-income household profile, screen leases tightly.
- Zoned schools: Los Altos High (1,557 students, 69% FRL).
- Market conditions: Rents rising (+1.0%/yr); 124 active listings in the ZIP; 3 comparable units currently listed for rent nearby; rentals leasing fast (median 5d on market — plan ~1-2 weeks tenant-placement turnaround); solid renter incomes; 19,697 units permitted in Los Angeles County in 2024 (9,426 in 5+ unit buildings).
- This rent runs 32% of the median local income ($109k/yr) — at the standard rent-burdened threshold; future hikes will face affordability resistance.
Forward outlook
- Local home prices are declining (-3.0%/yr); year-one equity from $2k of loan paydown is wiped out by about $10k of value loss. Plan a longer hold.
- Los Angeles County population projected at +9% by 2050 — modest demand growth; plan on rents tracking national, not racing it.
Negotiation context
- It's been on market 45 days — a 3% lower offer ($318k) is reasonable based on typical stale-listing flexibility.
- 2 sale attempts since 3y ago with the ask held roughly flat each time — persistent listings suggest the price (not the market) is what's stuck; bring a comps-based counter.
Risks & watch-outs
- Climate carrying-cost: moderate flood risk; moderate wildfire risk; extreme-heat days projected 7→21/yr by 2055 (HVAC capex compounding) — expect insurance premiums to compound above CPI over the hold.
Questions for the listing agent
- It's been on market 45 days. Have you received any prior offers? Is the seller open to a 11% concession, seller financing, or rate buy-down credit?
- Built in 1972 — when were the roof, HVAC, electrical panel, plumbing, and water heater last replaced?
- Is there a deadline driving the sale (1031 exchange, divorce, estate, relocation)? That informs how much negotiation room exists.
- Schools are B-rated — typically a magnet for longer-tenancy family renters. What's the average tenant stay here, and is there a school-zone premium baked into asking?
- What's the average days-on-market for RENTAL listings here right now (not sales)? A rising rental-DOM trend means longer vacancies and softer asking-rent achievability than the comps imply.
- What's the recent tenant-quality profile in this submarket — average credit score on applications, eviction rate, late-payment / NSF rate, and stable-employment percentage? A property-management company in the area should have these aggregated.
- How much new for-sale + rental construction is in the pipeline within 1–3 miles? Heavy new supply typically softens prices + rents 12–24 months out; constrained supply supports both.
Investment metrics
- 1% rule
- 0.89% ✗
- Cap rate
- 7.69%
- Cash-on-cash
- 4.99%
- DSCR
- 1.22
- GRM
- 9.4
CMA / ARV
- ARV (median comp)
- $189,750
- List price
- $327,999
- Delta
- 72.86%
- Verdict
- OVERPRICED
- Comps
- 10 within 1.0 mi
Show comp detail 4 sales within ~0.75 mi
| Address | Dist | Beds/Ba | Sqft | Sold | Price | $/sf | Match |
|---|---|---|---|---|---|---|---|
| 901 S 6th Ave, Space 262 | 0.00mi | 3/2.0 (-1) | 1,620 (-1%) | 15mo | $238,000 | $147 | 81 |
| 901 South 6th #89 | 0.13mi | 4/2.0 | 1,450 (-12%) | 11mo | $164,000 | $113 | 65 |
| 901 S 6th Ave #238 | 0.31mi | 3/2.0 (-1) | 1,440 (-12%) | 5mo | $269,900 | $187 | 56 |
| 901 6th Ave #45 | 0.31mi | 4/3.0 | 1,464 (-11%) | 12mo | $221,000 | $151 | 54 |
Match score weights: distance 35% · size 25% · config 20% · recency 20%. Top-matched comps best support the ARV.
Projected returns pro-forma
-3.0% appreciation · 1.02% rent growth · sell at horizon
- IRR
- -10.6%
- Equity multiple
- 0.62×
- Total profit
- $-34,670
- Equity at exit
- $48,906
- IRR
- -3.9%
- Equity multiple
- 0.76×
- Total profit
- $-21,993
- Equity at exit
- $28,359
Cash invested: $91,840 (down + closing). Projections, not guarantees.
Landlord ↔ Tenant lean methodology
- Overall (STATE)
- 18 Strongly Tenant-Friendly
- State California
- 18 Strongly Tenant-Friendly · D+13
- County
- — inherits STATE
- City
- — inherits STATE
ZIP-level market 91745
- Rents YoY
- 1.0%
- Active inventory
- 124
- Price-to-rent
- 9.4×
Monthly cashflow live
- Estimated rent
- $2,916 medium interval (Pro) →
- Mortgage (P&I)
- −$1,720
- Tax from tax record
- −$65 /mo · $780/yr
- Insurance
- −$137
- HOA
- −$0
- Vacancy / Maint / Mgmt
- −$612
- Net cashflow
- $382
Break-even live
UW: 25.0% down · 7.5% · 30yr · 1.5% tax · 5.0% vac · 8.0% maint · 8.0% mgmt
Financing live
Cash to close
- Down payment
- $82,000
- Closing costs
- $9,840
- Reserves months
- —
- Total cash needed
- —
Loan-product check · same deal, 3 products live
Conventional
25% down · 7.5% · 30yr
- Down + closing
- —
- Monthly P&I
- —
- Monthly cashflow
- —
- DSCR
- —
- Eligible?
- —
Personal DTI + credit; lowest rate.
DSCR
20% down · 8.5% · 30yr
- Down + closing
- —
- Monthly P&I
- —
- Monthly cashflow
- —
- DSCR
- —
- Eligible?
- —
No personal income docs; deal must DSCR.
Hard money
10% down · 12.0% · 12mo
- Down + closing
- —
- Monthly P&I
- —
- Monthly cashflow
- —
- DSCR
- —
- Eligible?
- —
Short-term bridge; refi at stabilization.
Rent comps 3 comps
| Address | Beds | Baths | Sqft | Rent | $/sqft | DOM | Units | Dist |
|---|---|---|---|---|---|---|---|---|
| 1024 Bunbury Dr Whittier, CA | 4.0 | 2.0 | 1414 | $1,500 | $1.06 | 2d | 1 | 0.92mi |
| 1418 9th Ave Hacienda Heights, CA | 4.0 | 4.0 | 1959 | $1,100 | $0.56 | 4d | 1 | 1.32mi |
| 1842 Whittier Woods Cir Whittier, CA | 4.0 | 2.0 | 1587 | $2,800 | $1.76 | 21d | 1 | 1.34mi |
Listing history 16 events
-
2026-06-18days on market $327,999 Active 45 DOM
-
2026-06-17days on market $327,999 Active 44 DOM
-
2026-06-16days on market $327,999 Active 43 DOM
-
2026-06-15days on market $327,999 Active 42 DOM
-
2026-06-13days on market $327,999 Active 40 DOM
-
2026-06-09days on market $327,999 Active 36 DOM
-
2026-06-08days on market $327,999 Active 35 DOM
-
2026-06-07days on market $327,999 Active 34 DOM
-
2026-06-04days on market $327,999 Active 31 DOM
-
2026-06-03days on market $327,999 Active 30 DOM
-
2026-06-02days on market $327,999 Active 29 DOM
-
2026-06-01days on market $327,999 Active 28 DOM
-
2026-05-31days on market $327,999 Active 27 DOM
-
2026-05-04$327,999 Active 987-char remark
-
2024-03-14historical
-
2023-09-14$448,998 Active
ⓘ Source: listings_history table (triggers on properties + properties_extension) + one-shot
backfill from property_details.listing_events for pre-trigger history.
Tax reassessment forecast CA · Resets to sale price
- Current annual tax
- $780 · $65/mo
- Projected year-2 tax
- $2,493 · $208/mo
- Expected delta
- +$1,713/yr (+$143/mo · 219.7%)
ⓘ Screening estimate from a state-policy table — verify with the county assessor before closing.
Climate risk First Street
- Flood 5/10 Major FEMA zone X (unshaded) · 26% chance over 30 yrs
- Wildfire 5/10 Major
- Heat 6/10 Major 7 d/yr ≥100°F today · 21 d/yr by 30 yrs out
- Wind 1/10 Low
- Air quality 6/10 Major 9 unhealthy d/yr today · 10 by 30 yrs out
Nearby sold comps map
Loading sold comps map…
Walkable amenities ~0.75 mi
Loading nearby amenities…
Taxation est. · year 1
- Rental income
- $34,997
- − Mortgage interest
- −$18,373
- − Property taxes
- −$780
- − Insurance
- −$1,640
- − Repairs & maintenance
- −$2,800
- − Management
- −$2,800
- − Depreciation
- −$9,542
- Taxable loss
- −$937
- Est. tax savings @ 24.0%
- +$225
- After-tax cash flow
- $4,812/yr
For passive investors: Depreciation is non-cash, so a rental often shows a tax loss while cash-flowing — sheltering income. Rental losses are passive: they offset passive income freely, and up to $25,000/yr can offset ordinary (W-2) income if you actively participate and your MAGI is under $100k (phasing out to $0 by $150k); unused losses carry forward. On sale, claimed depreciation is recaptured at up to 25%, and gains may owe capital-gains tax (a 1031 exchange can defer both). Figures are a year-1 estimate at your 24.0% rate — not tax advice; consult a CPA.
Condition & rehab AI · 6 photos
This move-in ready manufactured home is in good condition with fresh paint and new flooring. It offers a good investment opportunity with minimal maintenance required.
Value-add opportunities
- Resale Paint the exterior again in 5 years — Fresh paint can enhance curb appeal and property value.
- Rental Replace the HVAC filter annually — Maintaining HVAC systems ensures comfort and reduces maintenance costs for tenants.
Renovation cost estimate screening
Value-add ROI direction
- Resale Paint the exterior again in 5 years — Fresh paint can enhance curb appeal and property value. ↑
- Rental Replace the HVAC filter annually — Maintaining HVAC systems ensures comfort and reduces maintenance costs for tenants. ↑
ⓘ Cost ranges are severity-bucket heuristics (US national rule-of-thumb). Get contractor quotes + a written scope before underwriting a rehab budget.
Schools (NCES district)
- District
- Hacienda La Puente Unified
- NCES district ID
- 0616325
- Math proficiency
- 41% ▲ 2.00%
- Reading proficiency
- 55% ▲ 3.00%
- Median HH income
- $67,275
- Composite
- 44.85/100
- National rank
- #5921
- State rank
- #443 of 1400 in CA
Livability — Hacienda Heights
- Score
- 57/100
- State rank
- #732
- US rank
- #21583
Category grades
Schools grade is shown separately in the Schools card above.
Census & demographics
- Census place
- Hacienda Heights, CA
- County
- Los Angeles County · 9,444,647 people
- City population
- 54,351
- Metro
- Los Angeles-Long Beach-Anaheim, CA
- Population (ZIP)
- 54,351
- Household income
- $109,183
- Rent vs Own
- Severe rent burden
- 907.0
Population outlook (Los Angeles County) Hauer SSP2
- Today (2025)
- 10,940,515 people
- By 2030
- 11,256,481 · +2.9%
- By 2040
- 11,729,929 · +7.2%
- By 2050
- 11,948,407 · +9.2%
- By 2075
- 11,818,114 · +8.0%
- By 2100
- 10,842,928 · -0.9%
Race, ethnicity, and origin ACS 2023
- Neighborhood character
- Diverse neighborhood (Simpson 0.63)
- Race & ethnicity
- Hispanic / Latino 43% Asian 41% White 12% Two or more races 12%
- Hispanic origin (detail)
- Mexican 35%
- Common ancestry
- Lithuanian 1% Slovak 1% Romanian 1%
- Foreign-born
- 40% · China, Canada, Vietnam
- Languages at home
- 37% English-only · Spanish 28% Chinese 25% Other Asian/Pacific 3%
Political lean MEDSL · Los Angeles
- 2024 margin
- Solid D (+32.9) · D 64.8% · R 31.9% · Other 3.3%
- 2008→2024 swing
- -7.4pp toward R · 2008: 40.4pp · 2024: 32.9pp
- All cycles
- 2024: D+32.9 2020: D+44.2 2016: D+48.0 2012: D+40.0 2008: D+40.4
Not yet ingested
- Civics
- —
Market trends
- HPI YoY
- ▼ -795.07%
- Current HPI
- 415.3057
- Rent YoY
- ▲ 1.02%
- Metro
- Los Angeles-Long Beach-Anaheim, CA
- State GDP YoY
- ▲ 3.21%
- F500 in state
- 116
Industry mix (Fortune 500 HQ in CA)
| Industry | F500 HQs | Revenue |
|---|---|---|
| Technology | 27 | $1,492B |
|
||
| Financial Services | 3 | $174B |
|
||
| Retail | 3 | $44B |
|
||
| Insurance | 3 | $26B |
|
||
| Media / Entertainment | 2 | $115B |
|
||
| Pharmaceuticals / Biotech | 2 | $62B |
|
||
Price history
-26.9% since first listed3 events — show timeline
- 2026-05-04 Listed $327,999 CRMLS
- 2024-03-14 Listing Removed — CRMLS
- 2023-09-14 Listed $448,998 CRMLS
Property tax history
+4.4%/yrLatest (2025): $780 · +4.4% YoY. Source: county tax records.
Cash-flow waterfall
monthlySold comps — $/sqft
last 12 mo · ≤1 miLoading sold comps…