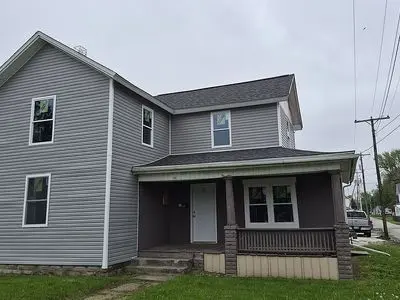
110 N Tarr St · North Baltimore, OH
Flood risk 1/10 · Minimal
- FEMA flood zone
- X (unshaded)
- Chance of flooding over 30 yrs
- 0.0%
- Est. flood insurance / yr
- $507 – $1,088
Fire risk 1/10 · Minimal
- Est. fire insurance / yr
- $713 – $1,323
Heat risk 3/10 · Minor
- Hot days now (above 99°F)
- 7 days/yr
- Hot days in 30 yrs
- 17 days/yr
Wind risk 2/10 · Minimal
- Chance of severe wind over 30 yrs
- —
Air-quality risk 2/10 · Minimal
- Unhealthy air days now
- 1 days/yr
- Unhealthy air days in 30 yrs
- 2 days/yr
Risk factors via First Street. Map © Google.
Why this score? — see what drove the C- grade
The composite is a weighted blend of 9 inputs, each scored 0–100. Each bar is that input's sub-score; the figure is the points it added to the 100-point composite (weight × sub-score).
- Cash flow +19.9/30.0
- ARV discount +8.3/15.0
- DSCR +6.3/10.0
- 1% rule +4.7/10.0
- Schools +4.4/10.0
- Livability +3.9/5.0
- Rent growth +2.5/5.0
- Condition / age +2.5/5.0
- Appreciation +0.0/10.0
$130,000
🖨 Deal sheet (PDF) 📄 Offer letter ✓ Due diligence
Listing remarks MLS
To be sold by cash at closing or on terms acceptable to the Seller. Goddard Murphy & Co. Listing. For more information contact Doug Goddard - 419 619 7000. Affordable single floor plan home located in an established neighborhood. Some updates with lots of potential. Seller addenda are required with initial offer to purchase. Contact Lister for required documents.
Key facts
- Built 1900
- Listed 35 days
Neighborhood map
What this means for you Summary
Snapshot
- This is a 2-bed/1.0-bath single-family listed at $130k.
Deal economics
- At list price, monthly cash flow is $156 ($2k/yr) — positive.
- The deal already cash-flows at list — no discount required.
- To meet the 1% rule (rent ≥ 1% of price), the offer needs to be $126k (2.9% below list).
- Recommended offer: $126k (3.0% below list) — sets the bar for market timing.
- Cap rate 7.7% vs local median 5.9% in North Baltimore — top-decile yield for the area; either an underpriced asset or a hidden risk that comps aren't pricing in. Stress-test before assuming the spread holds.
Location & tenants
- Location reads 78/100 on livability (#159 in OH, #2,395 nationally) — a middle-class / working-renter tenant base. Strengths: cost of living A+, housing A+, health & safety A+; Watch: amenities F, commute F.
- North Baltimore Local (town): math 45% / reading 58% proficiency, ranked #424 of 656 in OH (top 65%) — acceptable for families but not a draw, mixed tenant base, ~2y average lease.
- Zoned schools: E A Powell Elementary School (math 47% / reading 57%, grade C-, #851 of 1,584 statewide, top 56%, 367 students, 46% FRL); North Baltimore Middle School (math 52% / reading 57%, grade B-, #342 of 654 statewide, top 54%, 95 students, 0% FRL); North Baltimore High School (math 34% / reading 74%, grade C-, #303 of 781 statewide, top 42%, 136 students, 84% FRL) — zoned schools at 43% FRL track the district average.
- Market conditions: 33 active listings in the ZIP; 493 units permitted in Wood County in 2024 (48 in 5+ unit buildings).
Forward outlook
- Local home prices are declining (-3.0%/yr); year-one equity from $899 of loan paydown is wiped out by about $4k of value loss. Plan a longer hold.
- Wood County population projected at +14% by 2050 — modest demand growth; plan on rents tracking national, not racing it.
Negotiation context
- It's been on market 35 days — a 3% lower offer ($126k) is reasonable based on typical stale-listing flexibility.
- 5 sale attempts since 16y ago with the ask held roughly flat each time — persistent listings suggest the price (not the market) is what's stuck; bring a comps-based counter.
- Current owner paid $18k; list at $130k implies a 622% gain — meaningful room to come down on a strong offer.
Risks & watch-outs
- Watch-outs: built in 1900 — expect roof / HVAC / electrical / plumbing capex.
Questions for the listing agent
- It's been on market 35 days. Have you received any prior offers? Is the seller open to a 3% concession, seller financing, or rate buy-down credit?
- Built in 1900 — when were the roof, HVAC, electrical panel, plumbing, and water heater last replaced?
- Is there a deadline driving the sale (1031 exchange, divorce, estate, relocation)? That informs how much negotiation room exists.
- Schools are B-rated — typically a magnet for longer-tenancy family renters. What's the average tenant stay here, and is there a school-zone premium baked into asking?
- What's the average days-on-market for RENTAL listings here right now (not sales)? A rising rental-DOM trend means longer vacancies and softer asking-rent achievability than the comps imply.
- What's the recent tenant-quality profile in this submarket — average credit score on applications, eviction rate, late-payment / NSF rate, and stable-employment percentage? A property-management company in the area should have these aggregated.
- How much new for-sale + rental construction is in the pipeline within 1–3 miles? Heavy new supply typically softens prices + rents 12–24 months out; constrained supply supports both.
Investment metrics
- 1% rule
- 0.97% ✗
- Cap rate
- 7.73%
- Cash-on-cash
- 5.15%
- DSCR
- 1.23
- GRM
- 8.6
CMA / ARV
- ARV (on-the-fly)
- $132,288
- Comps found
- 12
Show comp detail 12 sales within ~0.75 mi
| Address | Dist | Beds/Ba | Sqft | Sold | Price | $/sf | Match |
|---|---|---|---|---|---|---|---|
| 216 S Tarr St | 0.30mi | 2/1.0 | 1,406 (+2%) | 6mo | $39,900 | $28 | 78 |
| 114 N Beecher St | 0.15mi | 3/1.0 (+1) | 1,478 (+7%) | 2mo | $45,000 | $30 | 74 |
| 318 Belmont St | 0.38mi | 2/1.0 | 1,344 (-2%) | 7mo | $129,000 | $96 | 72 |
| 306 S 2nd St | 0.38mi | 3/1.0 (+1) | 1,358 (-2%) | 4mo | $49,900 | $37 | 71 |
| 103 Smith St | 0.39mi | 3/1.0 (+1) | 1,350 (-2%) | 5mo | $116,500 | $86 | 70 |
| 129 Central Ave | 0.33mi | 3/1.0 (+1) | 1,358 (-2%) | 12mo | $152,500 | $112 | 68 |
| 314 Jewett Ave | 0.51mi | 2/1.0 | 1,420 (+3%) | 11mo | $134,000 | $94 | 62 |
| 114 East St | 0.15mi | 3/2.0 (+1) | 1,536 (+12%) | 6mo | $172,000 | $112 | 60 |
| 323 W State St | 0.33mi | 3/1.0 (+1) | 1,224 (-11%) | 8mo | $96,000 | $78 | 55 |
| 815 George St | 0.60mi | 3/2.0 (+1) | 1,404 (+2%) | 8mo | $224,000 | $160 | 53 |
| 209 Rudolph Rd | 0.43mi | 3/2.0 (+1) | 1,518 (+10%) | 7mo | $218,500 | $144 | 48 |
| 201 Briar Hill Rd | 0.69mi | 2/2.0 | 1,532 (+11%) | 6mo | $242,900 | $159 | 40 |
Match score weights: distance 35% · size 25% · config 20% · recency 20%. Top-matched comps best support the ARV.
Projected returns pro-forma
-3.0% appreciation · 3.0% rent growth · sell at horizon
- IRR
- -8.3%
- Equity multiple
- 0.69×
- Total profit
- $-11,140
- Equity at exit
- $19,383
- IRR
- 1.2%
- Equity multiple
- 1.08×
- Total profit
- $3,037
- Equity at exit
- $11,240
Cash invested: $36,400 (down + closing). Projections, not guarantees.
Landlord ↔ Tenant lean methodology
- Overall (STATE)
- 73 Landlord-Friendly
- State Ohio
- 73 Landlord-Friendly · R+6
- County
- — inherits STATE
- City
- — inherits STATE
ZIP-level market 45872
- Home prices YoY
- -11.5%
- Active inventory
- 33
- Price-to-rent
- 8.6×
Monthly cashflow live
- Estimated rent
- $1,263 medium interval (Pro) →
- Mortgage (P&I)
- −$682
- Tax from tax record
- −$106 /mo · $1,267/yr
- Insurance
- −$54
- HOA
- −$0
- Vacancy / Maint / Mgmt
- −$265
- Net cashflow
- $156
Break-even live
Sensitivity live
| Price | -10% $230 | -5% $193 | +0% $156 | +5% $119 | +10% $83 |
|---|---|---|---|---|---|
| Rent | -10% $56 | -5% $106 | +0% $156 | +5% $206 | +10% $256 |
| Rate | -1.0pp $222 | -0.5pp $189 | base $156 | +0.5pp $122 | +1.0pp $88 |
UW: 25.0% down · 7.5% · 30yr · 1.5% tax · 5.0% vac · 8.0% maint · 8.0% mgmt
Financing live
Cash to close
- Down payment
- $32,500
- Closing costs
- $3,900
- Reserves months
- —
- Total cash needed
- —
Loan-product check · same deal, 3 products live
Conventional
25% down · 7.5% · 30yr
- Down + closing
- —
- Monthly P&I
- —
- Monthly cashflow
- —
- DSCR
- —
- Eligible?
- —
Personal DTI + credit; lowest rate.
DSCR
20% down · 8.5% · 30yr
- Down + closing
- —
- Monthly P&I
- —
- Monthly cashflow
- —
- DSCR
- —
- Eligible?
- —
No personal income docs; deal must DSCR.
Hard money
10% down · 12.0% · 12mo
- Down + closing
- —
- Monthly P&I
- —
- Monthly cashflow
- —
- DSCR
- —
- Eligible?
- —
Short-term bridge; refi at stabilization.
Listing history 29 events
-
2026-06-17status $130,000 Under Contract 35 DOM
-
2026-06-16days on market $130,000 Active 35 DOM
-
2026-06-15days on market $130,000 Active 34 DOM
-
2026-06-13days on market $130,000 Active 32 DOM
-
2026-06-12days on market $130,000 Active 31 DOM
-
2026-06-09days on market $130,000 Active 28 DOM
-
2026-06-08days on market $130,000 Active 27 DOM
-
2026-06-08days on market $130,000 Active 26 DOM
-
2026-06-07days on market $130,000 Active 25 DOM
-
2026-06-04days on market $130,000 Active 22 DOM
-
2026-06-02days on market $130,000 Active 21 DOM
-
2026-06-01days on market $130,000 Active 20 DOM
-
2026-05-31days on market $130,000 Active 19 DOM
-
2026-05-12$130,000 Active 925-char remark
-
2012-02-22soldstatus $18,000
-
2012-02-17soldstatus $18,000 372-char remark
Show marketing remark (372 chars)
To be sold by cash at closing or on terms acceptable to the Seller. Goddard Murphy & Co. Listing. For more information contact Doug Goddard - 419 619 7000. Affordable single floor plan home located in an established neighborhood. Some updates with lots of potential. Seller addenda are required with initial offer to purchase. Contact Lister for required documents.
-
2012-02-17soldstatus $18,000
Show marketing remark (372 chars)
To be sold by cash at closing or on terms acceptable to the Seller. Goddard Murphy & Co. Listing. For more information contact Doug Goddard - 419 619 7000. Affordable single floor plan home located in an established neighborhood. Some updates with lots of potential. Seller addenda are required with initial offer to purchase. Contact Lister for required documents.
-
2011-11-15$24,999 372-char remark
Show marketing remark (372 chars)
To be sold by cash at closing or on terms acceptable to the Seller. Goddard Murphy & Co. Listing. For more information contact Doug Goddard - 419 619 7000. Affordable single floor plan home located in an established neighborhood. Some updates with lots of potential. Seller addenda are required with initial offer to purchase. Contact Lister for required documents.
-
2011-11-15$18,000
Show marketing remark (372 chars)
To be sold by cash at closing or on terms acceptable to the Seller. Goddard Murphy & Co. Listing. For more information contact Doug Goddard - 419 619 7000. Affordable single floor plan home located in an established neighborhood. Some updates with lots of potential. Seller addenda are required with initial offer to purchase. Contact Lister for required documents.
-
2011-09-09historical
-
2011-09-09historical
-
2010-12-14$29,900
-
2010-12-14$29,900
-
2010-09-23soldstatus $4,600
-
2010-09-23soldstatus $46,000
-
2005-07-15soldstatus $79,500
-
1995-07-18soldstatus $52,000
-
1993-09-16soldstatus $50,500
-
1991-12-09soldstatus $50,500
ⓘ Source: listings_history table (triggers on properties + properties_extension) + one-shot
backfill from property_details.listing_events for pre-trigger history.
Tax reassessment forecast OH · Partial reset (capped growth)
- Current annual tax
- $1,267 · $106/mo
- Projected year-2 tax
- $1,648 · $137/mo
- Expected delta
- +$380/yr (+$32/mo · 30.0%)
ⓘ Screening estimate from a state-policy table — verify with the county assessor before closing.
Climate risk First Street
- Flood 1/10 Low FEMA zone X (unshaded) · 0% chance over 30 yrs
- Wildfire 1/10 Low
- Heat 3/10 Moderate 7 d/yr ≥99°F today · 17 d/yr by 30 yrs out
- Wind 2/10 Low
- Air quality 2/10 Low 1 unhealthy d/yr today · 2 by 30 yrs out
Nearby sold comps map
Loading sold comps map…
Walkable amenities ~0.75 mi
Loading nearby amenities…
Taxation est. · year 1
- Rental income
- $15,153
- − Mortgage interest
- −$7,282
- − Property taxes
- −$1,267
- − Insurance
- −$650
- − Repairs & maintenance
- −$1,212
- − Management
- −$1,212
- − Depreciation
- −$3,782
- Taxable loss
- −$252
- Est. tax savings @ 24.0%
- +$61
- After-tax cash flow
- $1,934/yr
For passive investors: Depreciation is non-cash, so a rental often shows a tax loss while cash-flowing — sheltering income. Rental losses are passive: they offset passive income freely, and up to $25,000/yr can offset ordinary (W-2) income if you actively participate and your MAGI is under $100k (phasing out to $0 by $150k); unused losses carry forward. On sale, claimed depreciation is recaptured at up to 25%, and gains may owe capital-gains tax (a 1031 exchange can defer both). Figures are a year-1 estimate at your 24.0% rate — not tax advice; consult a CPA.
Schools (NCES district)
- District
- North Baltimore Local
- NCES district ID
- 3905070
- Math proficiency
- 45% ▼ -21.00%
- Reading proficiency
- 58% ▼ -12.00%
- Median HH income
- $47,242
- Composite
- 43.72/100
- National rank
- #2951
- State rank
- #424 of 656 in OH
Livability — North Baltimore
- Score
- 78/100
- State rank
- #159
- US rank
- #2395
Category grades
Schools grade is shown separately in the Schools card above.
Census & demographics
- Census place
- North Baltimore, OH
- County
- Wood · 127,168 people
- City population
- 4,572
- Metro
- Toledo, OH
- Population (ZIP)
- 4,572
- Household income
- $62,380
- Rent vs Own
- Severe rent burden
- 3.8
Population outlook (Wood County) Hauer SSP2
- Today (2025)
- 138,744 people
- By 2030
- 143,189 · +3.2%
- By 2040
- 150,896 · +8.8%
- By 2050
- 158,589 · +14.3%
- By 2075
- 182,166 · +31.3%
- By 2100
- 196,533 · +41.7%
Race, ethnicity, and origin ACS 2023
- Neighborhood character
- Predominantly White (94%)
- Race & ethnicity
- White 94% Hispanic / Latino 4% Two or more races 2% Black 2%
- Common ancestry
- Iranian 4% Romanian 2% Slovak 1%
- Foreign-born
- 0%
- Languages at home
- 98% English-only · Spanish 2%
Political lean MEDSL · Wood
- 2024 margin
- R (+10.2) · D 44.4% · R 54.6%
- 2008→2024 swing
- -17.3pp toward R · 2008: 7.1pp · 2024: -10.2pp
- All cycles
- 2024: R+10.2 2020: R+7.6 2016: R+8.5 2012: D+4.2 2008: D+7.1
Not yet ingested
- Civics
- —
Market trends
- HPI YoY
- ▼ -29.19%
- Current HPI
- 225.1072
- Rent YoY
- —
- Metro
- —
- State GDP YoY
- ▲ 1.98%
- F500 in state
- 48
Industry mix (Fortune 500 HQ in OH)
| Industry | F500 HQs | Revenue |
|---|---|---|
| Insurance | 3 | $145B |
|
||
| Industrial Machinery | 3 | $49B |
|
||
| Financial Services | 3 | $24B |
|
||
| Consumer Goods | 2 | $93B |
|
||
| Aerospace / Defense | 2 | $47B |
|
||
| Utilities | 2 | $33B |
|
||
Price history
+157.4% since first listed17 events — show timeline
- 2026-06-16 Pending — FSBO.com
- 2026-05-12 Listed $130,000 FSBO.com
- 2012-02-22 Sold (Public Records) $18,000 Public Records
- 2012-02-17 Sold (MLS) $18,000 NORIS
- 2012-02-17 Sold (MLS) $18,000 NORIS
- 2011-11-15 Listed $24,999 NORIS
- 2011-11-15 Listed $18,000 NORIS
- 2011-09-09 Listing Removed — NORIS
- 2011-09-09 Listing Removed — NORIS
- 2010-12-14 Listed $29,900 NORIS
- 2010-12-14 Listed $29,900 NORIS
- 2010-09-23 Sold (Public Records) $46,000 Public Records
- 2010-09-23 Sold (Public Records) $4,600 Public Records
- 2005-07-15 Sold (Public Records) $79,500 Public Records
- 1995-07-18 Sold (Public Records) $52,000 Public Records
- 1993-09-16 Sold (Public Records) $50,500 Public Records
- 1991-12-09 Sold (Public Records) $50,500 Public Records
Property tax history
+1.7%/yrLatest (2025): $1,267 · +1.1% YoY. Source: county tax records.
Cash-flow waterfall
monthlySold comps — $/sqft
last 12 mo · ≤1 miLoading sold comps…