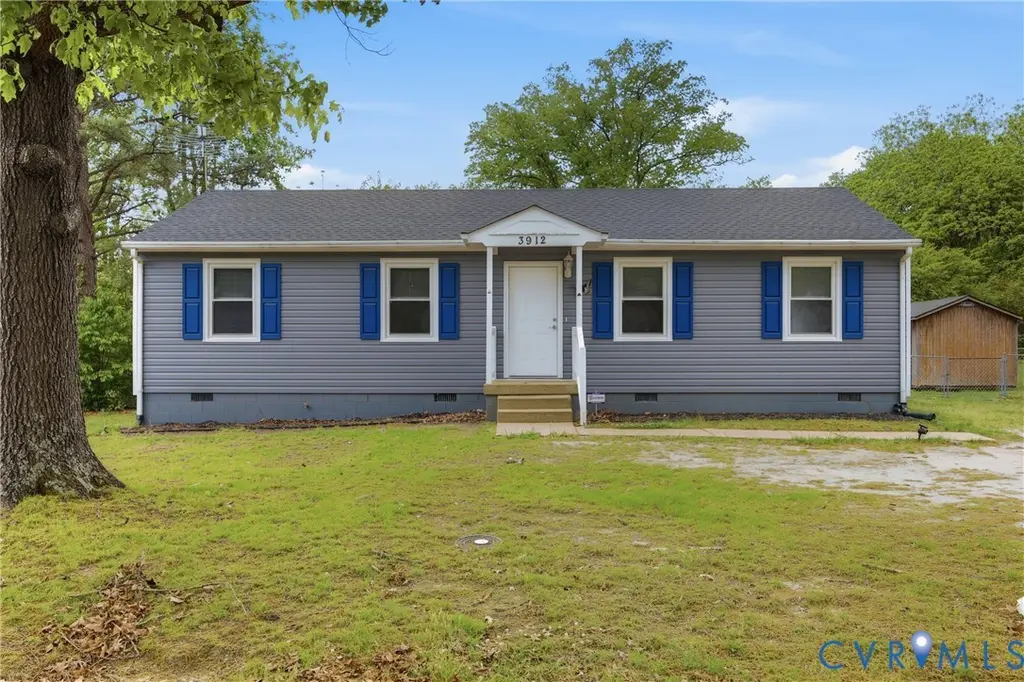
3912 Robert E Lee Dr · Hopewell, VA
Flood risk 1/10 · Minimal
- FEMA flood zone
- X (unshaded)
- Chance of flooding over 30 yrs
- 0.0%
- Est. flood insurance / yr
- $507 – $1,088
Fire risk 1/10 · Minimal
- Est. fire insurance / yr
- $666 – $1,236
Heat risk 8/10 · Major
- Hot days now (above 108°F)
- 7 days/yr
- Hot days in 30 yrs
- 16 days/yr
Wind risk 6/10 · Moderate
- Chance of severe wind over 30 yrs
- 49.0%
Air-quality risk 2/10 · Minimal
- Unhealthy air days now
- 1 days/yr
- Unhealthy air days in 30 yrs
- 2 days/yr
Risk factors via First Street. Map © Google.
Why this score? — see what drove the D grade
The composite is a weighted blend of 9 inputs, each scored 0–100. Each bar is that input's sub-score; the figure is the points it added to the 100-point composite (weight × sub-score).
- Cash flow +12.3/30.0
- ARV discount +6.3/15.0
- Schools +6.1/10.0
- Rent growth +4.7/5.0
- DSCR +3.7/10.0
- Livability +3.5/5.0
- 1% rule +2.6/10.0
- Condition / age +2.5/5.0
- Appreciation +0.0/10.0
$239,900
🖨 Deal sheet (PDF) 📄 Offer letter ✓ Due diligence
Listing remarks
Less than five minutes from Fort Lee, this move-in ready home offers easy one-level living with a light, comfortable feel throughout. The living room flows right into the dining area and kitchen, making the space feel connected and easy to live in. The kitchen gets great natural light and has plenty of cabinet space, while the full bath has been nicely updated with a brand new shower in 2025. You’ll also have peace of mind with a new HVAC system installed in 2025. Out back, there’s a spacious yard with plenty of room to relax, garden, or entertain. The rear deck is a great spot for morning coffee or winding down in the evening, and the two storage sheds give you extra space for
Key facts
- 0.31 acre lot
- Built 1981
- Listed 9 days
Property features AI
Exterior
- Parking: Off-street parking
- Utilities: Public water; Public sewer
- Home design: Single-story home; Resale property
- Construction: Frame construction with drywall and vinyl siding; Composition shingle roof; Built as actual year (year built details available)
- Exterior features: Deck; Stoop; Storage shed; Fenced backyard
Interior
- Kitchen: Electric cooking; Oven; Stove
- Bedrooms: Bedroom on main level
- Flooring: Partially carpeted; Vinyl
- Bathrooms: 1 full bathroom with tub & shower; 1 half bathroom
- Heating & cooling: Heat pump; Electric baseboard heating; Central air conditioning
- Interior features: Sliding doors; Ceiling fan(s); Dining area; Bath in primary bedroom; Main-level primary bedroom
- Laundry & utility: Washer hookup; Dryer hookup; Electric water heater
Neighborhood map
What this means for you Summary
Snapshot
- This is a 3-bed/1.5-bath single-family listed at $240k.
Deal economics
- At list price, monthly cash flow is $-43 ($-519/yr) — negative.
- To cash-flow at today's rent, offer at most $232k (3.2% below list).
- To meet the 1% rule (rent ≥ 1% of price), the offer needs to be $182k (24.3% below list).
- Recommended offer: $182k (24.3% below list) — sets the bar for 1% rule.
- Cap rate 6.1% vs local median 4.2% in Hopewell — top-decile yield for the area; either an underpriced asset or a hidden risk that comps aren't pricing in. Stress-test before assuming the spread holds.
Location & tenants
- Location reads 70/100 on livability (#224 in VA) — a middle-class / working-renter tenant base. Strengths: cost of living A+, health & safety A+, housing A-; Watch: crime D+, amenities F, commute F.
- Prince George County Public School District (rural): math 67% / reading 75% proficiency, ranked #16 of 131 in VA (top 12%) — strong family-tenant draw, lease renewals of 3-5y typical.
- Zoned schools: L.L. Beazley Elementary (math 82% / reading 86%, grade A+, #87 of 1,108 statewide, top 8%, 584 students, 65% FRL); J.E.J. Moore Middle (math 61% / reading 71%, grade A-, #113 of 342 statewide, top 33%, 1,393 students, 33% FRL); Prince George High (math 70% / reading 82%, grade A-, #102 of 319 statewide, top 32%, 1,796 students, 31% FRL) — zoned schools average 43% FRL vs 28% district-wide (15 pts higher); higher-poverty schools than district average — tighter screening recommended.
- Market conditions: Rents rising fast (+8.9%/yr); 234 active listings in the ZIP; 10 comparable units currently listed for rent nearby; rentals leasing fast (median 12d on market — plan ~1-2 weeks tenant-placement turnaround); 72 units permitted in Prince George County in 2024 (0 in 5+ unit buildings).
- This rent runs 35% of the median local income ($62k/yr) — at the standard rent-burdened threshold; future hikes will face affordability resistance.
Forward outlook
- Local home prices are declining (-3.0%/yr); year-one equity from $2k of loan paydown is wiped out by about $7k of value loss. Plan a longer hold.
- Prince George County population projected at +36% by 2050 — long-run rental-demand tailwind backs the buy-and-hold thesis.
Negotiation context
- Only 9 days on market — expect competitive offers; lowballing is unlikely to land.
Risks & watch-outs
- Climate carrying-cost: major wind risk, 49% chance of damaging wind over 30y; extreme-heat days projected 7→16/yr by 2055 (HVAC capex compounding) — expect insurance premiums to compound above CPI over the hold.
Questions for the listing agent
- What do current leases actually rent for vs. the listed asking? Can we see a recent rent roll and the last 12 months of T-12 income?
- Is there a deadline driving the sale (1031 exchange, divorce, estate, relocation)? That informs how much negotiation room exists.
- Schools are A-rated — typically a magnet for longer-tenancy family renters. What's the average tenant stay here, and is there a school-zone premium baked into asking?
- Crime grade is D in this area — have there been break-ins, vandalism, or insurance claims at this property in the last 3 years? What carrier currently insures it and at what premium?
- The area grade is low — what's the realistic commute time and amenity access for the typical tenant pool here? Any planned neighborhood developments (good or bad) we should know about?
- What's the average days-on-market for RENTAL listings here right now (not sales)? A rising rental-DOM trend means longer vacancies and softer asking-rent achievability than the comps imply.
- What's the recent tenant-quality profile in this submarket — average credit score on applications, eviction rate, late-payment / NSF rate, and stable-employment percentage? A property-management company in the area should have these aggregated.
- How much new for-sale + rental construction is in the pipeline within 1–3 miles? Heavy new supply typically softens prices + rents 12–24 months out; constrained supply supports both.
Investment metrics
- 1% rule
- 0.76% ✗
- Cap rate
- 6.08%
- Cash-on-cash
- -0.77%
- DSCR
- 0.97
- GRM
- 11.0
CMA / ARV
- ARV (median comp)
- $233,495
- List price
- $239,900
- Delta
- 2.74%
- Verdict
- FAIR
- Comps
- 20 within 1.0 mi
Show comp detail 12 sales within ~0.75 mi
| Address | Dist | Beds/Ba | Sqft | Sold | Price | $/sf | Match |
|---|---|---|---|---|---|---|---|
| 3912 Robert E Lee Dr | 0.00mi | 3/1.5 | 1,104 (0%) | 1mo | $235,000 | $213 | 99 |
| 3700 Butor Rd | 0.24mi | 3/1.5 | 1,104 (0%) | 11mo | $229,000 | $207 | 80 |
| 4016 Old Iron Rd | 0.21mi | 3/1.5 | 1,104 (0%) | 15mo | $219,950 | $199 | 78 |
| 3802 Brandywine Dr | 0.30mi | 3/2.0 | 1,151 (+4%) | 1mo | $287,000 | $249 | 76 |
| 4000 Brandywine Dr | 0.21mi | 3/1.5 | 1,151 (+4%) | 9mo | $219,000 | $190 | 76 |
| 4007 Old Iron Rd | 0.24mi | 3/1.5 | 1,151 (+4%) | 12mo | $224,000 | $195 | 72 |
| 3909 Old Iron Rd | 0.24mi | 3/1.5 | 1,150 (+4%) | 15mo | $270,000 | $235 | 69 |
| 3813 Lafayette St | 0.30mi | 3/2.0 | 1,224 (+11%) | 0mo | $274,500 | $224 | 66 |
| 3803 London Rd | 0.33mi | 3/1.5 | 1,151 (+4%) | 16mo | $200,000 | $174 | 65 |
| 1903 Dinwiddie Ave | 0.66mi | 3/1.0 | 1,108 (+0%) | 15mo | $275,000 | $248 | 54 |
| 3626 Gilbert St | 0.73mi | 3/2.0 | 1,056 (-4%) | 3mo | $245,000 | $232 | 54 |
| 3614 Madison St | 0.46mi | 3/1.0 | 1,254 (+14%) | 8mo | $150,000 | $120 | 47 |
Match score weights: distance 35% · size 25% · config 20% · recency 20%. Top-matched comps best support the ARV.
Projected returns pro-forma
-3.0% appreciation · 8.0% rent growth · sell at horizon
- IRR
- -12.7%
- Equity multiple
- 0.52×
- Total profit
- $-32,112
- Equity at exit
- $35,770
- IRR
- 2.1%
- Equity multiple
- 1.18×
- Total profit
- $11,840
- Equity at exit
- $20,742
Cash invested: $67,172 (down + closing). Projections, not guarantees.
Landlord ↔ Tenant lean methodology
- Overall (STATE)
- 55 Moderately Landlord-Leaning
- State Virginia
- 55 Moderately Landlord-Leaning · D+2
- County
- — inherits STATE
- City
- — inherits STATE
ZIP-level market 23860
- Home prices YoY
- -22.0%
- Rents YoY
- 8.9%
- Active inventory
- 234
- Price-to-rent
- 11.0×
Monthly cashflow live
- Estimated rent
- $1,816 high interval (Pro) →
- Mortgage (P&I)
- −$1,258
- Tax from tax record
- −$120 /mo · $1,440/yr
- Insurance
- −$100
- HOA
- −$0
- Vacancy / Maint / Mgmt
- −$381
- Net cashflow
- $-43
Break-even live
Sensitivity live
| Price | -10% $93 | -5% $25 | +0% $-43 | +5% $-111 | +10% $-179 |
|---|---|---|---|---|---|
| Rent | -10% $-187 | -5% $-115 | +0% $-43 | +5% $29 | +10% $100 |
| Rate | -1.0pp $78 | -0.5pp $18 | base $-43 | +0.5pp $-105 | +1.0pp $-169 |
UW: 25.0% down · 7.5% · 30yr · 1.5% tax · 5.0% vac · 8.0% maint · 8.0% mgmt
Financing live
Cash to close
- Down payment
- $59,975
- Closing costs
- $7,197
- Reserves months
- —
- Total cash needed
- —
Loan-product check · same deal, 3 products live
Conventional
25% down · 7.5% · 30yr
- Down + closing
- —
- Monthly P&I
- —
- Monthly cashflow
- —
- DSCR
- —
- Eligible?
- —
Personal DTI + credit; lowest rate.
DSCR
20% down · 8.5% · 30yr
- Down + closing
- —
- Monthly P&I
- —
- Monthly cashflow
- —
- DSCR
- —
- Eligible?
- —
No personal income docs; deal must DSCR.
Hard money
10% down · 12.0% · 12mo
- Down + closing
- —
- Monthly P&I
- —
- Monthly cashflow
- —
- DSCR
- —
- Eligible?
- —
Short-term bridge; refi at stabilization.
Rent comps 10 comps
| Address | Beds | Baths | Sqft | Rent | $/sqft | DOM | Units | Dist |
|---|---|---|---|---|---|---|---|---|
| 5000 Owens Way Prince George, VA | 1.0–4.0 | 1.0–4.0 | 1106 | $2,333 | $2.11 | 3d | 25 | 0.34mi |
| 4750 Baileys Ridge Dr Prince George, VA | 2.0–3.0 | 2.0 | 1028 | $1,490 | $1.45 | 3d | 4 | 0.38mi |
| 4001 London Rd North Prince George, VA | 3.0 | 1.5 | 1414 | $2,300 | $1.63 | 3d | 1 | 0.38mi |
| 4001 London Rd North Prince George, VA | 3.0 | 1.5 | 1414 | $2,300 | $1.63 | 12d | 1 | 0.38mi |
| 4399 Jefferson Pointe Ln Prince George, VA | 1.0–2.0 | 1.0–2.0 | 992 | $1,390 | $1.40 | 3d | 2 | 0.52mi |
| 3807 Woodlawn St Unit 8 Hopewell, VA | 2.0 | 1.0 | 900 | $1,095 | $1.22 | 6d | 1 | 0.94mi |
| 3502 Oaklawn Blvd Hopewell, VA | 3.0 | 1.0 | 1124 | $1,850 | $1.65 | 23d | 1 | 1.10mi |
| 3500 Oaklawn Blvd Hopewell, VA | 3.0 | 1.0 | 1000 | $1,650 | $1.65 | 19d | 1 | 1.10mi |
| 3309 Carlisle Ave Hopewell, VA | 3.0 | 1.0 | 1152 | $1,395 | $1.21 | 23d | 1 | 1.11mi |
| 3314 Granby St Hopewell, VA | 3.0 | 1.0 | 1469 | $1,600 | $1.09 | 25d | 1 | 1.18mi |
Listing history 6 events
-
2026-05-02status Pending 877-char remark
-
2026-04-24$239,900 Active 877-char remark
-
2026-04-22historical $239,900 877-char remark
-
2022-08-07price $1,375
-
2021-08-30soldstatus $110,000
-
1990-05-01soldstatus $51,000
ⓘ Source: listings_history table (triggers on properties + properties_extension) + one-shot
backfill from property_details.listing_events for pre-trigger history.
Tax reassessment forecast VA · Resets to sale price
- Current annual tax
- $1,440 · $120/mo
- Projected year-2 tax
- $1,967 · $164/mo
- Expected delta
- +$527/yr (+$44/mo · 36.6%)
ⓘ Screening estimate from a state-policy table — verify with the county assessor before closing.
Climate risk First Street
- Flood 1/10 Low FEMA zone X (unshaded) · 0% chance over 30 yrs
- Wildfire 1/10 Low
- Heat 8/10 Severe 7 d/yr ≥108°F today · 16 d/yr by 30 yrs out
- Wind 6/10 Major 49% chance of damaging wind over 30 yrs
- Air quality 2/10 Low 1 unhealthy d/yr today · 2 by 30 yrs out
Nearby sold comps map
Loading sold comps map…
Walkable amenities ~0.75 mi
Loading nearby amenities…
Taxation est. · year 1
- Rental income
- $21,794
- − Mortgage interest
- −$13,438
- − Property taxes
- −$1,440
- − Insurance
- −$1,200
- − Repairs & maintenance
- −$1,744
- − Management
- −$1,744
- − Depreciation
- −$6,979
- Taxable loss
- −$4,749
- Est. tax savings @ 24.0%
- +$1,140
- After-tax cash flow
- $621/yr
For passive investors: Depreciation is non-cash, so a rental often shows a tax loss while cash-flowing — sheltering income. Rental losses are passive: they offset passive income freely, and up to $25,000/yr can offset ordinary (W-2) income if you actively participate and your MAGI is under $100k (phasing out to $0 by $150k); unused losses carry forward. On sale, claimed depreciation is recaptured at up to 25%, and gains may owe capital-gains tax (a 1031 exchange can defer both). Figures are a year-1 estimate at your 24.0% rate — not tax advice; consult a CPA.
Schools (NCES district)
- District
- Prince George County Public School District
- NCES district ID
- 5103090
- Math proficiency
- 67% ▼ -17.00%
- Reading proficiency
- 75% ▼ -8.00%
- Median HH income
- $63,354
- Composite
- 61.44/100
- National rank
- #759
- State rank
- #16 of 131 in VA
Livability — Hopewell
- Score
- 70/100
- State rank
- #224
- US rank
- #7437
Category grades
Schools grade is shown separately in the Schools card above.
Census & demographics
- County
- Hopewell City · 31,404 people
- City population
- 31,404
- Metro
- Richmond, VA
- Population (ZIP)
- 31,404
- Household income
- $62,141
- Rent vs Own
- Severe rent burden
- 1055.0
Population outlook (Prince George County) Hauer SSP2
- Today (2025)
- 44,946 people
- By 2030
- 48,155 · +7.1%
- By 2040
- 54,455 · +21.2%
- By 2050
- 61,115 · +36.0%
- By 2075
- 78,510 · +74.7%
- By 2100
- 85,572 · +90.4%
Race, ethnicity, and origin ACS 2023
- Neighborhood character
- Diverse neighborhood (Simpson 0.64)
- Race & ethnicity
- White 43% Black 42% Two or more races 9% Hispanic / Latino 8% Asian 1%
- Hispanic origin (detail)
- Mexican 2% Puerto Rican 2%
- Common ancestry
- Slovak 1% Romanian 1% Serbian 1%
- Foreign-born
- 3% · Canada
- Languages at home
- 94% English-only · Spanish 4% German/W. Germanic 1%
Political lean MEDSL · Prince George
- 2024 margin
- Strong R (+21.3) · D 38.9% · R 60.2%
- 2008→2024 swing
- -11.2pp toward R · 2008: -10.1pp · 2024: -21.3pp
- All cycles
- 2024: R+21.3 2020: R+17.2 2016: R+17.0 2012: R+9.8 2008: R+10.1
Not yet ingested
- Civics
- —
Market trends
- HPI YoY
- ▼ -85.28%
- Current HPI
- 302.6343
- Rent YoY
- ▲ 8.86%
- Metro
- Richmond, VA
- State GDP YoY
- ▲ 2.40%
- F500 in state
- 50
Industry mix (Fortune 500 HQ in VA)
| Industry | F500 HQs | Revenue |
|---|---|---|
| Aerospace / Defense | 4 | $236B |
|
||
| Technology / Defense | 3 | $32B |
|
||
| Financial Services | 2 | $176B |
|
||
| Utilities | 2 | $27B |
|
||
| Insurance | 2 | $25B |
|
||
| Technology | 2 | $15B |
|
||
Price history
+360.8% since first listed7 events — show timeline
- 2026-05-29 Sold (MLS) $235,000 CVRMLS
- 2026-05-02 Pending — CVRMLS
- 2026-04-24 Listed $239,900 CVRMLS
- 2026-04-22 Coming Soon $239,900 CVRMLS
- 2022-08-07 Price Changed $1,375 RENT.
- 2021-08-30 Sold (Public Records) $110,000 Public Records
- 1990-05-01 Sold (Public Records) $51,000 Public Records
Property tax history
+6.5%/yrLatest (2025): $1,440 · +0.0% YoY. Source: county tax records.
Cash-flow waterfall
monthlySold comps — $/sqft
last 12 mo · ≤1 miLoading sold comps…