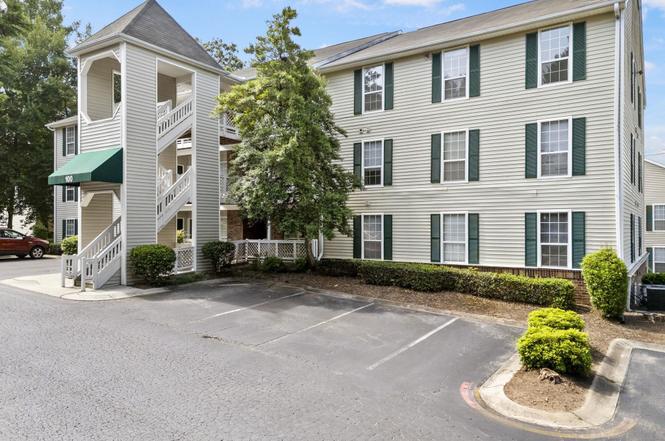
102 Calhoun St Unit 110 · Clemson, SC
Flood risk 1/10 · Minimal
- FEMA flood zone
- X (unshaded)
- Chance of flooding over 30 yrs
- 0.0%
- Est. flood insurance / yr
- $507 – $1,088
Fire risk 3/10 · Minor
- Est. fire insurance / yr
- $783 – $1,453
Heat risk 6/10 · Moderate
- Hot days now (above 106°F)
- 7 days/yr
- Hot days in 30 yrs
- 18 days/yr
Wind risk 2/10 · Minimal
- Chance of severe wind over 30 yrs
- 1.0%
Air-quality risk 4/10 · Minor
- Unhealthy air days now
- 3 days/yr
- Unhealthy air days in 30 yrs
- 5 days/yr
Risk factors via First Street. Map © Google.
Why this score? — see what drove the C grade
The composite is a weighted blend of 9 inputs, each scored 0–100. Each bar is that input's sub-score; the figure is the points it added to the 100-point composite (weight × sub-score).
- Cash flow +21.7/30.0
- ARV discount +7.5/15.0
- 1% rule +7.4/10.0
- DSCR +6.9/10.0
- Livability +4.2/5.0
- Rent growth +4.1/5.0
- Schools +3.9/10.0
- Condition / age +2.5/5.0
- Appreciation +0.0/10.0
$185,000
🖨 Deal sheet 📄 Offer letter ✓ Due diligence
Listing remarks MLS
Looking for that perfect low maintenance, income generating property? Merely a few steps from the best that Clemson has to offer, this unit is perfect for all different types of living situations from diverse walks of life. If you're looking to call this unit home, there is plenty of space for you and a family. Currently leased, please allow 24 hour notice for showings!
Key facts
- Investment property
- Unbeatable location
- Durable lvp flooring
Tags
Property features AI
Finance
- Other: Located in the University Ridge community
- HOA & community: Property is part of an HOA; HOA covers exterior maintenance, insurance, lawn maintenance, pest control and trash service
Exterior
- Parking: Paved driveway; See parking features for garage type
- Utilities: Public water; Public sewer; Public garbage pickup; Electric water heater; Electric power for heating
- Home design: Single-story residence; Built in 1992; Crawl space foundation; Vinyl siding exterior; Composition shingle roof
- Construction: Vinyl siding construction; Composition shingle roof; Crawl space foundation; Built circa 1992
- Exterior features: Patio; Corner lot with level terrain; Sidewalk; Some trees
Interior
- Kitchen: 8 x 8 kitchen; Dishwasher; Garbage disposal; Electric cooktop; Electric oven; Built-in microwave
- Bedrooms: 4 bedrooms on the main level; Primary bedroom on main level; Bedroom sizes approximately 9 x 12 (three secondary bedrooms) and primary 9 x 12
- Flooring: Luxury vinyl tile/plank
- Bathrooms: 2 full bathrooms (both on the main level)
- Heating & cooling: Electric forced air heating; Central forced cooling; Electric water heater
- Interior features: Cable available; Smooth ceilings; Solid surface countertops; Smoke detector
- Laundry & utility: First-floor laundry; Walk-in laundry
Neighborhood map
What this means for you Summary
Snapshot
- This is a 4-bed/2.0-bath condo listed at $185k.
Deal economics
- At list price, monthly cash flow is $284 ($3k/yr) — positive.
- The deal already cash-flows at list — no discount required.
- Meets the 1% rule at list price ($2k rent vs $185k).
- Cap rate 8.1% vs local median 2.4% in Clemson — top-decile yield for the area; either an underpriced asset or a hidden risk that comps aren't pricing in. Stress-test before assuming the spread holds.
Location & tenants
- Location reads 83/100 on livability (#3 in SC, #1,044 nationally) — a professional / high-income tenant draw. Strengths: commute A+, health & safety A+, crime B.
- Pickens 01 (rural): math 42% / reading 50% proficiency, ranked #21 of 80 in SC (top 26%) — families likely to look elsewhere, expect single-tenant / working-renter base with shorter leases.
- Zoned schools: Clemson Elementary (math 76% / reading 75%, grade A, #14 of 597 statewide, top 2%, 794 students, 40% FRL) — zoned schools at 40% FRL track the district average.
- Zoned-school proficiency averages 76% at this address vs 46% district-wide (+30 pts) — the actual schools serving this property are materially stronger than the Pickens 01 average implies; a family-tenant draw the district grade alone would hide.
- Market conditions: Rents rising fast (+6.3%/yr); 109 active listings in the ZIP; 5 comparable units currently listed for rent nearby; rentals leasing fast (median 3d on market — plan ~1-2 weeks tenant-placement turnaround); 1,440 units permitted in Pickens County in 2024 (245 in 5+ unit buildings).
- At $2,299/mo this rent would consume 57% of the median local household income ($49k/yr) (locally 1877% of renters already pay >50% of income on rent) — very limited rent-growth headroom before tenants either downsize or default.
Forward outlook
- Local home prices are declining (-3.0%/yr); year-one equity from $1k of loan paydown is wiped out by about $6k of value loss. Plan a longer hold.
- Pickens County population projected at +6% by 2050 — modest demand growth; plan on rents tracking national, not racing it.
- At projected returns (-3.0% appreciation + 6.3% rent growth), your $52k cash investment doubles in ~9 years — after that, you're playing with house money.
Negotiation context
- Only 1 days on market — expect competitive offers; lowballing is unlikely to land.
- 6 sale attempts since 22y ago with the ask held roughly flat each time — persistent listings suggest the price (not the market) is what's stuck; bring a comps-based counter.
Risks & watch-outs
- Climate carrying-cost: extreme-heat days projected 7→18/yr by 2055 (HVAC capex compounding) — expect insurance premiums to compound above CPI over the hold.
Questions for the listing agent
- What does the HOA fee cover, when was the last increase, and are there any pending special assessments or reserve-fund shortfalls?
- Any open or pending special assessments — roof, HVAC, plumbing, elevator, façade? What's the per-unit balance and payoff schedule, and is the seller paying it off at close or rolling it to the buyer?
- Is there a deadline driving the sale (1031 exchange, divorce, estate, relocation)? That informs how much negotiation room exists.
- Schools are A-rated — typically a magnet for longer-tenancy family renters. What's the average tenant stay here, and is there a school-zone premium baked into asking?
- What's the average days-on-market for RENTAL listings here right now (not sales)? A rising rental-DOM trend means longer vacancies and softer asking-rent achievability than the comps imply.
- What's the recent tenant-quality profile in this submarket — average credit score on applications, eviction rate, late-payment / NSF rate, and stable-employment percentage? A property-management company in the area should have these aggregated.
- How much new apartment / multifamily construction is in the pipeline within 1–3 miles? Heavy new supply (>2% of stock underway) typically softens rents 12–24 months out; light construction supports rent growth.
Investment metrics
- 1% rule
- 1.24% ✓
- Cap rate
- 8.13%
- Cash-on-cash
- 6.57%
- DSCR
- 1.29
- GRM
- 6.7
CMA / ARV
No comps found within radius.
Projected returns pro-forma
-3.0% appreciation · 6.26% rent growth · sell at horizon
- IRR
- -1.9%
- Equity multiple
- 0.92×
- Total profit
- $-3,930
- Equity at exit
- $27,584
- IRR
- 11.5%
- Equity multiple
- 2.06×
- Total profit
- $54,794
- Equity at exit
- $15,995
Cash invested: $51,800 (down + closing). Projections, not guarantees.
Landlord ↔ Tenant lean methodology
- Overall (STATE)
- 90 Strongly Landlord-Friendly
- State South Carolina
- 90 Strongly Landlord-Friendly · R+6
- County
- — inherits STATE
- City
- — inherits STATE
ZIP-level market 29631
- Home prices YoY
- -19.6%
- Rents YoY
- 6.3%
- Active inventory
- 109
- Price-to-rent
- 6.7×
Monthly cashflow live
- Estimated rent
- $2,299 medium interval (Pro) →
- Mortgage (P&I)
- −$970
- Tax from tax record
- −$255 /mo · $3,066/yr
- Insurance
- −$77
- HOA
- −$230
- Vacancy / Maint / Mgmt
- −$483
- Net cashflow
- $284
Break-even live
UW: 25.0% down · 7.5% · 30yr · 1.5% tax · 5.0% vac · 8.0% maint · 8.0% mgmt
Financing live
Cash to close
- Down payment
- $46,250
- Closing costs
- $5,550
- Reserves months
- —
- Total cash needed
- —
Loan-product check · same deal, 3 products live
Conventional
25% down · 7.5% · 30yr
- Down + closing
- —
- Monthly P&I
- —
- Monthly cashflow
- —
- DSCR
- —
- Eligible?
- —
Personal DTI + credit; lowest rate.
DSCR
20% down · 8.5% · 30yr
- Down + closing
- —
- Monthly P&I
- —
- Monthly cashflow
- —
- DSCR
- —
- Eligible?
- —
No personal income docs; deal must DSCR.
Hard money
10% down · 12.0% · 12mo
- Down + closing
- —
- Monthly P&I
- —
- Monthly cashflow
- —
- DSCR
- —
- Eligible?
- —
Short-term bridge; refi at stabilization.
Rent comps 5 comps
| Address | Beds | Baths | Sqft | Rent | $/sqft | DOM | Units | Dist |
|---|---|---|---|---|---|---|---|---|
| 818 College Ave Clemson, SC | 4.0 | 4.0 | 1418 | $520 | $0.37 | 2d | 1 | 0.28mi |
| 133 Clemson St Clemson, SC | 3.0 | 1.5 | 1200 | $1,900 | $1.58 | 19d | 1 | 0.33mi |
| 423 Lindsay Rd Clemson, SC | 2.0–3.0 | 1.0–2.0 | 972 | $749 | $0.77 | 2d | 12 | 0.55mi |
| 201 Oak St Clemson, SC | 3.0 | 3.0 | 1088 | $3,600 | $3.31 | 2d | 7 | 0.83mi |
| 101 West Ln Apt 1014 Clemson, SC | 4.0 | 4.0 | 1500 | $2,400 | $1.60 | 23d | 1 | 1.11mi |
HOA detail condo
- Monthly dues
- $230 · $2,760/yr
- Assessments
- None detected in remarks — confirm with the listing agent.
Listing history 2 events
-
2026-06-18remarks 695-char remark
-
2026-06-18$185,000 Active 1 DOM
ⓘ Source: listings_history table (triggers on properties + properties_extension) + one-shot
backfill from property_details.listing_events for pre-trigger history.
Tax reassessment forecast SC · Resets to sale price
- Current annual tax
- $3,066 · $255/mo
- Projected year-2 tax
- $3,066 · $255/mo
- Expected delta
- $0/yr ($0/mo · 0.0%)
ⓘ Screening estimate from a state-policy table — verify with the county assessor before closing.
Climate risk First Street
- Flood 1/10 Low FEMA zone X (unshaded) · 0% chance over 30 yrs
- Wildfire 3/10 Moderate
- Heat 6/10 Major 7 d/yr ≥106°F today · 18 d/yr by 30 yrs out
- Wind 2/10 Low 100% chance of damaging wind over 30 yrs
- Air quality 4/10 Moderate 3 unhealthy d/yr today · 5 by 30 yrs out
Nearby sold comps map
Loading sold comps map…
Walkable amenities ~0.75 mi
Loading nearby amenities…
Taxation est. · year 1
- Rental income
- $27,591
- − Mortgage interest
- −$10,363
- − Property taxes
- −$3,066
- − Insurance
- −$925
- − Repairs & maintenance
- −$2,207
- − Management
- −$2,207
- − HOA
- −$2,760
- − Depreciation
- −$5,382
- Taxable income
- $681
- Est. tax owed @ 24.0%
- −$163
- After-tax cash flow
- $3,241/yr
For passive investors: Depreciation is non-cash, so a rental often shows a tax loss while cash-flowing — sheltering income. Rental losses are passive: they offset passive income freely, and up to $25,000/yr can offset ordinary (W-2) income if you actively participate and your MAGI is under $100k (phasing out to $0 by $150k); unused losses carry forward. On sale, claimed depreciation is recaptured at up to 25%, and gains may owe capital-gains tax (a 1031 exchange can defer both). Figures are a year-1 estimate at your 24.0% rate — not tax advice; consult a CPA.
Schools (NCES district)
- District
- Pickens 01
- NCES district ID
- 4503330
- Math proficiency
- 42% ▼ -11.00%
- Reading proficiency
- 50% ▼ -2.00%
- Median HH income
- $42,534
- Composite
- 38.73/100
- National rank
- #4130
- State rank
- #21 of 80 in SC
Livability — Clemson
- Score
- 83/100
- State rank
- #3
- US rank
- #1044
Category grades
Schools grade is shown separately in the Schools card above.
Census & demographics
- Census place
- Clemson, SC
- County
- Pickens County · 102,825 people
- City population
- 16,849
- Metro
- Greenville-Anderson, SC
- Population (ZIP)
- 16,849
- Household income
- $48,800
- Rent vs Own
- Severe rent burden
- 1877.0
Population outlook (Pickens County) Hauer SSP2
- Today (2025)
- 126,530 people
- By 2030
- 128,780 · +1.8%
- By 2040
- 132,151 · +4.4%
- By 2050
- 133,800 · +5.7%
- By 2075
- 137,594 · +8.7%
- By 2100
- 139,784 · +10.5%
Race, ethnicity, and origin ACS 2023
- Neighborhood character
- Predominantly White (77%)
- Race & ethnicity
- White 77% Black 7% Two or more races 7% Asian 5% Hispanic / Latino 4%
- Common ancestry
- Slovak 4% Serbian 3% Lithuanian 2%
- Foreign-born
- 7% · China, Canada
- Languages at home
- 90% English-only · Other Indo-European 3% Spanish 2% Chinese 1%
Political lean MEDSL · Pickens
- 2024 margin
- Solid R (+52.7) · D 23.0% · R 75.6% · Other 1.4%
- 2008→2024 swing
- -6.4pp toward R · 2008: -46.2pp · 2024: -52.7pp
- All cycles
- 2024: R+52.7 2020: R+50.9 2016: R+52.7 2012: R+49.0 2008: R+46.2
Not yet ingested
- Civics
- —
Market trends
- HPI YoY
- ▼ -70.39%
- Current HPI
- 288.7023
- Rent YoY
- ▲ 6.26%
- Metro
- Greenville-Anderson, SC
- State GDP YoY
- ▲ 4.51%
- F500 in state
- 2
Industry mix (Fortune 500 HQ in SC)
| Industry | F500 HQs | Revenue |
|---|---|---|
| Packaging | 1 | $7B |
|
||
Price history
+157.1% since first listed25 events — show timeline
- 2026-06-18 Listed $185,000 Greater Greenville MLS
- 2023-01-17 Listing Removed — WUMLS
- 2023-01-17 Sold (Public Records) $185,000 Public Records
- 2023-01-17 Sold (MLS) $185,000 WUMLS
- 2022-11-25 Contingent — WUMLS
- 2022-11-09 Listed $195,000 WUMLS
- 2020-07-14 Sold (Public Records) $105,000 Public Records
- 2020-07-13 Sold (MLS) $105,000 WUMLS
- 2020-05-27 Pending — WUMLS
- 2020-05-27 Listed $114,000 WUMLS
- 2015-07-17 Sold (Public Records) $74,750 Public Records
- 2015-07-13 Sold (MLS) $74,750 WUMLS
- 2015-06-13 Pending — WUMLS
- 2015-06-09 Listed $79,000 WUMLS
- 2012-06-21 Sold (Public Records) $57,000 Public Records
- 2012-05-31 Sold (MLS) $57,000 Greater Greenville MLS
- 2012-04-12 Listing Removed — Greater Greenville MLS
- 2011-09-08 Listed $67,500 Greater Greenville MLS
- 2007-05-30 Sold (Public Records) $62,000 Public Records
- 2004-04-19 Sold (Public Records) $70,000 Public Records
- 2004-04-19 Sold (MLS) $70,000 WUMLS
- 2004-03-05 Listed $70,500 WUMLS
- 2004-03-05 Listing Removed — WUMLS
- 2000-03-24 Sold (Public Records) $65,500 Public Records
- 1993-08-02 Sold (Public Records) $71,950 Public Records
Property tax history
+57.7%/yrLatest (2025): $3,066 · -4.8% YoY. Source: county tax records.
Cash-flow waterfall
monthlySold comps — $/sqft
last 12 mo · ≤1 miLoading sold comps…