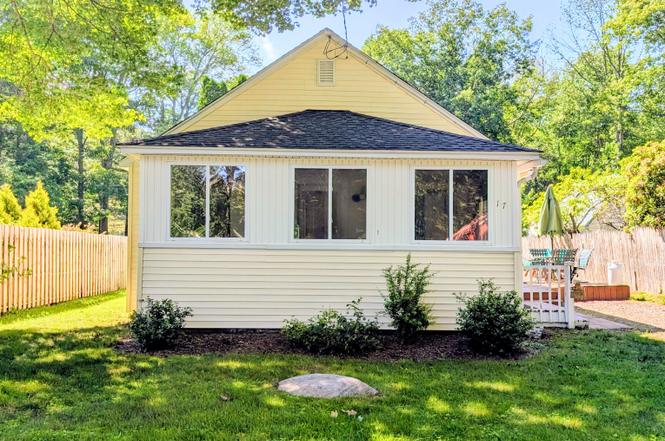
17 Autumn Trl · Coventry Lake, CT
Flood risk 1/10 · Minimal
- FEMA flood zone
- X
- Chance of flooding over 30 yrs
- 0.0%
- Est. flood insurance / yr
- $507 – $1,088
Fire risk 2/10 · Minimal
- Est. fire insurance / yr
- $829 – $1,539
Heat risk 3/10 · Minor
- Hot days now (above 93°F)
- 7 days/yr
- Hot days in 30 yrs
- 16 days/yr
Wind risk 6/10 · Moderate
- Chance of severe wind over 30 yrs
- 27.0%
Air-quality risk 3/10 · Minor
- Unhealthy air days now
- 3 days/yr
- Unhealthy air days in 30 yrs
- 4 days/yr
Risk factors via First Street. Map © Google.
Why this score? — see what drove the B+ grade
The composite is a weighted blend of 9 inputs, each scored 0–100. Each bar is that input's sub-score; the figure is the points it added to the 100-point composite (weight × sub-score).
- Cash flow +28.8/30.0
- ARV discount +15.0/15.0
- DSCR +10.0/10.0
- 1% rule +8.1/10.0
- Schools +5.8/10.0
- Livability +3.6/5.0
- Rent growth +2.5/5.0
- Condition / age +2.5/5.0
- Appreciation +0.0/10.0
$160,000
🖨 Deal sheet (PDF) 📄 Offer letter ✓ Due diligence
Listing remarks MLS
Everything old is new again!! New vinyl siding, much new insulation, new electrical, newer roof..And more!!! Private well. Oak grove lake association $142 yr.Avail. Immediately call nita 429 5938 for more
Key facts
- Sandy beach
- Firepit
- Good sized side deck
Tags
Property features AI
Finance
- Other: Property is within Connecticut, Tolland County; nearby amenities include basketball court, golf course, health club, lake, library, medical facilities, park, and stables/riding
- HOA & community: Homeowners association with annual fee of $125; Association includes lake/beach access and beach rights; association membership required
Exterior
- Parking: Parking for 6 vehicles
- Utilities: Private well water; Septic system; Above-ground fuel tank
- Home design: Single-family home; Yellow exterior
- Construction: Frame construction; Vinyl siding; Asphalt shingle roof; Block and concrete foundation
- Exterior features: Deck; Lightly wooded, level lot; Private driveway (unpaved)
Interior
- Kitchen: Oven/Range; Refrigerator
- Bedrooms: 2 bedrooms
- Bathrooms: 1 full bathroom
- Heating & cooling: Hot water heating; Oil-fired heat; Oil hot water domestic hot water
- Interior features: 4 total rooms; Sitting room; Crawl space basement; Attic with pull-down stairs
- Laundry & utility: Washer and dryer; Laundry located on the front porch (main level)
Neighborhood map
What this means for you Summary
Snapshot
- This is a 2-bed/1.0-bath single-family listed at $160k.
Deal economics
- At list price, monthly cash flow is $538 ($6k/yr) — positive.
- The deal already cash-flows at list — no discount required.
- Meets the 1% rule at list price ($2k rent vs $160k).
- Cap rate 10.3% vs local median 3.4% in Coventry Lake — top-decile yield for the area; either an underpriced asset or a hidden risk that comps aren't pricing in. Stress-test before assuming the spread holds.
Location & tenants
- Location reads 71/100 on livability (#92 in CT) — a middle-class / working-renter tenant base. Strengths: crime A+, housing A+, health & safety A+; Watch: amenities F, commute F.
- Coventry School District (rural): math 57% / reading 71% proficiency, ranked #30 of 153 in CT (top 20%) — acceptable for families but not a draw, mixed tenant base, ~2y average lease; only 16% free/reduced lunch — higher-income household profile.
- Zoned schools: Coventry Grammar School (375 students, 24% FRL); Capt. Nathan Hale School (math 56% / reading 74%, grade A-, #29 of 175 statewide, top 17%, 389 students, 25% FRL); Coventry Academy (18 students, 0% FRL) — zoned schools at 16% FRL track the district average.
- Market conditions: 60 active listings in the ZIP; 3 comparable units currently listed for rent nearby; rentals leasing fast (median 3d on market — plan ~1-2 weeks tenant-placement turnaround); 1,867 units permitted in Capitol Planning Region in 2024 (1,399 in 5+ unit buildings).
Forward outlook
- Local home prices are declining (-3.0%/yr); year-one equity from $1k of loan paydown is wiped out by about $5k of value loss. Plan a longer hold.
- At projected returns (-3.0% appreciation + 3.0% rent growth), your $45k cash investment doubles in ~9 years — after that, you're playing with house money.
Negotiation context
- Only 6 days on market — expect competitive offers; lowballing is unlikely to land.
- 2 sale attempts since 26y ago with the ask held roughly flat each time — persistent listings suggest the price (not the market) is what's stuck; bring a comps-based counter.
- Current owner paid $126k; 27% above their basis — modest negotiation headroom, anchor on the comps not their cost.
Risks & watch-outs
- Watch-outs: built in 1940 — expect roof / HVAC / electrical / plumbing capex.
- Climate carrying-cost: major wind risk, 27% chance of damaging wind over 30y — expect insurance premiums to compound above CPI over the hold.
Questions for the listing agent
- Built in 1940 — when were the roof, HVAC, electrical panel, plumbing, and water heater last replaced?
- What does the HOA fee cover, when was the last increase, and are there any pending special assessments or reserve-fund shortfalls?
- Is there a deadline driving the sale (1031 exchange, divorce, estate, relocation)? That informs how much negotiation room exists.
- What's the average days-on-market for RENTAL listings here right now (not sales)? A rising rental-DOM trend means longer vacancies and softer asking-rent achievability than the comps imply.
- What's the recent tenant-quality profile in this submarket — average credit score on applications, eviction rate, late-payment / NSF rate, and stable-employment percentage? A property-management company in the area should have these aggregated.
- How much new for-sale + rental construction is in the pipeline within 1–3 miles? Heavy new supply typically softens prices + rents 12–24 months out; constrained supply supports both.
Investment metrics
- 1% rule
- 1.31% ✓
- Cap rate
- 10.33%
- Cash-on-cash
- 14.41%
- DSCR
- 1.64
- GRM
- 6.4
CMA / ARV
- ARV (on-the-fly)
- $258,075
- Comps found
- 11
Show comp detail 11 sales within ~0.75 mi
| Address | Dist | Beds/Ba | Sqft | Sold | Price | $/sf | Match |
|---|---|---|---|---|---|---|---|
| 10 Sunset Trl | 0.07mi | 2/1.0 | 828 (+7%) | 11mo | $307,000 | $371 | 76 |
| 30 Knollwood Dr | 0.04mi | 2/1.0 | 880 (+14%) | 4mo | $125,000 | $142 | 72 |
| 2567 Main St | 0.33mi | 2/1.0 | 808 (+4%) | 9mo | $292,000 | $361 | 70 |
| 2517 Main St | 0.31mi | 2/1.0 | 720 (-7%) | 11mo | $152,000 | $211 | 65 |
| 48 Lakeview Dr | 0.62mi | 2/1.0 | 794 (+2%) | 5mo | $300,000 | $378 | 63 |
| 2392 Main St | 0.37mi | 1/1.0 (-1) | 684 (-12%) | 1mo | $210,000 | $307 | 58 |
| 63 Fox Trl | 0.73mi | 2/1.0 | 780 (+1%) | 9mo | $260,000 | $333 | 58 |
| 68 Old Oak Trl | 0.49mi | 2/1.0 | 852 (+10%) | 9mo | $241,000 | $283 | 53 |
| 71 Standish Rd | 0.32mi | 1/1.0 (-1) | 684 (-12%) | 17mo | $510,000 | $746 | 46 |
| 21 Lakeview Dr | 0.62mi | 2/1.0 | 858 (+11%) | 23mo | $251,000 | $293 | 34 |
| 66 Squirrel Trl | 0.73mi | 1/1.0 (-1) | 676 (-13%) | 20mo | $235,000 | $348 | 23 |
Match score weights: distance 35% · size 25% · config 20% · recency 20%. Top-matched comps best support the ARV.
Projected returns pro-forma
-3.0% appreciation · 3.0% rent growth · sell at horizon
- IRR
- 4.8%
- Equity multiple
- 1.19×
- Total profit
- $8,369
- Equity at exit
- $23,857
- IRR
- 14.3%
- Equity multiple
- 2.15×
- Total profit
- $51,549
- Equity at exit
- $13,834
Cash invested: $44,800 (down + closing). Projections, not guarantees.
Landlord ↔ Tenant lean methodology
- Overall (STATE)
- 27 Tenant-Leaning
- State Connecticut
- 27 Tenant-Leaning · D+7
- County
- — inherits STATE
- City
- — inherits STATE
ZIP-level market 06238
- Home prices YoY
- -31.6%
- Active inventory
- 60
- Price-to-rent
- 6.4×
Monthly cashflow live
- Estimated rent
- $2,089 medium interval (Pro) →
- Mortgage (P&I)
- −$839
- Tax from tax record
- −$197 /mo · $2,361/yr
- Insurance
- −$67
- HOA
- −$10
- Vacancy / Maint / Mgmt
- −$439
- Net cashflow
- $538
Break-even live
Sensitivity live
| Price | -10% $628 | -5% $583 | +0% $538 | +5% $493 | +10% $447 |
|---|---|---|---|---|---|
| Rent | -10% $373 | -5% $455 | +0% $538 | +5% $620 | +10% $703 |
| Rate | -1.0pp $618 | -0.5pp $579 | base $538 | +0.5pp $496 | +1.0pp $454 |
UW: 25.0% down · 7.5% · 30yr · 1.5% tax · 5.0% vac · 8.0% maint · 8.0% mgmt
Financing live
Cash to close
- Down payment
- $40,000
- Closing costs
- $4,800
- Reserves months
- —
- Total cash needed
- —
Loan-product check · same deal, 3 products live
Conventional
25% down · 7.5% · 30yr
- Down + closing
- —
- Monthly P&I
- —
- Monthly cashflow
- —
- DSCR
- —
- Eligible?
- —
Personal DTI + credit; lowest rate.
DSCR
20% down · 8.5% · 30yr
- Down + closing
- —
- Monthly P&I
- —
- Monthly cashflow
- —
- DSCR
- —
- Eligible?
- —
No personal income docs; deal must DSCR.
Hard money
10% down · 12.0% · 12mo
- Down + closing
- —
- Monthly P&I
- —
- Monthly cashflow
- —
- DSCR
- —
- Eligible?
- —
Short-term bridge; refi at stabilization.
Rent comps 3 comps
| Address | Beds | Baths | Sqft | Rent | $/sqft | DOM | Units | Dist |
|---|---|---|---|---|---|---|---|---|
| 173 Daly Rd Coventry, CT | 2.0 | 1.0 | 988 | $1,950 | $1.97 | 3d | 1 | 0.14mi |
| 146 Beebe Farms Rd Coventry, CT | 2.0 | 1.0 | 916 | $2,100 | $2.29 | 3d | 1 | 0.85mi |
| 157 S River Rd Coventry, CT | 2.0 | 1.0 | 1080 | $3,200 | $2.96 | 3d | 1 | 1.01mi |
HOA detail
- Monthly dues
- $10 · $120/yr
- Likely covers
- electric
Listing history 4 events
-
2026-06-16statusdays on market $160,000 Under Contract 6 DOM
-
2026-06-15days on market $160,000 Active 5 DOM
-
2026-06-13remarks 699-char remark
-
2026-06-13$160,000 Active 3 DOM
ⓘ Source: listings_history table (triggers on properties + properties_extension) + one-shot
backfill from property_details.listing_events for pre-trigger history.
Tax reassessment forecast CT · Partial reset (capped growth)
- Current annual tax
- $2,361 · $197/mo
- Projected year-2 tax
- $2,892 · $241/mo
- Expected delta
- +$532/yr (+$44/mo · 22.5%)
ⓘ Screening estimate from a state-policy table — verify with the county assessor before closing.
Climate risk First Street
- Flood 1/10 Low FEMA zone X · 0% chance over 30 yrs
- Wildfire 2/10 Low
- Heat 3/10 Moderate 7 d/yr ≥93°F today · 16 d/yr by 30 yrs out
- Wind 6/10 Major 27% chance of damaging wind over 30 yrs
- Air quality 3/10 Moderate 3 unhealthy d/yr today · 4 by 30 yrs out
Nearby sold comps map
Loading sold comps map…
Walkable amenities ~0.75 mi
Loading nearby amenities…
Taxation est. · year 1
- Rental income
- $25,069
- − Mortgage interest
- −$8,962
- − Property taxes
- −$2,361
- − Insurance
- −$800
- − Repairs & maintenance
- −$2,006
- − Management
- −$2,006
- − HOA
- −$120
- − Depreciation
- −$4,655
- Taxable income
- $4,160
- Est. tax owed @ 24.0%
- −$998
- After-tax cash flow
- $5,457/yr
For passive investors: Depreciation is non-cash, so a rental often shows a tax loss while cash-flowing — sheltering income. Rental losses are passive: they offset passive income freely, and up to $25,000/yr can offset ordinary (W-2) income if you actively participate and your MAGI is under $100k (phasing out to $0 by $150k); unused losses carry forward. On sale, claimed depreciation is recaptured at up to 25%, and gains may owe capital-gains tax (a 1031 exchange can defer both). Figures are a year-1 estimate at your 24.0% rate — not tax advice; consult a CPA.
Schools (NCES district)
- District
- Coventry School District
- NCES district ID
- 0900960
- Math proficiency
- 57% ▼ -11.00%
- Reading proficiency
- 71% ▼ -6.00%
- Median HH income
- $88,074
- Composite
- 57.98/100
- National rank
- #1037
- State rank
- #30 of 153 in CT
Livability — Coventry Lake
- Score
- 71/100
- State rank
- #92
- US rank
- #7117
Category grades
Schools grade is shown separately in the Schools card above.
Census & demographics
- Census place
- Coventry Lake, CT
- City population
- 12,267
- Population (ZIP)
- 12,267
Population outlook (Capitol County) Hauer SSP2
- By 2040
- 1,063,519
Race, ethnicity, and origin ACS 2023
- Neighborhood character
- Predominantly White (92%)
- Race & ethnicity
- White 92% Hispanic / Latino 5% Two or more races 4% Asian 2%
- Common ancestry
- Romanian 9% Lithuanian 7% Slovak 2%
- Foreign-born
- 6% · Canada, China
- Languages at home
- 93% English-only · Spanish 3% French/Haitian/Cajun 1% Russian/Polish/Slavic 1%
Political lean MEDSL · Capitol
- 2024 margin
- Strong D (+21.9) · D 60.1% · R 38.2% · Other 1.7%
- All cycles
- 2024: D+21.9
Not yet ingested
- Civics
- —
Market trends
- HPI YoY
- ▼ -119.22%
- Current HPI
- 258.0578
- Rent YoY
- —
- Metro
- —
- State GDP YoY
- ▲ 1.06%
- F500 in state
- 38
Industry mix (Fortune 500 HQ in CT)
| Industry | F500 HQs | Revenue |
|---|---|---|
| Industrial Machinery | 4 | $38B |
|
||
| Insurance | 3 | $71B |
|
||
| Financial Services | 2 | $25B |
|
||
| Transportation / Logistics | 2 | $18B |
|
||
| Healthcare | 1 | $247B |
|
||
| Telecommunications | 1 | $55B |
|
||
Price history
+93.0% since first listed5 events — show timeline
- 2026-06-09 Listed $160,000 Smart MLS
- 2002-11-27 Sold (Public Records) $126,000 Public Records
- 2000-10-16 Sold (MLS) $82,000 Smart MLS
- 2000-10-12 Sold (Public Records) $82,000 Public Records
- 2000-07-27 Listed $82,900 Smart MLS
Property tax history
-0.6%/yrLatest (2023): $2,361 · +1.9% YoY. Source: county tax records.
Cash-flow waterfall
monthlySold comps — $/sqft
last 12 mo · ≤1 miLoading sold comps…