212 Water Ridge Dr · West Livingston, TX
Flood risk 1/10 · Minimal
- FEMA flood zone
- X (unshaded)
- Chance of flooding over 30 yrs
- 0.0%
- Est. flood insurance / yr
- $507 – $1,088
Fire risk 3/10 · Minor
- Est. fire insurance / yr
- $1,222 – $2,270
Heat risk 8/10 · Major
- Hot days now (above 112°F)
- 7 days/yr
- Hot days in 30 yrs
- 25 days/yr
Wind risk 8/10 · Major
- Chance of severe wind over 30 yrs
- 99.0%
Air-quality risk 1/10 · Minimal
- Unhealthy air days now
- 0 days/yr
- Unhealthy air days in 30 yrs
- 0 days/yr
Risk factors via First Street. Map © Google.
Why this score? — see what drove the D grade
The composite is a weighted blend of 9 inputs, each scored 0–100. Each bar is that input's sub-score; the figure is the points it added to the 100-point composite (weight × sub-score).
- Cash flow +15.7/30.0
- ARV discount +7.5/15.0
- DSCR +4.8/10.0
- 1% rule +4.3/10.0
- Schools +3.2/10.0
- Rent growth +2.5/5.0
- Livability +2.5/5.0
- Condition / age +2.5/5.0
- Appreciation +0.0/10.0
$163,000
🖨 Deal sheet 📄 Offer letter ✓ Due diligence
Listing remarks MLS
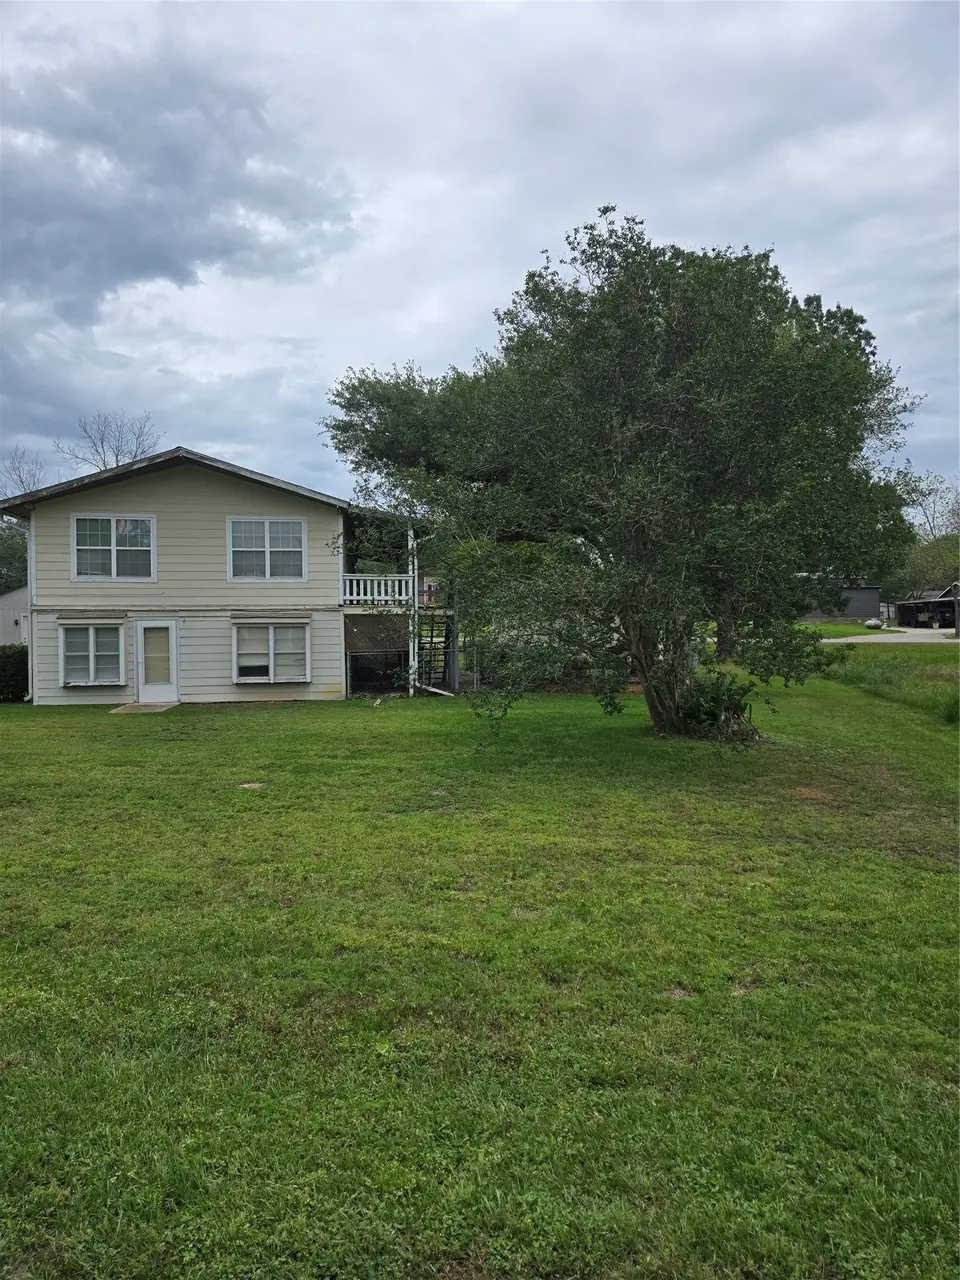
This older home presents a great opportunity for buyers looking to invest in a property with potential. In need of repairs and updates, it's perfect for those ready to roll up their sleeves and make it their own. The home offers a limited view of the nearby lake, adding a touch of natural beauty, while still maintaining an affordable entry point. Residents can also enjoy convenient access to local lake amenities, including boating, fishing, and outdoor recreation in the neighborhood. With some vision and effort, this property could become a comfortable retreat or a smart investment. Hot water heater was purchased 03/10/2026 and new roof was installed in 2018.
Key facts
- Outdoor recreation
- 0.25 acre lot
- Garage
Tags
Neighborhood map
What this means for you Summary
Snapshot
- This is a 3-bed/1.5-bath single-family listed at $163k.
Deal economics
- At list price, monthly cash flow is $71 ($848/yr) — positive.
- The deal already cash-flows at list — no discount required.
- To meet the 1% rule (rent ≥ 1% of price), the offer needs to be $152k (6.7% below list).
- Recommended offer: $152k (6.7% below list) — sets the bar for 1% rule.
- Cap rate 6.8% vs local median 2.5% in West Livingston — top-decile yield for the area; either an underpriced asset or a hidden risk that comps aren't pricing in. Stress-test before assuming the spread holds.
Location & tenants
- Location reads 50/100 on livability (#1,501 in TX) — a working-class tenant base; expect higher turnover. Strengths: cost of living A+, housing A+; Watch: schools F, crime F, amenities F.
- Livingston ISD (rural): math 38% / reading 39% proficiency, ranked #459 of 826 in TX (top 56%) — families likely to look elsewhere, expect single-tenant / working-renter base with shorter leases.
- Market conditions: 1186 active listings in the ZIP; 769 units permitted in Polk County in 2024 (0 in 5+ unit buildings).
Forward outlook
- Local home prices are declining (-3.0%/yr); year-one equity from $1k of loan paydown is wiped out by about $5k of value loss. Plan a longer hold.
- Polk County population projected at +16% by 2050 — long-run rental-demand tailwind backs the buy-and-hold thesis.
Negotiation context
- It's been on market 75 days — a 6% lower offer ($153k) is reasonable based on typical stale-listing flexibility.
Risks & watch-outs
- Climate carrying-cost: severe wind risk, 99% chance of damaging wind over 30y; extreme-heat days projected 7→25/yr by 2055 (HVAC capex compounding) — expect insurance premiums to compound above CPI over the hold.
Questions for the listing agent
- It's been on market 75 days. Have you received any prior offers? Is the seller open to a 7% concession, seller financing, or rate buy-down credit?
- Built in 1975 — when were the roof, HVAC, electrical panel, plumbing, and water heater last replaced?
- Why hasn't it sold? Are there any deal-killer items the seller is aware of (foundation, flood, title, zoning, code violations)?
- Is there a deadline driving the sale (1031 exchange, divorce, estate, relocation)? That informs how much negotiation room exists.
- Schools are F-rated, which usually means shorter tenancies and higher turnover. Who's the typical renter profile here, and what's been the actual vacancy rate?
- Crime grade is F in this area — have there been break-ins, vandalism, or insurance claims at this property in the last 3 years? What carrier currently insures it and at what premium?
- The area grade is low — what's the realistic commute time and amenity access for the typical tenant pool here? Any planned neighborhood developments (good or bad) we should know about?
- What's the average days-on-market for RENTAL listings here right now (not sales)? A rising rental-DOM trend means longer vacancies and softer asking-rent achievability than the comps imply.
- What's the recent tenant-quality profile in this submarket — average credit score on applications, eviction rate, late-payment / NSF rate, and stable-employment percentage? A property-management company in the area should have these aggregated.
- How much new for-sale + rental construction is in the pipeline within 1–3 miles? Heavy new supply typically softens prices + rents 12–24 months out; constrained supply supports both.
Investment metrics
- 1% rule
- 0.93% ✗
- Cap rate
- 6.81%
- Cash-on-cash
- 1.86%
- DSCR
- 1.08
- GRM
- 8.9
CMA / ARV
- ARV (median comp)
- $360,838
- List price
- $163,000
- Delta
- -54.83%
- Verdict
- UNDERPRICED
- Comps
- 20 within 1.0 mi
Show comp detail 8 sales within ~0.75 mi
| Address | Dist | Beds/Ba | Sqft | Sold | Price | $/sf | Match |
|---|---|---|---|---|---|---|---|
| 173 Lazy Water Dr | 0.05mi | 3/3.0 | 1,654 (-14%) | 4mo | $189,000 | $114 | 65 |
| 1555 Fm 3277 | 0.29mi | 4/2.0 (+1) | 1,920 (0%) | 17mo | $374,900 | $195 | 65 |
| 150 Miller Rd | 0.20mi | 2/2.0 (-1) | 2,011 (+5%) | 22mo | $249,900 | $124 | 58 |
| 192 Shadow Ln | 0.40mi | 3/2.5 | 2,029 (+6%) | 16mo | $379,600 | $187 | 55 |
| 411 Resort Dr | 0.51mi | 4/2.0 (+1) | 2,072 (+8%) | 4mo | $519,000 | $250 | 53 |
| 255 Pine Brook Dr | 0.28mi | 3/2.0 | 1,650 (-14%) | 13mo | $394,250 | $239 | 51 |
| 155 Laney Dr | 0.51mi | 3/2.5 | 2,010 (+5%) | 23mo | $255,000 | $127 | 45 |
| 276 Resort Dr | 0.64mi | 3/2.0 | 1,757 (-8%) | 24mo | $375,000 | $213 | 34 |
Match score weights: distance 35% · size 25% · config 20% · recency 20%. Top-matched comps best support the ARV.
Projected returns pro-forma
-3.0% appreciation · 3.0% rent growth · sell at horizon
- IRR
- -13.3%
- Equity multiple
- 0.52×
- Total profit
- $-21,887
- Equity at exit
- $24,304
- IRR
- -4.4%
- Equity multiple
- 0.71×
- Total profit
- $-13,160
- Equity at exit
- $14,093
Cash invested: $45,640 (down + closing). Projections, not guarantees.
Landlord ↔ Tenant lean methodology
- Overall (STATE)
- 87 Strongly Landlord-Friendly
- State Texas
- 87 Strongly Landlord-Friendly · R+5
- County
- — inherits STATE
- City
- — inherits STATE
ZIP-level market 77351
- Home prices YoY
- -14.8%
- Active inventory
- 1186
- Price-to-rent
- 8.9×
Monthly cashflow live
- Estimated rent
- $1,521 medium interval (Pro) →
- Mortgage (P&I)
- −$855
- Tax from tax record
- −$208 /mo · $2,496/yr
- Insurance
- −$68
- HOA
- −$0
- Vacancy / Maint / Mgmt
- −$319
- Net cashflow
- $71
Break-even live
UW: 25.0% down · 7.5% · 30yr · 1.5% tax · 5.0% vac · 8.0% maint · 8.0% mgmt
Financing live
Cash to close
- Down payment
- $40,750
- Closing costs
- $4,890
- Reserves months
- —
- Total cash needed
- —
Loan-product check · same deal, 3 products live
Conventional
25% down · 7.5% · 30yr
- Down + closing
- —
- Monthly P&I
- —
- Monthly cashflow
- —
- DSCR
- —
- Eligible?
- —
Personal DTI + credit; lowest rate.
DSCR
20% down · 8.5% · 30yr
- Down + closing
- —
- Monthly P&I
- —
- Monthly cashflow
- —
- DSCR
- —
- Eligible?
- —
No personal income docs; deal must DSCR.
Hard money
10% down · 12.0% · 12mo
- Down + closing
- —
- Monthly P&I
- —
- Monthly cashflow
- —
- DSCR
- —
- Eligible?
- —
Short-term bridge; refi at stabilization.
Listing history 15 events
-
2026-06-18days on market $163,000 Active 75 DOM
-
2026-06-17days on market $163,000 Active 74 DOM
-
2026-06-16days on market $163,000 Active 73 DOM
-
2026-06-15pricedays on market $163,000 Active 72 DOM
-
2026-06-09days on market $170,000 Active 66 DOM
-
2026-06-08days on market $170,000 Active 65 DOM
-
2026-06-07days on market $170,000 Active 64 DOM
-
2026-06-04days on market $170,000 Active 61 DOM
-
2026-06-03days on market $170,000 Active 60 DOM
-
2026-06-02days on market $170,000 Active 59 DOM
-
2026-06-01days on market $170,000 Active 58 DOM
-
2026-05-31days on market $170,000 Active 57 DOM
-
2026-05-08price $170,000 667-char remark
Show marketing remark (667 chars)
This older home presents a great opportunity for buyers looking to invest in a property with potential. In need of repairs and updates, it's perfect for those ready to roll up their sleeves and make it their own. The home offers a limited view of the nearby lake, adding a touch of natural beauty, while still maintaining an affordable entry point. Residents can also enjoy convenient access to local lake amenities, including boating, fishing, and outdoor recreation in the neighborhood. With some vision and effort, this property could become a comfortable retreat or a smart investment. Hot water heater was purchased 03/10/2026 and new roof was installed in 2018.
-
2026-04-04$180,000 Active 667-char remark
Show marketing remark (667 chars)
This older home presents a great opportunity for buyers looking to invest in a property with potential. In need of repairs and updates, it's perfect for those ready to roll up their sleeves and make it their own. The home offers a limited view of the nearby lake, adding a touch of natural beauty, while still maintaining an affordable entry point. Residents can also enjoy convenient access to local lake amenities, including boating, fishing, and outdoor recreation in the neighborhood. With some vision and effort, this property could become a comfortable retreat or a smart investment. Hot water heater was purchased 03/10/2026 and new roof was installed in 2018.
-
1998-03-17soldstatus
ⓘ Source: listings_history table (triggers on properties + properties_extension) + one-shot
backfill from property_details.listing_events for pre-trigger history.
Tax reassessment forecast TX · Resets to sale price
- Current annual tax
- $2,496 · $208/mo
- Projected year-2 tax
- $2,983 · $249/mo
- Expected delta
- +$487/yr (+$41/mo · 19.5%)
ⓘ Screening estimate from a state-policy table — verify with the county assessor before closing.
Climate risk First Street
- Flood 1/10 Low FEMA zone X (unshaded) · 0% chance over 30 yrs
- Wildfire 3/10 Moderate
- Heat 8/10 Severe 7 d/yr ≥112°F today · 25 d/yr by 30 yrs out
- Wind 8/10 Severe 99% chance of damaging wind over 30 yrs
- Air quality 1/10 Low 0 unhealthy d/yr today · 0 by 30 yrs out
Nearby sold comps map
Loading sold comps map…
Walkable amenities ~0.75 mi
Loading nearby amenities…
Taxation est. · year 1
- Rental income
- $18,248
- − Mortgage interest
- −$9,131
- − Property taxes
- −$2,496
- − Insurance
- −$815
- − Repairs & maintenance
- −$1,460
- − Management
- −$1,460
- − Depreciation
- −$4,742
- Taxable loss
- −$1,855
- Est. tax savings @ 24.0%
- +$445
- After-tax cash flow
- $1,293/yr
For passive investors: Depreciation is non-cash, so a rental often shows a tax loss while cash-flowing — sheltering income. Rental losses are passive: they offset passive income freely, and up to $25,000/yr can offset ordinary (W-2) income if you actively participate and your MAGI is under $100k (phasing out to $0 by $150k); unused losses carry forward. On sale, claimed depreciation is recaptured at up to 25%, and gains may owe capital-gains tax (a 1031 exchange can defer both). Figures are a year-1 estimate at your 24.0% rate — not tax advice; consult a CPA.
Schools (NCES district)
- District
- Livingston ISD
- NCES district ID
- 4827780
- Math proficiency
- 38% ▼ -1.00%
- Reading proficiency
- 39% ▲ 3.00%
- Median HH income
- $39,531
- Composite
- 32.25/100
- National rank
- #5767
- State rank
- #459 of 826 in TX
Livability — West Livingston
- Score
- 50/100
- State rank
- #1501
- US rank
- #25668
Category grades
Schools grade is shown separately in the Schools card above.
Census & demographics
- County
- Polk County · 37,143 people
- Metro
- nan
- Population (ZIP)
- 37,143
- Household income
- $66,834
- Rent vs Own
- Severe rent burden
- 608.0
Population outlook (Polk County) Hauer SSP2
- Today (2025)
- 51,049 people
- By 2030
- 53,243 · +4.3%
- By 2040
- 56,528 · +10.7%
- By 2050
- 59,243 · +16.1%
- By 2075
- 63,528 · +24.4%
- By 2100
- 60,376 · +18.3%
Race, ethnicity, and origin ACS 2023
- Neighborhood character
- Predominantly White (72%)
- Race & ethnicity
- White 72% Hispanic / Latino 14% Two or more races 9% Black 8% Native American 2%
- Hispanic origin (detail)
- Mexican 11%
- Common ancestry
- Lithuanian 2% Italian 2% Portuguese 2%
- Foreign-born
- 5% · Canada
- Languages at home
- 88% English-only · Spanish 10%
Political lean MEDSL · Polk
- 2024 margin
- Solid R (+58.9) · D 20.2% · R 79.1%
- 2008→2024 swing
- -21.7pp toward R · 2008: -37.2pp · 2024: -58.9pp
- All cycles
- 2024: R+58.9 2020: R+54.5 2016: R+56.5 2012: R+48.2 2008: R+37.2
Not yet ingested
- Civics
- —
Market trends
- HPI YoY
- ▼ -31.11%
- Current HPI
- 178.5316
- Rent YoY
- —
- Metro
- nan
- State GDP YoY
- ▲ 3.95%
- F500 in state
- 110
Industry mix (Fortune 500 HQ in TX)
| Industry | F500 HQs | Revenue |
|---|---|---|
| Energy | 16 | $1,198B |
|
||
| Technology | 5 | $198B |
|
||
| Engineering / Construction | 4 | $72B |
|
||
| Energy Services | 3 | $60B |
|
||
| Utilities | 3 | $41B |
|
||
| Healthcare | 2 | $330B |
|
||
Price history
-5.6% since first listed3 events — show timeline
- 2026-05-08 Price Changed $170,000 HARMLS
- 2026-04-04 Listed $180,000 HARMLS
- 1998-03-17 Sold (Public Records) — Public Records
Property tax history
+4.6%/yrLatest (2025): $2,496 · +4.7% YoY. Source: county tax records.
Cash-flow waterfall
monthlySold comps — $/sqft
last 12 mo · ≤1 miLoading sold comps…