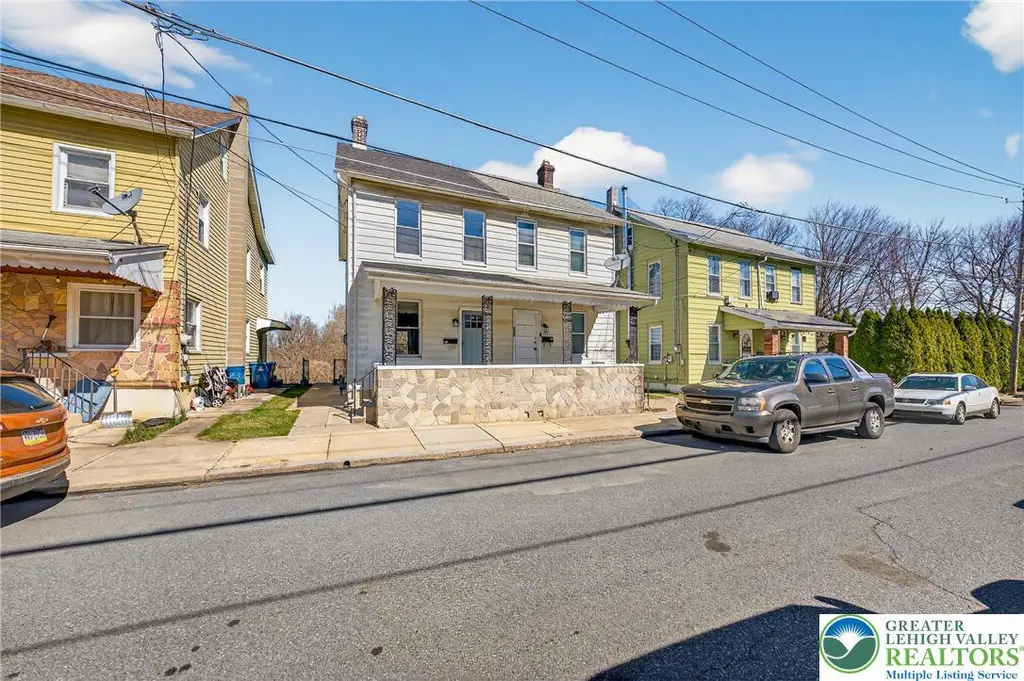
649 20th St E · Northampton, PA
Flood risk 1/10 · Minimal
- FEMA flood zone
- X (unshaded)
- Chance of flooding over 30 yrs
- 0.0%
- Est. flood insurance / yr
- $473 – $860
Fire risk 1/10 · Minimal
- Est. fire insurance / yr
- $511 – $949
Heat risk 4/10 · Minor
- Hot days now (above 100°F)
- 7 days/yr
- Hot days in 30 yrs
- 15 days/yr
Wind risk 4/10 · Minor
- Chance of severe wind over 30 yrs
- 16.0%
Air-quality risk 2/10 · Minimal
- Unhealthy air days now
- 0 days/yr
- Unhealthy air days in 30 yrs
- 1 days/yr
Risk factors via First Street. Map © Google.
Why this score? — see what drove the F grade
The composite is a weighted blend of 9 inputs, each scored 0–100. Each bar is that input's sub-score; the figure is the points it added to the 100-point composite (weight × sub-score).
- ARV discount +7.5/15.0
- Cash flow +5.3/30.0
- Schools +4.4/10.0
- Livability +4.0/5.0
- Rent growth +2.8/5.0
- Condition / age +2.5/5.0
- 1% rule +0.6/10.0
- DSCR +0.0/10.0
- Appreciation +0.0/10.0
$235,000
🖨 Deal sheet 📄 Offer letter ✓ Due diligence
Listing remarks MLS
MONEY MAKER! Great investment. Most units in the area are getting over $1000 rent per month New windows, New siding, New electrical and so much more. Gorgeous hardwood floors. Easy to rent.
Key facts
- 2,600 sq ft lot
- Built 1900
- Listed 16 days
Neighborhood map
What this means for you Summary
Snapshot
- This is a 2-bed/1.0-bath single-family listed at $235k.
Deal economics
- At list price, monthly cash flow is $-523 ($-6k/yr) — negative.
- To cash-flow at today's rent, offer at most $143k (39.3% below list).
- To meet the 1% rule (rent ≥ 1% of price), the offer needs to be $131k (44.4% below list).
- Recommended offer: $131k (44.4% below list) — sets the bar for 1% rule.
Location & tenants
- Location reads 80/100 on livability (#226 in PA, #1,961 nationally) — a professional / high-income tenant draw. Strengths: crime A+, cost of living A+, housing A+; Watch: amenities F, commute F.
- Northampton Area SD (suburban): math 47% / reading 54% proficiency, ranked #153 of 539 in PA (top 28%) — acceptable for families but not a draw, mixed tenant base, ~2y average lease.
- Market conditions: Rents rising (+1.3%/yr); 98 active listings in the ZIP; 3 comparable units currently listed for rent nearby; rentals at typical pace (median 19d on market — plan ~3-4 weeks tenant-placement turnaround); solid renter incomes; 567 units permitted in Northampton County in 2024 (151 in 5+ unit buildings).
- This rent is only 17% of the median local income ($94k/yr) — well below the 30% rent-burden line; pricing power to push rent on renewal without tenant pushback.
Forward outlook
- Local home prices are declining (-3.0%/yr); year-one equity from $2k of loan paydown is wiped out by about $7k of value loss. Plan a longer hold.
Negotiation context
- It's been on market 16 days — a 2% lower offer ($231k) is reasonable based on typical stale-listing flexibility.
- 4 sale attempts since 11y ago with the ask held roughly flat each time — persistent listings suggest the price (not the market) is what's stuck; bring a comps-based counter.
- Current owner paid $105k; list at $235k implies a 124% gain — meaningful room to come down on a strong offer.
Risks & watch-outs
- Watch-outs: built in 1900 — expect roof / HVAC / electrical / plumbing capex.
Questions for the listing agent
- What do current leases actually rent for vs. the listed asking? Can we see a recent rent roll and the last 12 months of T-12 income?
- Built in 1900 — when were the roof, HVAC, electrical panel, plumbing, and water heater last replaced?
- Is there a deadline driving the sale (1031 exchange, divorce, estate, relocation)? That informs how much negotiation room exists.
- Schools are B-rated — typically a magnet for longer-tenancy family renters. What's the average tenant stay here, and is there a school-zone premium baked into asking?
- The area grade is low — what's the realistic commute time and amenity access for the typical tenant pool here? Any planned neighborhood developments (good or bad) we should know about?
- What's the average days-on-market for RENTAL listings here right now (not sales)? A rising rental-DOM trend means longer vacancies and softer asking-rent achievability than the comps imply.
- What's the recent tenant-quality profile in this submarket — average credit score on applications, eviction rate, late-payment / NSF rate, and stable-employment percentage? A property-management company in the area should have these aggregated.
- How much new for-sale + rental construction is in the pipeline within 1–3 miles? Heavy new supply typically softens prices + rents 12–24 months out; constrained supply supports both.
Investment metrics
- 1% rule
- 0.56% ✗
- Cap rate
- 3.62%
- Cash-on-cash
- -9.53%
- DSCR
- 0.58
- GRM
- 15.0
CMA / ARV
No comps found within radius.
Projected returns pro-forma
-3.0% appreciation · 1.28% rent growth · sell at horizon
- IRR
- -35.1%
- Equity multiple
- -0.12×
- Total profit
- $-73,606
- Equity at exit
- $35,039
- IRR
- -58.2%
- Equity multiple
- -0.76×
- Total profit
- $-115,857
- Equity at exit
- $20,319
Cash invested: $65,800 (down + closing). Projections, not guarantees.
Landlord ↔ Tenant lean methodology
- Overall (STATE)
- 62 Landlord-Friendly
- State Pennsylvania
- 62 Landlord-Friendly · EVEN
- County
- — inherits STATE
- City
- — inherits STATE
ZIP-level market 18067
- Rents YoY
- 1.3%
- Active inventory
- 98
- Price-to-rent
- 15.0×
Monthly cashflow live
- Estimated rent
- $1,307 medium interval (Pro) →
- Mortgage (P&I)
- −$1,232
- Tax from tax record
- −$225 /mo · $2,700/yr
- Insurance
- −$98
- HOA
- −$0
- Vacancy / Maint / Mgmt
- −$275
- Net cashflow
- $-523
Break-even live
UW: 25.0% down · 7.5% · 30yr · 1.5% tax · 5.0% vac · 8.0% maint · 8.0% mgmt
Financing live
Cash to close
- Down payment
- $58,750
- Closing costs
- $7,050
- Reserves months
- —
- Total cash needed
- —
Loan-product check · same deal, 3 products live
Conventional
25% down · 7.5% · 30yr
- Down + closing
- —
- Monthly P&I
- —
- Monthly cashflow
- —
- DSCR
- —
- Eligible?
- —
Personal DTI + credit; lowest rate.
DSCR
20% down · 8.5% · 30yr
- Down + closing
- —
- Monthly P&I
- —
- Monthly cashflow
- —
- DSCR
- —
- Eligible?
- —
No personal income docs; deal must DSCR.
Hard money
10% down · 12.0% · 12mo
- Down + closing
- —
- Monthly P&I
- —
- Monthly cashflow
- —
- DSCR
- —
- Eligible?
- —
Short-term bridge; refi at stabilization.
Rent comps 3 comps
| Address | Beds | Baths | Sqft | Rent | $/sqft | DOM | Units | Dist |
|---|---|---|---|---|---|---|---|---|
| 2347 Washington Ave Unit 1 Northampton, PA | 1.0 | 1.0 | 660 | $1,250 | $1.89 | 19d | 1 | 0.49mi |
| 1690 Newport Ave Unit 4 Northampton, PA | 1.0 | 1.0 | 800 | $1,095 | $1.37 | 14d | 1 | 0.65mi |
| 961 Main St Northampton, PA | 1.0 | 1.0 | 900 | $1,025 | $1.14 | 44d | 1 | 0.96mi |
Listing history 15 events
-
2026-04-21status Pending
-
2026-04-18status Active
-
2026-03-31status Pending
-
2026-03-17$235,000 Active
-
2026-01-12soldstatus $105,000
-
2016-03-30soldstatus $75,000
-
2016-03-29soldstatus $75,000 Sold 191-char remark
Show marketing remark (352 chars)
PRICED BELOW market value. CHEAPER than renting. Very clean and ready to move in. Gorgeous new hard wood floors. Large living and dining area. Eat in kitchen. Large fenced yard. 2 bedrooms with expandable attic. Modern and clean bathroom. Covered porch. Large basement with new gas furnace. New windows, doors and roof. Nothing to do but move right in.
-
2016-03-29soldstatus $75,000 Sold 352-char remark
Show marketing remark (352 chars)
PRICED BELOW market value. CHEAPER than renting. Very clean and ready to move in. Gorgeous new hard wood floors. Large living and dining area. Eat in kitchen. Large fenced yard. 2 bedrooms with expandable attic. Modern and clean bathroom. Covered porch. Large basement with new gas furnace. New windows, doors and roof. Nothing to do but move right in.
-
2016-03-08status Pending 191-char remark
Show marketing remark (191 chars)
MONEY MAKER! Great investment. Most units in the area are getting over $1000 rent per month New windows, New siding, New electrical and so much more. Gorgeous hardwood floors. Easy to rent.
-
2016-03-03status Pending 352-char remark
Show marketing remark (352 chars)
PRICED BELOW market value. CHEAPER than renting. Very clean and ready to move in. Gorgeous new hard wood floors. Large living and dining area. Eat in kitchen. Large fenced yard. 2 bedrooms with expandable attic. Modern and clean bathroom. Covered porch. Large basement with new gas furnace. New windows, doors and roof. Nothing to do but move right in.
-
2016-02-09$89,900 Active 191-char remark
Show marketing remark (191 chars)
MONEY MAKER! Great investment. Most units in the area are getting over $1000 rent per month New windows, New siding, New electrical and so much more. Gorgeous hardwood floors. Easy to rent.
-
2015-10-15price $89,900 352-char remark
Show marketing remark (352 chars)
PRICED BELOW market value. CHEAPER than renting. Very clean and ready to move in. Gorgeous new hard wood floors. Large living and dining area. Eat in kitchen. Large fenced yard. 2 bedrooms with expandable attic. Modern and clean bathroom. Covered porch. Large basement with new gas furnace. New windows, doors and roof. Nothing to do but move right in.
-
2015-07-06price $99,900 352-char remark
Show marketing remark (352 chars)
PRICED BELOW market value. CHEAPER than renting. Very clean and ready to move in. Gorgeous new hard wood floors. Large living and dining area. Eat in kitchen. Large fenced yard. 2 bedrooms with expandable attic. Modern and clean bathroom. Covered porch. Large basement with new gas furnace. New windows, doors and roof. Nothing to do but move right in.
-
2015-06-05$109,900 Active 352-char remark
Show marketing remark (352 chars)
PRICED BELOW market value. CHEAPER than renting. Very clean and ready to move in. Gorgeous new hard wood floors. Large living and dining area. Eat in kitchen. Large fenced yard. 2 bedrooms with expandable attic. Modern and clean bathroom. Covered porch. Large basement with new gas furnace. New windows, doors and roof. Nothing to do but move right in.
-
1998-03-17soldstatus $49,000
ⓘ Source: listings_history table (triggers on properties + properties_extension) + one-shot
backfill from property_details.listing_events for pre-trigger history.
Tax reassessment forecast PA · Partial reset (capped growth)
- Current annual tax
- $2,700 · $225/mo
- Projected year-2 tax
- $3,207 · $267/mo
- Expected delta
- +$506/yr (+$42/mo · 18.8%)
ⓘ Screening estimate from a state-policy table — verify with the county assessor before closing.
Climate risk First Street
- Flood 1/10 Low FEMA zone X (unshaded) · 0% chance over 30 yrs
- Wildfire 1/10 Low
- Heat 4/10 Moderate 7 d/yr ≥100°F today · 15 d/yr by 30 yrs out
- Wind 4/10 Moderate 16% chance of damaging wind over 30 yrs
- Air quality 2/10 Low 0 unhealthy d/yr today · 1 by 30 yrs out
Nearby sold comps map
Loading sold comps map…
Walkable amenities ~0.75 mi
Loading nearby amenities…
Taxation est. · year 1
- Rental income
- $15,688
- − Mortgage interest
- −$13,164
- − Property taxes
- −$2,700
- − Insurance
- −$1,175
- − Repairs & maintenance
- −$1,255
- − Management
- −$1,255
- − Depreciation
- −$6,836
- Taxable loss
- −$10,697
- Est. tax savings @ 24.0%
- +$2,567
- After-tax cash flow
- $-3,703/yr
For passive investors: Depreciation is non-cash, so a rental often shows a tax loss while cash-flowing — sheltering income. Rental losses are passive: they offset passive income freely, and up to $25,000/yr can offset ordinary (W-2) income if you actively participate and your MAGI is under $100k (phasing out to $0 by $150k); unused losses carry forward. On sale, claimed depreciation is recaptured at up to 25%, and gains may owe capital-gains tax (a 1031 exchange can defer both). Figures are a year-1 estimate at your 24.0% rate — not tax advice; consult a CPA.
Schools (NCES district)
- District
- Northampton Area SD
- NCES district ID
- 4217370
- Math proficiency
- 47% ▼ -1.00%
- Reading proficiency
- 54% ▼ -13.00%
- Median HH income
- $62,326
- Composite
- 44.35/100
- National rank
- #2822
- State rank
- #153 of 539 in PA
Livability — Northampton
- Score
- 80/100
- State rank
- #226
- US rank
- #1961
Category grades
Schools grade is shown separately in the Schools card above.
Census & demographics
- Census place
- Northampton, PA
- County
- Northampton County · 236,814 people
- City population
- 19,590
- Metro
- Allentown-Bethlehem-Easton, PA-NJ
- Population (ZIP)
- 19,590
- Household income
- $93,652
- Rent vs Own
- Severe rent burden
- 326.0
Population outlook (Northampton County) Hauer SSP2
- Today (2025)
- 312,227 people
- By 2030
- 314,769 · +0.8%
- By 2040
- 316,914 · +1.5%
- By 2050
- 318,037 · +1.9%
- By 2075
- 334,003 · +7.0%
- By 2100
- 344,696 · +10.4%
Race, ethnicity, and origin ACS 2023
- Neighborhood character
- Predominantly White (85%)
- Race & ethnicity
- White 85% Hispanic / Latino 10% Two or more races 7% Asian 1% Black 1%
- Hispanic origin (detail)
- Mexican 2% Puerto Rican 6% Dominican 1%
- Common ancestry
- Polish 4% Romanian 3% Scotch-Irish 2%
- Foreign-born
- 5% · Canada, China
- Languages at home
- 92% English-only · Spanish 3% Other Indo-European 2% Russian/Polish/Slavic 1%
Political lean MEDSL · Northampton
- 2024 margin
- Toss-up / Even · D 48.6% · R 50.4%
- 2008→2024 swing
- -14.1pp toward R · 2008: 12.3pp · 2024: -1.8pp
- All cycles
- 2024: R+1.8 2020: D+0.7 2016: R+3.8 2012: D+4.6 2008: D+12.3
Not yet ingested
- Civics
- —
Market trends
- HPI YoY
- ▼ -183.11%
- Current HPI
- 222.3606
- Rent YoY
- ▲ 1.28%
- Metro
- Allentown-Bethlehem-Easton, PA-NJ
- State GDP YoY
- ▲ 1.68%
- F500 in state
- 34
Industry mix (Fortune 500 HQ in PA)
| Industry | F500 HQs | Revenue |
|---|---|---|
| Healthcare | 2 | $309B |
|
||
| Insurance | 2 | $27B |
|
||
| Telecommunications / Media | 1 | $124B |
|
||
| Industrial Distribution | 1 | $22B |
|
||
| Financial Services | 1 | $20B |
|
||
| Chemicals / Materials | 1 | $18B |
|
||
Price history
+379.6% since first listed15 events — show timeline
- 2026-04-21 Pending — GLVRMLS
- 2026-04-18 Relisted — GLVRMLS
- 2026-03-31 Pending — GLVRMLS
- 2026-03-17 Listed $235,000 GLVRMLS
- 2026-01-12 Sold (Public Records) $105,000 Public Records
- 2016-03-30 Sold (Public Records) $75,000 Public Records
- 2016-03-29 Sold (MLS) $75,000 GLVRMLS
- 2016-03-29 Sold (MLS) $75,000 GLVRMLS
- 2016-03-08 Pending — GLVRMLS
- 2016-03-03 Pending — GLVRMLS
- 2016-02-09 Listed $89,900 GLVRMLS
- 2015-10-15 Price Changed $89,900 GLVRMLS
- 2015-07-06 Price Changed $99,900 GLVRMLS
- 2015-06-05 Listed $109,900 GLVRMLS
- 1998-03-17 Sold (Public Records) $49,000 Public Records
Property tax history
+2.0%/yrLatest (2026): $2,700 · +5.8% YoY. Source: county tax records.
Cash-flow waterfall
monthlySold comps — $/sqft
last 12 mo · ≤1 miLoading sold comps…