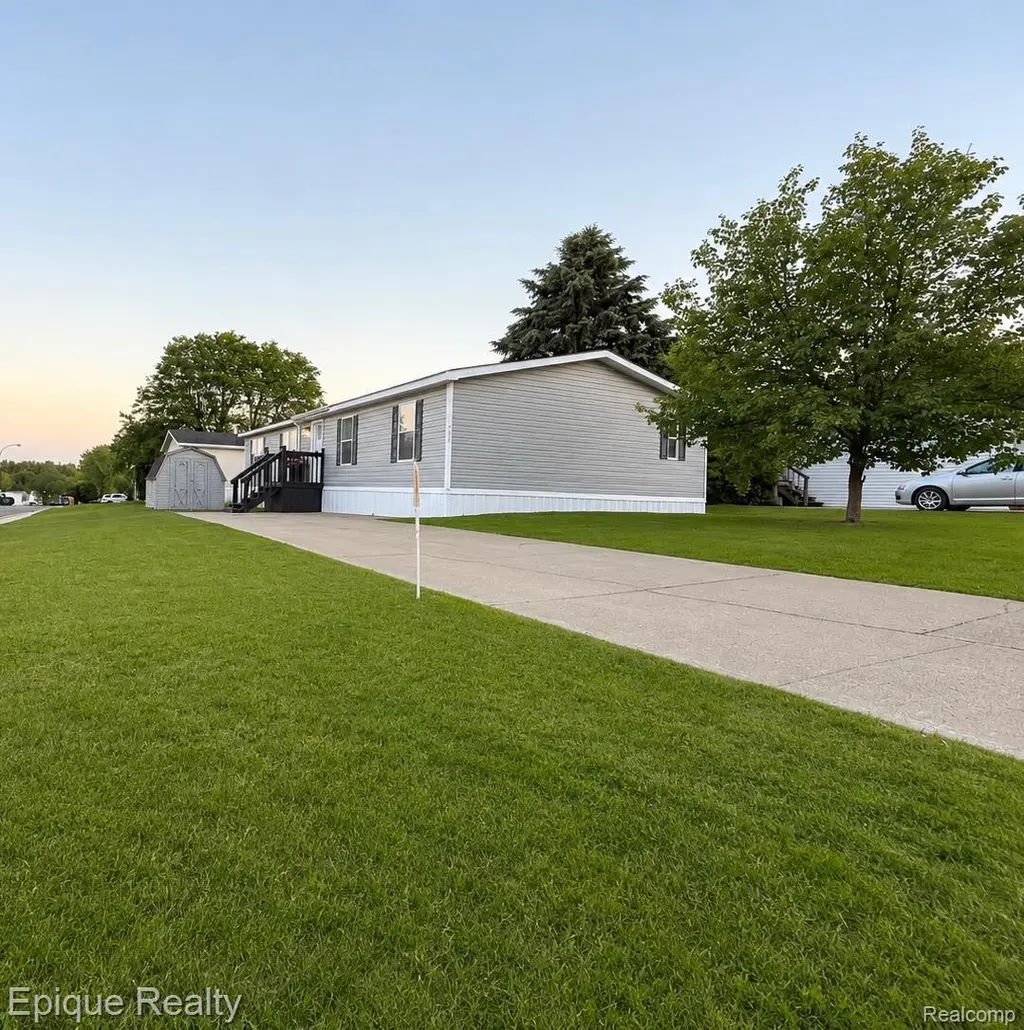
1908 Abels St · Milford, MI
Flood risk No data
- FEMA flood zone
- —
- Chance of flooding over 30 yrs
- —
- Est. flood insurance / yr
- —
Fire risk No data
- Est. fire insurance / yr
- —
Heat risk No data
- Hot days now (above threshold)
- —
- Hot days in 30 yrs
- —
Wind risk No data
- Chance of severe wind over 30 yrs
- —
Air-quality risk No data
- Unhealthy air days now
- —
- Unhealthy air days in 30 yrs
- —
Risk factors via First Street. Map © Google.
Why this score? — see what drove the B grade
The composite is a weighted blend of 9 inputs, each scored 0–100. Each bar is that input's sub-score; the figure is the points it added to the 100-point composite (weight × sub-score).
- Cash flow +30.0/30.0
- 1% rule +10.0/10.0
- DSCR +10.0/10.0
- ARV discount +7.5/15.0
- Schools +4.4/10.0
- Livability +4.4/5.0
- Rent growth +2.5/5.0
- Condition / age +2.2/5.0
- Appreciation +0.0/10.0
$64,000
🖨 Deal sheet 📄 Offer letter ✓ Due diligence
Listing remarks
Welcome to * * 1908 Abels Street in Milford Charter Township * * , where modern updates meet affordable living! This beautifully * * completely remodeled home in 2026 * * is move-in ready and packed with high-quality upgrades that set it apart. Featuring * * 3 spacious bedrooms and 2 fully remodeled bathrooms * * , this home has been thoughtfully updated from top to bottom. Enjoy peace of mind with a * * brand-new roof * * , while the stylish interior showcases * * new luxury vinyl plank flooring throughout * * , offering both durability and elegance. The stunning kitchen has been completely transformed with * * new cabinetry * * , quality countertops, and * * high-end
Key facts
- Built 1989
- Listed 16 days
Property features AI
Exterior
- Parking: No garage
- Utilities: Public water; Public sewer
- Home design: Single-family residential home; One story with ground-level entry
- Construction: Vinyl siding; Pillar/post/pier foundation
- Exterior features: Beach access and lake privileges on Childs Lake; Paved road access; Irregular-shaped lot
Interior
- Bathrooms: Two full bathrooms
- Heating & cooling: Central air conditioning; Forced air heating on natural gas; ENERGY STAR qualified heating equipment
- Interior features: Electric water heater; Five total rooms
Neighborhood map
What this means for you Summary
Snapshot
- This is a 3-bed/2.0-bath single-family listed at $64k. Condition is rated fair.
Deal economics
- At list price, monthly cash flow is $642 ($8k/yr) — positive.
- The deal already cash-flows at list — no discount required.
- Meets the 1% rule at list price ($1k rent vs $64k).
- Recommended offer: $63k (1.5% below list) — sets the bar for market timing.
- Cap rate 18.3% vs local median 2.1% in Milford — top-decile yield for the area; either an underpriced asset or a hidden risk that comps aren't pricing in. Stress-test before assuming the spread holds.
Location & tenants
- Location reads 87/100 on livability (#17 in MI, #275 nationally) — a professional / high-income tenant draw. Strengths: crime A+, amenities A+, employment A+; Watch: commute F.
- Huron Valley Schools (suburban): math 42% / reading 56% proficiency, ranked #87 of 540 in MI (top 16%) — families likely to look elsewhere, expect single-tenant / working-renter base with shorter leases.
- Market conditions: 180 active listings in the ZIP; 3 comparable units currently listed for rent nearby; rentals at typical pace (median 15d on market — plan ~3-4 weeks tenant-placement turnaround); 2,614 units permitted in Oakland County in 2024 (721 in 5+ unit buildings).
Forward outlook
- Local home prices are declining (-3.0%/yr); year-one equity from $442 of loan paydown is wiped out by about $2k of value loss. Plan a longer hold.
- Oakland County population projected at +10% by 2050 — modest demand growth; plan on rents tracking national, not racing it.
- At projected returns (-3.0% appreciation + 3.0% rent growth), your $18k cash investment doubles in ~3 years — after that, you're playing with house money.
Negotiation context
- It's been on market 16 days — a 2% lower offer ($63k) is reasonable based on typical stale-listing flexibility.
Questions for the listing agent
- Have any recent inspections been done? Can we get a copy of the seller's disclosures and any deferred-maintenance estimates?
- Is there a deadline driving the sale (1031 exchange, divorce, estate, relocation)? That informs how much negotiation room exists.
- Schools are B-rated — typically a magnet for longer-tenancy family renters. What's the average tenant stay here, and is there a school-zone premium baked into asking?
- What's the average days-on-market for RENTAL listings here right now (not sales)? A rising rental-DOM trend means longer vacancies and softer asking-rent achievability than the comps imply.
- What's the recent tenant-quality profile in this submarket — average credit score on applications, eviction rate, late-payment / NSF rate, and stable-employment percentage? A property-management company in the area should have these aggregated.
- How much new for-sale + rental construction is in the pipeline within 1–3 miles? Heavy new supply typically softens prices + rents 12–24 months out; constrained supply supports both.
Investment metrics
- 1% rule
- 2.14% ✓
- Cap rate
- 18.33%
- Cash-on-cash
- 43.00%
- DSCR
- 2.91
- GRM
- 3.9
CMA / ARV
- ARV (on-the-fly)
- $397,300
- Comps found
- 1
Show comp detail 1 sale within ~0.75 mi
| Address | Dist | Beds/Ba | Sqft | Sold | Price | $/sf | Match |
|---|---|---|---|---|---|---|---|
| 3920 Childs Lake Rd | 0.34mi | 3/2.0 | 1,534 (+6%) | 10mo | $420,000 | $274 | 66 |
Match score weights: distance 35% · size 25% · config 20% · recency 20%. Top-matched comps best support the ARV.
Projected returns pro-forma
-3.0% appreciation · 3.0% rent growth · sell at horizon
- IRR
- 39.8%
- Equity multiple
- 2.70×
- Total profit
- $30,545
- Equity at exit
- $9,543
- IRR
- 46.2%
- Equity multiple
- 5.43×
- Total profit
- $79,342
- Equity at exit
- $5,534
Cash invested: $17,920 (down + closing). Projections, not guarantees.
Landlord ↔ Tenant lean methodology
- Overall (STATE)
- 62 Landlord-Friendly
- State Michigan
- 62 Landlord-Friendly · EVEN
- County
- — inherits STATE
- City
- — inherits STATE
ZIP-level market 48381
- Active inventory
- 180
- Price-to-rent
- 3.9×
Monthly cashflow live
- Estimated rent
- $1,373 medium interval (Pro) →
- Mortgage (P&I)
- −$336
- Tax est. 1.5%
- −$80 /mo · $960/yr
- Insurance
- −$27
- HOA
- −$0
- Vacancy / Maint / Mgmt
- −$288
- Net cashflow
- $642
Break-even live
UW: 25.0% down · 7.5% · 30yr · 1.5% tax · 5.0% vac · 8.0% maint · 8.0% mgmt
Financing live
Cash to close
- Down payment
- $16,000
- Closing costs
- $1,920
- Reserves months
- —
- Total cash needed
- —
Loan-product check · same deal, 3 products live
Conventional
25% down · 7.5% · 30yr
- Down + closing
- —
- Monthly P&I
- —
- Monthly cashflow
- —
- DSCR
- —
- Eligible?
- —
Personal DTI + credit; lowest rate.
DSCR
20% down · 8.5% · 30yr
- Down + closing
- —
- Monthly P&I
- —
- Monthly cashflow
- —
- DSCR
- —
- Eligible?
- —
No personal income docs; deal must DSCR.
Hard money
10% down · 12.0% · 12mo
- Down + closing
- —
- Monthly P&I
- —
- Monthly cashflow
- —
- DSCR
- —
- Eligible?
- —
Short-term bridge; refi at stabilization.
Rent comps 3 comps
| Address | Beds | Baths | Sqft | Rent | $/sqft | DOM | Units | Dist |
|---|---|---|---|---|---|---|---|---|
| 1861 Abels St Unit 344 Milford, MI | 3.0 | 2.0 | 1056 | $1,499 | $1.42 | 14d | 1 | 0.10mi |
| 1801 Davis Unit 330 Milford, MI | 3.0 | 2.0 | 1624 | $1,300 | $0.80 | 14d | 1 | 0.13mi |
| 4215 Deems St Unit 475 Milford, MI | 2.0 | 2.0 | 1056 | $1,249 | $1.18 | 24d | 1 | 0.21mi |
Listing history 12 events
-
2026-06-18days on market $64,000 Active 16 DOM
-
2026-06-17days on market $64,000 Active 15 DOM
-
2026-06-16days on market $64,000 Active 14 DOM
-
2026-06-15days on market $64,000 Active 13 DOM
-
2026-06-13days on market $64,000 Active 11 DOM
-
2026-06-13days on market $64,000 Active 10 DOM
-
2026-06-09days on market $64,000 Active 7 DOM
-
2026-06-08days on market $64,000 Active 6 DOM
-
2026-06-07days on market $64,000 Active 5 DOM
-
2026-06-04days on market $64,000 Active 2 DOM
-
2026-06-02remarks 699-char remark
-
2026-06-02$64,000 Active 1 DOM
ⓘ Source: listings_history table (triggers on properties + properties_extension) + one-shot
backfill from property_details.listing_events for pre-trigger history.
Nearby sold comps map
Loading sold comps map…
Walkable amenities ~0.75 mi
Loading nearby amenities…
Taxation est. · year 1
- Rental income
- $16,472
- − Mortgage interest
- −$3,585
- − Property taxes
- −$960
- − Insurance
- −$320
- − Repairs & maintenance
- −$1,318
- − Management
- −$1,318
- − Depreciation
- −$1,862
- Taxable income
- $7,109
- Est. tax owed @ 24.0%
- −$1,706
- After-tax cash flow
- $5,999/yr
For passive investors: Depreciation is non-cash, so a rental often shows a tax loss while cash-flowing — sheltering income. Rental losses are passive: they offset passive income freely, and up to $25,000/yr can offset ordinary (W-2) income if you actively participate and your MAGI is under $100k (phasing out to $0 by $150k); unused losses carry forward. On sale, claimed depreciation is recaptured at up to 25%, and gains may owe capital-gains tax (a 1031 exchange can defer both). Figures are a year-1 estimate at your 24.0% rate — not tax advice; consult a CPA.
Condition & rehab AI · 2 photos
This single-family home in Milford Charter Township, MI, built in 1989, requires significant exterior and interior updates to improve its condition and increase its value.
Repairs flagged
- Major roof — Significant wear and potential leaks.
- Major siding — Old and weathered, indicating a need for repainting or replacement.
- Major exterior paint — Significant discoloration and wear, indicating a need for repainting or replacement.
- Moderate HVAC/mechanicals — No specific photos, but the condition of the exterior suggests they may also be in need of updates.
- Major interior paint — No specific photos, but the condition of the exterior suggests the interior may also be in need of updates.
- Minor landscaping — No specific photos, but the overall condition of the home suggests it may need some exterior updates to improve curb appeal.
Value-add opportunities
- Both painting — Refreshing the exterior and interior paint can significantly improve the home's curb appeal and overall condition.
- Both landscaping — A well-maintained landscape can enhance the home's curb appeal and increase its value.
- Both roof replacement — Replacing the roof can address potential leaks and improve the home's overall condition.
- Both HVAC/mechanical updates — Updating the HVAC and mechanical systems can improve the home's comfort and energy efficiency, increasing its value.
- Both interior updates — Updating the interior can improve the home's condition and increase its value, making it more attractive to potential buyers or renters.
Renovation cost estimate screening
| Repair item | Severity | Est. cost |
|---|---|---|
| roof · Significant wear and potential leaks. | Major | $15,000–50,000 |
| siding · Old and weathered, indicating a need for repainting or replacement. | Major | $15,000–50,000 |
| exterior paint · Significant discoloration and wear, indicating a need for repainting or replacement. | Major | $15,000–50,000 |
| HVAC/mechanicals · No specific photos, but the condition of the exterior suggests they may also be in need of updates. | Moderate | $3,000–15,000 |
| interior paint · No specific photos, but the condition of the exterior suggests the interior may also be in need of updates. | Major | $15,000–50,000 |
| landscaping · No specific photos, but the overall condition of the home suggests it may need some exterior updates to improve curb appeal. | Minor | $500–3,000 |
| Total estimated repair cost · 6 items | $63,500–218,000 |
Value-add ROI direction
- Both painting — Refreshing the exterior and interior paint can significantly improve the home's curb appeal and overall condition. ↑
- Both landscaping — A well-maintained landscape can enhance the home's curb appeal and increase its value. ↑
- Both roof replacement — Replacing the roof can address potential leaks and improve the home's overall condition. ↑
- Both HVAC/mechanical updates — Updating the HVAC and mechanical systems can improve the home's comfort and energy efficiency, increasing its value. ↑
- Both interior updates — Updating the interior can improve the home's condition and increase its value, making it more attractive to potential buyers or renters. ↑
ⓘ Cost ranges are severity-bucket heuristics (US national rule-of-thumb). Get contractor quotes + a written scope before underwriting a rehab budget.
Schools (NCES district)
- District
- Huron Valley Schools
- NCES district ID
- 2618990
- Math proficiency
- 42% ▼ -8.00%
- Reading proficiency
- 56% ▼ -3.00%
- Median HH income
- $76,011
- Composite
- 44.39/100
- National rank
- #2815
- State rank
- #87 of 540 in MI
Livability — Milford
- Score
- 87/100
- State rank
- #17
- US rank
- #275
Category grades
Schools grade is shown separately in the Schools card above.
Census & demographics
- Population (ZIP)
- 13,737
Population outlook (Oakland County) Hauer SSP2
- Today (2025)
- 1,335,747 people
- By 2030
- 1,375,100 · +2.9%
- By 2040
- 1,435,385 · +7.5%
- By 2050
- 1,469,250 · +10.0%
- By 2075
- 1,531,946 · +14.7%
- By 2100
- 1,450,485 · +8.6%
Race, ethnicity, and origin ACS 2023
- Neighborhood character
- Predominantly White (89%)
- Race & ethnicity
- White 89% Two or more races 7% Hispanic / Latino 4% Asian 1%
- Common ancestry
- Romanian 11% Iranian 4% Slovak 3%
- Foreign-born
- 3% · Canada, China
- Languages at home
- 96% English-only · Other Indo-European 1% Spanish 1% German/W. Germanic 1%
Political lean MEDSL · Oakland
- 2024 margin
- D (+10.6) · D 54.4% · R 43.8% · Other 1.9%
- 2008→2024 swing
- -3.9pp toward R · 2008: 14.5pp · 2024: 10.6pp
- All cycles
- 2024: D+10.6 2020: D+14.1 2016: D+8.1 2012: D+8.1 2008: D+14.5
Not yet ingested
- Civics
- —
Market trends
- HPI YoY
- ▼ -303.22%
- Current HPI
- 200.4953
- Rent YoY
- —
- Metro
- —
- State GDP YoY
- ▲ 1.37%
- F500 in state
- 28
Industry mix (Fortune 500 HQ in MI)
| Industry | F500 HQs | Revenue |
|---|---|---|
| Automotive Parts | 3 | $48B |
|
||
| Automotive | 2 | $372B |
|
||
| Chemicals | 1 | $45B |
|
||
| Automotive Retail | 1 | $29B |
|
||
| Healthcare / Medical Devices | 1 | $23B |
|
||
| Automotive Technology | 1 | $20B |
|
||
Price history
1 event — show timeline
- 2026-05-31 Listed $64,000 REALCOMP
Cash-flow waterfall
monthlySold comps — $/sqft
last 12 mo · ≤1 miLoading sold comps…