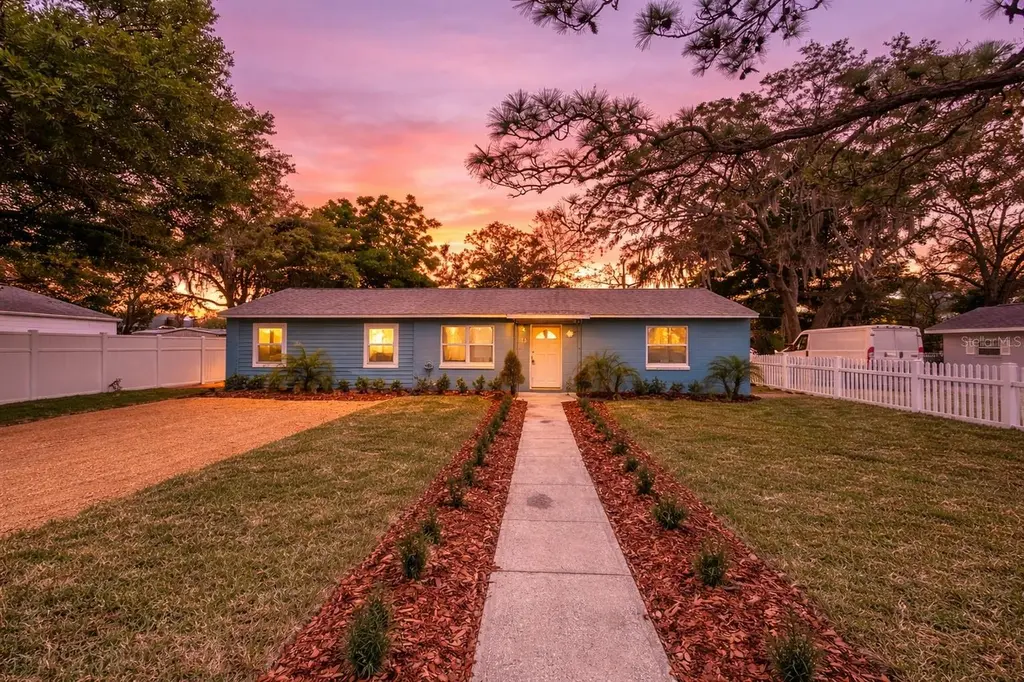
25 E Charlotte Ave · Eustis, FL
Flood risk 1/10 · Minimal
- FEMA flood zone
- X (unshaded)
- Chance of flooding over 30 yrs
- 0.0%
- Est. flood insurance / yr
- $507 – $1,088
Fire risk 1/10 · Minimal
- Est. fire insurance / yr
- $947 – $1,759
Heat risk 9/10 · Severe
- Hot days now (above 108°F)
- 7 days/yr
- Hot days in 30 yrs
- 22 days/yr
Wind risk 9/10 · Severe
- Chance of severe wind over 30 yrs
- 99.0%
Air-quality risk 2/10 · Minimal
- Unhealthy air days now
- 1 days/yr
- Unhealthy air days in 30 yrs
- 1 days/yr
Risk factors via First Street. Map © Google.
Why this score? — see what drove the D grade
The composite is a weighted blend of 9 inputs, each scored 0–100. Each bar is that input's sub-score; the figure is the points it added to the 100-point composite (weight × sub-score).
- Cash flow +11.8/30.0
- ARV discount +9.7/15.0
- Schools +4.2/10.0
- Livability +3.7/5.0
- DSCR +3.5/10.0
- Rent growth +3.3/5.0
- 1% rule +2.8/10.0
- Condition / age +2.5/5.0
- Appreciation +0.0/10.0
$263,900
🖨 Deal sheet (PDF) 📄 Offer letter ✓ Due diligence
Listing remarks MLS
Great Starter home conveniently located in Eustis!
Key facts
- Updated
- Natural light
- Energy efficiency
Tags
Property features AI
Finance
- HOA & community: No HOA/association
Exterior
- Utilities: Public water; Septic tank sewer; Public utilities
- Home design: Single family residence; One story; Faces south; Residential zoning (R-1)
- Construction: Block construction; Shingle roof; Slab foundation; Built on one level
- Exterior features: Sidewalk; Paved lot; Asphalt road frontage
Interior
- Kitchen: Convection oven; Dishwasher
- Bedrooms: 4 bedrooms
- Flooring: Vinyl
- Bathrooms: 2 full bathrooms
- Heating & cooling: Electric heating; Central air conditioning
- Interior features: Ceiling fans; Thermostat
- Laundry & utility: Washer hookup; Electric dryer hookup; Dedicated laundry room
Neighborhood map
What this means for you Summary
Snapshot
- This is a 3-bed/2.0-bath single-family listed at $264k.
Deal economics
- At list price, monthly cash flow is $-72 ($-867/yr) — negative.
- To cash-flow at today's rent, offer at most $251k (4.8% below list).
- To meet the 1% rule (rent ≥ 1% of price), the offer needs to be $207k (21.6% below list).
- Recommended offer: $207k (21.6% below list) — sets the bar for 1% rule.
- Cap rate 6.0% vs local median 4.5% in Eustis — top-decile yield for the area; either an underpriced asset or a hidden risk that comps aren't pricing in. Stress-test before assuming the spread holds.
Location & tenants
- Location reads 73/100 on livability (#309 in FL) — a middle-class / working-renter tenant base. Strengths: cost of living A+, housing A+, health & safety A; Watch: employment C-, amenities F, commute F.
- Lake (suburban): math 49% / reading 50% proficiency, ranked #37 of 73 in FL (top 51%) — families likely to look elsewhere, expect single-tenant / working-renter base with shorter leases.
- Zoned schools: Eustis Heights Elementary School (math 49% / reading 42%, grade D-, #1,247 of 2,144 statewide, top 59%, 676 students, 69% FRL); Eustis Middle School (math 45% / reading 41%, grade D-, #331 of 571 statewide, top 59%, 824 students, 57% FRL); Eustis High School (math 33% / reading 40%, grade F, #351 of 667 statewide, top 54%, 1,368 students, 45% FRL).
- Market conditions: Rents rising (+3.2%/yr); 311 active listings in the ZIP; 23 comparable units currently listed for rent nearby; rentals at typical pace (median 20d on market — plan ~3-4 weeks tenant-placement turnaround); 4,799 units permitted in Lake County in 2024 (814 in 5+ unit buildings).
- This rent runs 39% of the median local income ($63k/yr) — at the standard rent-burdened threshold; future hikes will face affordability resistance.
Forward outlook
- Local home prices are declining (-3.0%/yr); year-one equity from $2k of loan paydown is wiped out by about $8k of value loss. Plan a longer hold.
- Lake County population projected at +37% by 2050 — long-run rental-demand tailwind backs the buy-and-hold thesis.
Negotiation context
- It's been on market 45 days — a 3% lower offer ($256k) is reasonable based on typical stale-listing flexibility.
- 2 sale attempts since 20y ago with the ask held roughly flat each time — persistent listings suggest the price (not the market) is what's stuck; bring a comps-based counter.
- Current owner paid $150k; list at $264k implies a 76% gain — meaningful room to come down on a strong offer.
Risks & watch-outs
- Watch-outs: built in 1953 — expect roof / HVAC / electrical / plumbing capex.
- Climate carrying-cost: severe wind risk, 99% chance of damaging wind over 30y; extreme-heat days projected 7→22/yr by 2055 (HVAC capex compounding) — expect insurance premiums to compound above CPI over the hold.
Questions for the listing agent
- What do current leases actually rent for vs. the listed asking? Can we see a recent rent roll and the last 12 months of T-12 income?
- It's been on market 45 days. Have you received any prior offers? Is the seller open to a 22% concession, seller financing, or rate buy-down credit?
- Built in 1953 — when were the roof, HVAC, electrical panel, plumbing, and water heater last replaced?
- Is there a deadline driving the sale (1031 exchange, divorce, estate, relocation)? That informs how much negotiation room exists.
- Schools are D-rated, which usually means shorter tenancies and higher turnover. Who's the typical renter profile here, and what's been the actual vacancy rate?
- The area grade is low — what's the realistic commute time and amenity access for the typical tenant pool here? Any planned neighborhood developments (good or bad) we should know about?
- What's the average days-on-market for RENTAL listings here right now (not sales)? A rising rental-DOM trend means longer vacancies and softer asking-rent achievability than the comps imply.
- What's the recent tenant-quality profile in this submarket — average credit score on applications, eviction rate, late-payment / NSF rate, and stable-employment percentage? A property-management company in the area should have these aggregated.
- How much new for-sale + rental construction is in the pipeline within 1–3 miles? Heavy new supply typically softens prices + rents 12–24 months out; constrained supply supports both.
Investment metrics
- 1% rule
- 0.78% ✗
- Cap rate
- 5.96%
- Cash-on-cash
- -1.17%
- DSCR
- 0.95
- GRM
- 10.6
CMA / ARV
- ARV (on-the-fly)
- $277,344
- Comps found
- 8
Show comp detail 8 sales within ~0.75 mi
| Address | Dist | Beds/Ba | Sqft | Sold | Price | $/sf | Match |
|---|---|---|---|---|---|---|---|
| 88 E Charlotte Ave | 0.04mi | 3/2.0 | 1,362 (+5%) | 12mo | $280,000 | $206 | 80 |
| 1701 S Grove St | 0.39mi | 3/2.0 | 1,290 (-0%) | 10mo | $280,000 | $217 | 73 |
| 326 Bluff Pass Dr | 0.32mi | 3/2.0 | 1,309 (+1%) | 15mo | $245,000 | $187 | 71 |
| 1606 S Center St | 0.43mi | 3/2.0 | 1,308 (+1%) | 14mo | $280,000 | $214 | 66 |
| 1701 Blackberry Ct | 0.40mi | 3/2.0 | 1,366 (+5%) | 18mo | $300,000 | $220 | 57 |
| 520 W Charlotte Ave | 0.42mi | 3/2.0 | 1,473 (+14%) | 5mo | $285,000 | $193 | 54 |
| 410 W Seminole Ave | 0.34mi | 3/3.0 | 1,133 (-13%) | 12mo | $277,000 | $244 | 49 |
| 1300 Monterey Dr | 0.72mi | 3/2.0 | 1,204 (-7%) | 22mo | $252,000 | $209 | 36 |
Match score weights: distance 35% · size 25% · config 20% · recency 20%. Top-matched comps best support the ARV.
Projected returns pro-forma
-3.0% appreciation · 3.2% rent growth · sell at horizon
- IRR
- -18.0%
- Equity multiple
- 0.36×
- Total profit
- $-46,987
- Equity at exit
- $39,348
- IRR
- -9.9%
- Equity multiple
- 0.39×
- Total profit
- $-45,284
- Equity at exit
- $22,817
Cash invested: $73,892 (down + closing). Projections, not guarantees.
Landlord ↔ Tenant lean methodology
- Overall (STATE)
- 87 Strongly Landlord-Friendly
- State Florida
- 87 Strongly Landlord-Friendly · R+3
- County
- — inherits STATE
- City
- — inherits STATE
ZIP-level market 32726
- Home prices YoY
- -21.3%
- Rents YoY
- 3.2%
- Active inventory
- 311
- Price-to-rent
- 10.6×
Monthly cashflow live
- Estimated rent
- $2,070 high interval (Pro) →
- Mortgage (P&I)
- −$1,384
- Tax from tax record
- −$214 /mo · $2,564/yr
- Insurance
- −$110
- HOA
- −$0
- Vacancy / Maint / Mgmt
- −$435
- Net cashflow
- $-72
Break-even live
Sensitivity live
| Price | -10% $77 | -5% $2 | +0% $-72 | +5% $-147 | +10% $-222 |
|---|---|---|---|---|---|
| Rent | -10% $-236 | -5% $-154 | +0% $-72 | +5% $10 | +10% $91 |
| Rate | -1.0pp $61 | -0.5pp $-5 | base $-72 | +0.5pp $-141 | +1.0pp $-210 |
UW: 25.0% down · 7.5% · 30yr · 1.5% tax · 5.0% vac · 8.0% maint · 8.0% mgmt
Financing live
Cash to close
- Down payment
- $65,975
- Closing costs
- $7,917
- Reserves months
- —
- Total cash needed
- —
Loan-product check · same deal, 3 products live
Conventional
25% down · 7.5% · 30yr
- Down + closing
- —
- Monthly P&I
- —
- Monthly cashflow
- —
- DSCR
- —
- Eligible?
- —
Personal DTI + credit; lowest rate.
DSCR
20% down · 8.5% · 30yr
- Down + closing
- —
- Monthly P&I
- —
- Monthly cashflow
- —
- DSCR
- —
- Eligible?
- —
No personal income docs; deal must DSCR.
Hard money
10% down · 12.0% · 12mo
- Down + closing
- —
- Monthly P&I
- —
- Monthly cashflow
- —
- DSCR
- —
- Eligible?
- —
Short-term bridge; refi at stabilization.
Rent comps 23 comps
| Address | Beds | Baths | Sqft | Rent | $/sqft | DOM | Units | Dist |
|---|---|---|---|---|---|---|---|---|
| 408 E Idlewild Ave Eustis, FL | 4.0 | 2.5 | 1863 | $2,349 | $1.26 | 18d | 1 | 0.28mi |
| 336 Ryans Ridge Ave Eustis, FL | 4.0 | 2.0 | 1317 | $2,000 | $1.52 | 26d | 1 | 0.30mi |
| 101 E Atwater Ave Eustis, FL | 3.0 | 2.0 | 1200 | $1,900 | $1.58 | 26d | 1 | 0.58mi |
| 131 W Atwater Ave Eustis, FL | 3.0 | 1.0 | 1400 | $2,100 | $1.50 | 26d | 1 | 0.59mi |
| 1411 S Mary St Eustis, FL | 3.0 | 2.0 | 1580 | $1,950 | $1.23 | 13d | 1 | 0.63mi |
| 3437 Nettle Loop Tavares, FL | 4.0 | 2.0 | 1665 | $2,060 | $1.24 | 26d | 1 | 0.74mi |
| 4021 Lake Saunders Dr Mount Dora, FL | 2.0 | 1.0 | 1100 | $1,450 | $1.32 | 0d | 1 | 0.75mi |
| 4229 Evernia Rd Tavares, FL | 3.0 | 2.0 | 1504 | $2,100 | $1.40 | 7d | 1 | 0.76mi |
| 1124 Virginia Ct Eustis, FL | 2.0 | 1.5 | 900 | $1,750 | $1.94 | 26d | 1 | 0.77mi |
| 902 S Grove St Eustis, FL | 3.0 | 1.0 | 1389 | $1,350 | $0.97 | 26d | 1 | 0.85mi |
| 3031 Jessamine Dr Tavares, FL | 3.0 | 2.5 | 1451 | $2,016 | $1.39 | 7d | 1 | 0.88mi |
| 3422 Salvia Ct Tavares, FL | 4.0 | 2.0 | 1839 | $2,299 | $1.25 | 22d | 1 | 0.96mi |
| 3422 Salvia Ct Tavares, FL | 4.0 | 2.0 | 1839 | $2,299 | $1.25 | 26d | 1 | 0.96mi |
| 1401 E Crooked Lake Dr Eustis, FL | 3.0 | 2.0 | 1710 | $1,750 | $1.02 | 6d | 1 | 1.14mi |
| 2698 Rowan St Tavares, FL | 3.0 | 2.0 | 1614 | $2,399 | $1.49 | 4d | 1 | 1.21mi |
| 1115 Lake Nettie Dr Eustis, FL | 3.0 | 2.0 | 1756 | $2,200 | $1.25 | 20d | 1 | 1.27mi |
| 2460 Ann Rou Rd Unit 606 Tavares, FL | 2.0 | 2.0 | 1167 | $1,750 | $1.50 | 20d | 1 | 1.29mi |
| 507 Lakeshore Dr Eustis, FL | 3.0 | 2.0 | 1806 | $4,350 | $2.41 | 26d | 1 | 1.30mi |
| 116 Dewitt Ct Unit 116 Eustis, FL | 3.0 | 2.0 | 1296 | $1,850 | $1.43 | 20d | 1 | 1.35mi |
| 116 Dewitt Ct Eustis, FL | 3.0 | 2.0 | 1299 | $1,890 | $1.45 | 26d | 1 | 1.35mi |
| 3342 Landing View Tavares, FL | 3.0 | 2.0 | 1690 | $1,995 | $1.18 | 5d | 1 | 1.35mi |
| 3550 Lake Center Dr Mount Dora, FL | 1.0–3.0 | 1.0–2.0 | 1026 | $1,899 | $1.85 | 0d | 25 | 1.36mi |
| 528 Citrus Ave Unit 1 Eustis, FL | 3.0 | 2.0 | 1168 | $1,700 | $1.46 | 7d | 1 | 1.39mi |
Listing history 9 events
-
2026-05-14status Pending
-
2026-04-17price $263,900
-
2026-03-30$274,900 Active
-
2006-12-18soldstatus $150,000 50-char remark
Show marketing remark (50 chars)
Great Starter home conveniently located in Eustis!
-
2006-12-18soldstatus $150,000
Show marketing remark (50 chars)
Great Starter home conveniently located in Eustis!
-
2006-10-30$165,000 50-char remark
Show marketing remark (50 chars)
Great Starter home conveniently located in Eustis!
-
1998-07-20soldstatus $54,000
-
1994-11-10soldstatus $47,000
-
1987-05-01soldstatus $42,000
ⓘ Source: listings_history table (triggers on properties + properties_extension) + one-shot
backfill from property_details.listing_events for pre-trigger history.
Tax reassessment forecast FL · Resets to sale price
- Current annual tax
- $2,564 · $214/mo
- Projected year-2 tax
- $2,564 · $214/mo
- Expected delta
- $0/yr ($0/mo · 0.0%)
ⓘ Screening estimate from a state-policy table — verify with the county assessor before closing.
Climate risk First Street
- Flood 1/10 Low FEMA zone X (unshaded) · 0% chance over 30 yrs
- Wildfire 1/10 Low
- Heat 9/10 Extreme 7 d/yr ≥108°F today · 22 d/yr by 30 yrs out
- Wind 9/10 Extreme 99% chance of damaging wind over 30 yrs
- Air quality 2/10 Low 1 unhealthy d/yr today · 1 by 30 yrs out
Nearby sold comps map
Loading sold comps map…
Walkable amenities ~0.75 mi
Loading nearby amenities…
Taxation est. · year 1
- Rental income
- $24,840
- − Mortgage interest
- −$14,783
- − Property taxes
- −$2,564
- − Insurance
- −$1,320
- − Repairs & maintenance
- −$1,987
- − Management
- −$1,987
- − Depreciation
- −$7,677
- Taxable loss
- −$5,478
- Est. tax savings @ 24.0%
- +$1,315
- After-tax cash flow
- $448/yr
For passive investors: Depreciation is non-cash, so a rental often shows a tax loss while cash-flowing — sheltering income. Rental losses are passive: they offset passive income freely, and up to $25,000/yr can offset ordinary (W-2) income if you actively participate and your MAGI is under $100k (phasing out to $0 by $150k); unused losses carry forward. On sale, claimed depreciation is recaptured at up to 25%, and gains may owe capital-gains tax (a 1031 exchange can defer both). Figures are a year-1 estimate at your 24.0% rate — not tax advice; consult a CPA.
Schools (NCES district)
- District
- Lake
- NCES district ID
- 1201050
- Math proficiency
- 49% ▼ -7.00%
- Reading proficiency
- 50% ▼ -4.00%
- Median HH income
- $46,632
- Composite
- 42.05/100
- National rank
- #3327
- State rank
- #37 of 73 in FL
Livability — Eustis
- Score
- 73/100
- State rank
- #309
- US rank
- #5286
Category grades
Schools grade is shown separately in the Schools card above.
Census & demographics
- County
- Lake County · 364,602 people
- City population
- 24,715
- Metro
- Orlando-Kissimmee-Sanford, FL
- Population (ZIP)
- 24,715
- Household income
- $63,152
- Rent vs Own
- Severe rent burden
- 584.0
Population outlook (Lake County) Hauer SSP2
- Today (2025)
- 386,640 people
- By 2030
- 417,107 · +7.9%
- By 2040
- 476,676 · +23.3%
- By 2050
- 531,296 · +37.4%
- By 2075
- 648,303 · +67.7%
- By 2100
- 698,530 · +80.7%
Race, ethnicity, and origin ACS 2023
- Neighborhood character
- Diverse neighborhood (Simpson 0.59)
- Race & ethnicity
- White 59% Black 19% Hispanic / Latino 17% Two or more races 12% Asian 2%
- Hispanic origin (detail)
- Mexican 3% Puerto Rican 7% Dominican 4%
- Common ancestry
- Hispanic 2% Romanian 2% Lithuanian 2%
- Foreign-born
- 14% · Canada, Vietnam
- Languages at home
- 84% English-only · Spanish 10% French/Haitian/Cajun 3% Other Indo-European 1%
Political lean MEDSL · Lake
- 2024 margin
- Strong R (+24.7) · D 37.3% · R 62.0%
- 2008→2024 swing
- -11.2pp toward R · 2008: -13.5pp · 2024: -24.7pp
- All cycles
- 2024: R+24.7 2020: R+20.0 2016: R+23.1 2012: R+17.1 2008: R+13.5
Not yet ingested
- Civics
- —
Market trends
- HPI YoY
- ▼ -88.12%
- Current HPI
- 325.4692
- Rent YoY
- ▲ 3.20%
- Metro
- Orlando-Kissimmee-Sanford, FL
- State GDP YoY
- ▲ 3.28%
- F500 in state
- 36
Industry mix (Fortune 500 HQ in FL)
| Industry | F500 HQs | Revenue |
|---|---|---|
| Industrial Technology | 2 | $29B |
|
||
| Insurance | 2 | $17B |
|
||
| Retail | 1 | $60B |
|
||
| Technology Distribution | 1 | $58B |
|
||
| Homebuilding | 1 | $35B |
|
||
| Technology Manufacturing | 1 | $35B |
|
||
Price history
+528.3% since first listed9 events — show timeline
- 2026-05-14 Pending — Stellar MLS as Distributed by MLS Grid
- 2026-04-17 Price Changed $263,900 Stellar MLS as Distributed by MLS Grid
- 2026-03-30 Listed $274,900 Stellar MLS as Distributed by MLS Grid
- 2006-12-18 Sold (Public Records) $150,000 Public Records
- 2006-12-18 Sold (MLS) $150,000 Stellar MLS as Distributed by MLS Grid
- 2006-10-30 Listed $165,000 Stellar MLS as Distributed by MLS Grid
- 1998-07-20 Sold (Public Records) $54,000 Public Records
- 1994-11-10 Sold (Public Records) $47,000 Public Records
- 1987-05-01 Sold (Public Records) $42,000 Public Records
Property tax history
+10.1%/yrLatest (2025): $2,564 · +3.2% YoY. Source: county tax records.
Cash-flow waterfall
monthlySold comps — $/sqft
last 12 mo · ≤1 miLoading sold comps…