 🏗️ New Construction
249 Edgewater Dr · West Columbia, TX
Flood risk 6/10 · Moderate
- FEMA flood zone
- X
- Chance of flooding over 30 yrs
- 0.67%
- Est. flood insurance / yr
- $507 – $1,088
Fire risk 1/10 · Minimal
- Est. fire insurance / yr
- $1,222 – $2,270
Heat risk 9/10 · Severe
- Hot days now (above 110°F)
- 7 days/yr
- Hot days in 30 yrs
- 25 days/yr
Wind risk 9/10 · Severe
- Chance of severe wind over 30 yrs
- 99.0%
Air-quality risk 2/10 · Minimal
- Unhealthy air days now
- 2 days/yr
- Unhealthy air days in 30 yrs
- 2 days/yr
Risk factors via First Street. Map © Google.
Why this score? — see what drove the D grade
The composite is a weighted blend of 9 inputs, each scored 0–100. Each bar is that input's sub-score; the figure is the points it added to the 100-point composite (weight × sub-score).
- Cash flow +9.7/30.0
- Appreciation +8.8/10.0
- ARV discount +7.5/15.0
- 1% rule +4.0/10.0
- Livability +3.5/5.0
- Schools +3.0/10.0
- DSCR +2.7/10.0
- Rent growth +2.5/5.0
- Condition / age +2.5/5.0
$310,000
🖨 Deal sheet (PDF) 📄 Offer letter ✓ Due diligence
Listing remarks
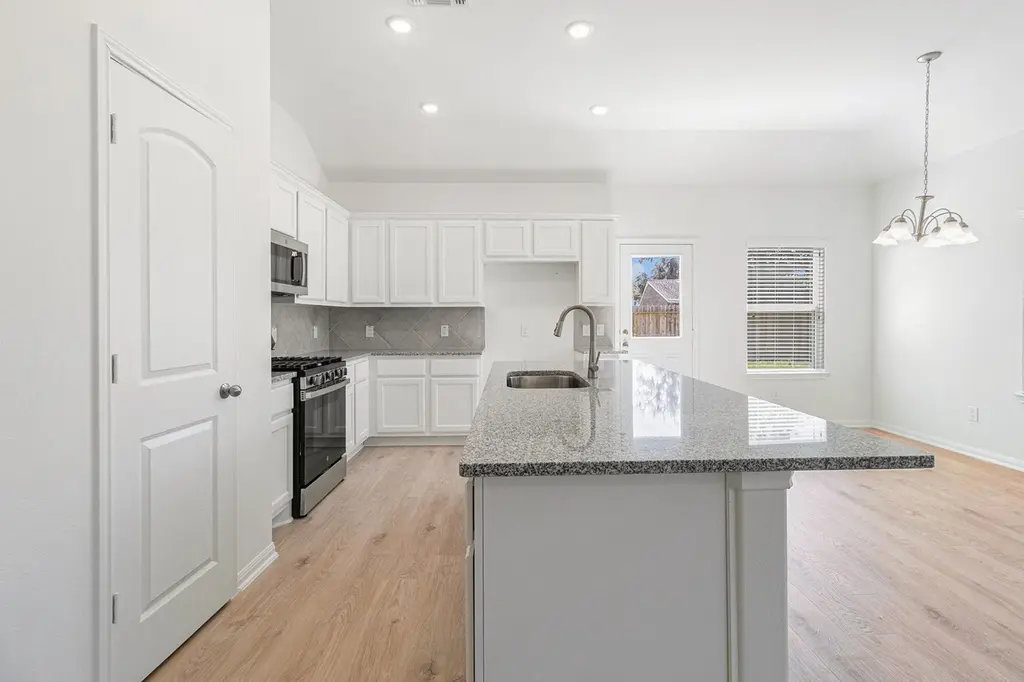
Beautiful one-story home with 1,878 SF, 4 bedrooms, 2 bathrooms, and a 2-car garage—situated on an oversized 75’ lot in a guard-gated community! Elegant features include crown molding, high ceilings, and an open layout with a spacious family room flowing into a bright kitchen with white cabinets, granite countertops, a designer backsplash, stainless steel appliances, a large island, and a breakfast area that comfortably seats eight. The primary suite offers high ceilings, dual sinks, a soaking tub, a separate shower, and his/her walk-in closets. Laminate wood floors run throughout—no carpet! Enjoy the oversized lot, perfect for entertaining. Community amenities include a g
Key facts
- Bright kitchen
- Oversized lot
- Granite countertops
Tags
Property features AI
Finance
- Other: Pond on lot; Road surfaces: asphalt and concrete
- HOA & community: Columbia Lakes HOA (monthly fee $150); Association amenities include pool, gated entry, controlled access, basketball court, golf course, and trails; Association fee covers common areas and recreation facilities
Exterior
- Parking: Attached garage with 2 spaces; Additional parking
- Security: Prewired for security; Controlled access; Smoke detectors
- Utilities: Public water; Public sewer
- Home design: Residential property; New construction (2024); Slab foundation; Composition roof; Builder: Kendall Homes
- Construction: Brick and cement siding construction; Built in 2024
- Exterior features: Covered patio; Patio; Covered deck; Fence (back yard); Patio and porch areas
Interior
- Kitchen: Dishwasher; Disposal; Gas oven; Gas range; Microwave; ENERGY STAR qualified appliances
- Bedrooms: Primary bedroom (first floor); Bedroom (first floor); Bedroom (first floor); Bedroom (first floor)
- Flooring: Laminate
- Bathrooms: 2 full bathrooms; Primary bathroom (first floor) with double vanity, soaking tub and separate shower
- Heating & cooling: Central heating (gas); Central electric air conditioning; Programmable thermostat
- Interior features: Entrance foyer; High ceilings; Kitchen island; Kitchen/family room combo; Pots & pan drawers; Pantry; Self-closing cabinet doors; Double vanity; Soaking tub; Separate shower; Tub/shower; Vanity; Window treatments; Ceiling fan(s); Programmable thermostat; Insulated doors; Low emissivity windows; Window coverings
- Laundry & utility: Washer hookup; Electric dryer hookup; Gas dryer hookup; Utility room (first floor)
Neighborhood map
What this means for you Summary
Snapshot
- This is a 4-bed/2.0-bath other listed at $310k.
Deal economics
- At list price, monthly cash flow is $-197 ($-2k/yr) — negative.
- To cash-flow at today's rent, offer at most $265k (14.6% below list).
- To meet the 1% rule (rent ≥ 1% of price), the offer needs to be $270k (12.9% below list).
- Recommended offer: $265k (14.6% below list) — sets the bar for cash-flow.
- Cap rate 5.5% vs local median 4.4% in West Columbia — meaningfully above typical; check what's discounted (condition, days-on-market, listing class) to confirm the premium yield is real.
Location & tenants
- Location reads 70/100 on livability (#375 in TX) — a middle-class / working-renter tenant base. Strengths: cost of living A+, housing A+, health & safety B+; Watch: amenities F, commute F.
- Columbia-Brazoria ISD (town): math 35% / reading 33% proficiency, ranked #513 of 826 in TX (top 62%) — families likely to look elsewhere, expect single-tenant / working-renter base with shorter leases.
- Zoned schools: West Columbia El (math 47% / reading 39%, grade F, #1,283 of 4,322 statewide, top 30%, 709 students, 60% FRL); West Brazos J H (math 34% / reading 32%, grade F, #930 of 1,662 statewide, top 57%, 676 students, 65% FRL); Columbia H S (math 13% / reading 28%, grade F, #1,389 of 1,632 statewide, top 86%, 889 students, 60% FRL).
- Market conditions: 145 active listings in the ZIP; 1 comparable units currently listed for rent nearby; 3,960 units permitted in Brazoria County in 2024 (593 in 5+ unit buildings).
Forward outlook
- In year one you build about $25k of equity ($2k loan paydown + $23k appreciation (7.6% local appreciation)).
- Brazoria County population projected at +44% by 2050 — long-run rental-demand tailwind backs the buy-and-hold thesis.
- By year 2, paydown + projected appreciation supports a ~$40k cash-out refi (75% LTV) — recoverable capital for the next deal without selling this one.
Negotiation context
- It's been on market 39 days — a 3% lower offer ($301k) is reasonable based on typical stale-listing flexibility.
- 6 sale attempts since 20y ago with the ask held roughly flat each time — persistent listings suggest the price (not the market) is what's stuck; bring a comps-based counter.
Risks & watch-outs
- Climate carrying-cost: major flood risk; severe wind risk, 99% chance of damaging wind over 30y; extreme-heat days projected 7→25/yr by 2055 (HVAC capex compounding) — expect insurance premiums to compound above CPI over the hold.
Questions for the listing agent
- What do current leases actually rent for vs. the listed asking? Can we see a recent rent roll and the last 12 months of T-12 income?
- It's been on market 39 days. Have you received any prior offers? Is the seller open to a 15% concession, seller financing, or rate buy-down credit?
- What does the HOA fee cover, when was the last increase, and are there any pending special assessments or reserve-fund shortfalls?
- Is there a deadline driving the sale (1031 exchange, divorce, estate, relocation)? That informs how much negotiation room exists.
- Schools are D-rated, which usually means shorter tenancies and higher turnover. Who's the typical renter profile here, and what's been the actual vacancy rate?
- The area grade is low — what's the realistic commute time and amenity access for the typical tenant pool here? Any planned neighborhood developments (good or bad) we should know about?
- What's the average days-on-market for RENTAL listings here right now (not sales)? A rising rental-DOM trend means longer vacancies and softer asking-rent achievability than the comps imply.
- What's the recent tenant-quality profile in this submarket — average credit score on applications, eviction rate, late-payment / NSF rate, and stable-employment percentage? A property-management company in the area should have these aggregated.
- How much new for-sale + rental construction is in the pipeline within 1–3 miles? Heavy new supply typically softens prices + rents 12–24 months out; constrained supply supports both.
Investment metrics
- 1% rule
- 0.90% ✗
- Cap rate
- 5.50%
- Cash-on-cash
- -2.82%
- DSCR
- 0.87
- GRM
- 9.2
CMA / ARV
- ARV (median comp)
- $299,613
- List price
- $310,000
- Delta
- 3.47%
- Verdict
- FAIR
- Comps
- 20 within 1.0 mi
Projected returns pro-forma
7.63% appreciation · 3.0% rent growth · sell at horizon
- IRR
- 17.0%
- Equity multiple
- 2.24×
- Total profit
- $104,004
- Equity at exit
- $220,103
- IRR
- 16.4%
- Equity multiple
- 4.71×
- Total profit
- $311,395
- Equity at exit
- $429,919
Cash invested: $83,892 (down + closing). Projections, not guarantees.
Landlord ↔ Tenant lean methodology
- Overall (STATE)
- 87 Strongly Landlord-Friendly
- State Texas
- 87 Strongly Landlord-Friendly · R+5
- County
- — inherits STATE
- City
- — inherits STATE
ZIP-level market 77486
- Home prices YoY
- 2.4%
- Active inventory
- 145
- Price-to-rent
- 9.6×
Monthly cashflow live
- Estimated rent
- $2,700 medium interval (Pro) →
- Mortgage (P&I)
- −$1,571
- Tax from tax record
- −$484 /mo · $5,808/yr
- Insurance
- −$125
- HOA
- −$150
- Lot rent
- −$0
- Vacancy / Maint / Mgmt
- −$567
- Net cashflow
- $-197
Break-even live
Sensitivity live
| Price | -10% $-27 | -5% $-112 | +0% $-197 | +5% $-282 | +10% $-367 |
|---|---|---|---|---|---|
| Rent | -10% $-410 | -5% $-304 | +0% $-197 | +5% $-90 | +10% $16 |
| Rate | -1.0pp $-46 | -0.5pp $-121 | base $-197 | +0.5pp $-275 | +1.0pp $-354 |
UW: 25.0% down · 7.5% · 30yr · 1.5% tax · 5.0% vac · 8.0% maint · 8.0% mgmt
Financing live
Cash to close
- Down payment
- $74,903
- Closing costs
- $8,988
- Reserves months
- —
- Total cash needed
- —
Loan-product check · same deal, 3 products live
Conventional
25% down · 7.5% · 30yr
- Down + closing
- —
- Monthly P&I
- —
- Monthly cashflow
- —
- DSCR
- —
- Eligible?
- —
Personal DTI + credit; lowest rate.
DSCR
20% down · 8.5% · 30yr
- Down + closing
- —
- Monthly P&I
- —
- Monthly cashflow
- —
- DSCR
- —
- Eligible?
- —
No personal income docs; deal must DSCR.
Hard money
10% down · 12.0% · 12mo
- Down + closing
- —
- Monthly P&I
- —
- Monthly cashflow
- —
- DSCR
- —
- Eligible?
- —
Short-term bridge; refi at stabilization.
Rent comps 1 comps
| Address | Beds | Baths | Sqft | Rent | $/sqft | DOM | Units | Dist |
|---|---|---|---|---|---|---|---|---|
| 2363 Ridgewood Dr West Columbia, TX | 4.0 | 2.5 | 2555 | $2,700 | $1.06 | 26d | 1 | 0.31mi |
HOA detail
- Monthly dues
- $150 · $1,800/yr
- Likely covers
- security
Listing history 30 events
-
2026-06-22days on market $310,000 Active 39 DOM
-
2026-06-21days on market $310,000 Active 38 DOM
-
2026-06-18days on market $310,000 Active 35 DOM
-
2026-06-17days on market $310,000 Active 34 DOM
-
2026-06-16days on market $310,000 Active 33 DOM
-
2026-06-15days on market $310,000 Active 32 DOM
-
2026-06-13days on market $310,000 Active 30 DOM
-
2026-06-13days on market $310,000 Active 29 DOM
-
2026-06-09days on market $310,000 Active 26 DOM
-
2026-06-08days on market $310,000 Active 25 DOM
-
2026-06-07days on market $310,000 Active 24 DOM
-
2026-06-04days on market $310,000 Active 21 DOM
-
2026-06-03days on market $310,000 Active 20 DOM
-
2026-06-02days on market $310,000 Active 19 DOM
-
2026-06-01days on market $310,000 Active 18 DOM
-
2026-05-31days on market $310,000 Active 17 DOM
-
2026-05-14$310,000 Active 850-char remark
-
2026-05-14historical
-
2025-09-10price $299,990
-
2025-08-08$339,990 Active
-
2025-08-08historical
-
2025-06-07price $339,990
-
2025-04-21$355,990 Active
-
2016-05-09soldstatus
-
2015-03-06historical
-
2013-12-04$8,500 Active
-
2010-04-12historical
-
2007-04-26$14,000
-
2007-04-25historical
-
2006-05-01$14,000
ⓘ Source: listings_history table (triggers on properties + properties_extension) + one-shot
backfill from property_details.listing_events for pre-trigger history.
Tax reassessment forecast TX · Resets to sale price
- Current annual tax
- $5,808 · $484/mo
- Projected year-2 tax
- $5,808 · $484/mo
- Expected delta
- $0/yr ($0/mo · -0.0%)
ⓘ Screening estimate from a state-policy table — verify with the county assessor before closing.
Climate risk First Street
- Flood 6/10 Major FEMA zone X · 67% chance over 30 yrs
- Wildfire 1/10 Low
- Heat 9/10 Extreme 7 d/yr ≥110°F today · 25 d/yr by 30 yrs out
- Wind 9/10 Extreme 99% chance of damaging wind over 30 yrs
- Air quality 2/10 Low 2 unhealthy d/yr today · 2 by 30 yrs out
Nearby sold comps map
Loading sold comps map…
Walkable amenities ~0.75 mi
Loading nearby amenities…
Taxation est. · year 1
- Rental income
- $32,400
- − Mortgage interest
- −$16,783
- − Property taxes
- −$5,808
- − Insurance
- −$1,498
- − Repairs & maintenance
- −$2,592
- − Management
- −$2,592
- − HOA
- −$1,800
- − Depreciation
- −$8,716
- Taxable loss
- −$7,389
- Est. tax savings @ 24.0%
- +$1,773
- After-tax cash flow
- $-591/yr
For passive investors: Depreciation is non-cash, so a rental often shows a tax loss while cash-flowing — sheltering income. Rental losses are passive: they offset passive income freely, and up to $25,000/yr can offset ordinary (W-2) income if you actively participate and your MAGI is under $100k (phasing out to $0 by $150k); unused losses carry forward. On sale, claimed depreciation is recaptured at up to 25%, and gains may owe capital-gains tax (a 1031 exchange can defer both). Figures are a year-1 estimate at your 24.0% rate — not tax advice; consult a CPA.
Schools (NCES district)
- District
- Columbia-Brazoria ISD
- NCES district ID
- 4814670
- Math proficiency
- 35% ▼ -4.00%
- Reading proficiency
- 33% ▼ -1.00%
- Median HH income
- $57,256
- Composite
- 30.23/100
- National rank
- #6297
- State rank
- #513 of 826 in TX
Livability — West Columbia
- Score
- 70/100
- State rank
- #375
- US rank
- #7954
Category grades
Schools grade is shown separately in the Schools card above.
Census & demographics
- Population (ZIP)
- 7,330
Population outlook (Brazoria County) Hauer SSP2
- Today (2025)
- 420,414 people
- By 2030
- 457,585 · +8.8%
- By 2040
- 532,232 · +26.6%
- By 2050
- 605,399 · +44.0%
- By 2075
- 779,358 · +85.4%
- By 2100
- 883,759 · +110.2%
Race, ethnicity, and origin ACS 2023
- Neighborhood character
- Majority White (61%)
- Race & ethnicity
- White 61% Hispanic / Latino 27% Two or more races 13% Black 10% Native American 1%
- Hispanic origin (detail)
- Mexican 23%
- Common ancestry
- Italian 5% Slovak 3% Lithuanian 2%
- Foreign-born
- 5% · Canada
- Languages at home
- 86% English-only · Spanish 12% German/W. Germanic 1%
Political lean MEDSL · Brazoria
- 2024 margin
- R (+19.7) · D 39.5% · R 59.2% · Other 1.3%
- 2008→2024 swing
- +9.9pp toward D · 2008: -29.6pp · 2024: -19.7pp
- All cycles
- 2024: R+19.7 2020: R+18.2 2016: R+24.6 2012: R+34.2 2008: R+29.6
Not yet ingested
- Civics
- —
Market trends
- HPI YoY
- ▲ 7.63%
- Current HPI
- 320.7967
- Rent YoY
- —
- Metro
- —
- State GDP YoY
- ▲ 3.95%
- F500 in state
- 110
Industry mix (Fortune 500 HQ in TX)
| Industry | F500 HQs | Revenue |
|---|---|---|
| Energy | 16 | $1,198B |
|
||
| Technology | 5 | $198B |
|
||
| Engineering / Construction | 4 | $72B |
|
||
| Energy Services | 3 | $60B |
|
||
| Utilities | 3 | $41B |
|
||
| Healthcare | 2 | $330B |
|
||
Price history
+2114.3% since first listed14 events — show timeline
- 2026-05-14 Listing Removed — HARMLS
- 2026-05-14 Listed $310,000 HARMLS
- 2025-09-10 Price Changed $299,990 HARMLS
- 2025-08-08 Listing Removed — HARMLS
- 2025-08-08 Listed $339,990 HARMLS
- 2025-06-07 Price Changed $339,990 HARMLS
- 2025-04-21 Listed $355,990 HARMLS
- 2016-05-09 Sold (Public Records) — Public Records
- 2015-03-06 Listing Removed — HARMLS
- 2013-12-04 Listed $8,500 HARMLS
- 2010-04-12 Listing Removed — HARMLS
- 2007-04-26 Listed $14,000 HARMLS
- 2007-04-25 Listing Removed — HARMLS
- 2006-05-01 Listed $14,000 HARMLS
Property tax history
+43.6%/yrLatest (2025): $5,808 · +698.4% YoY. Source: county tax records.
Cash-flow waterfall
monthlySold comps — $/sqft
last 12 mo · ≤1 miLoading sold comps…