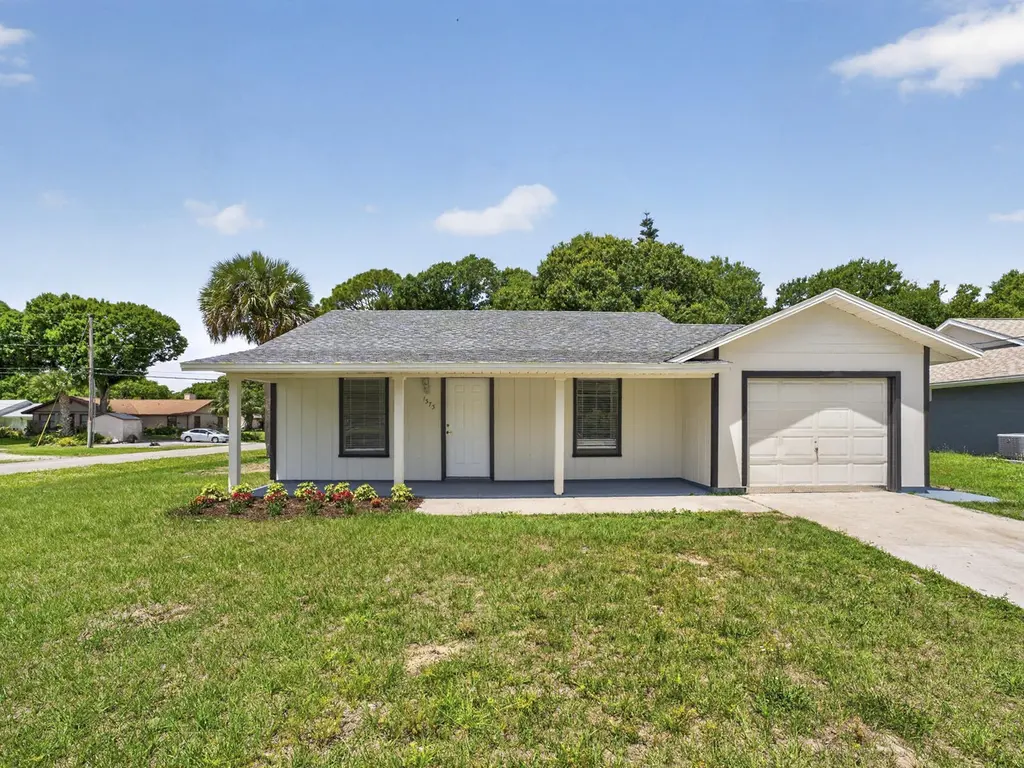
1373 32nd Ave SW · Florida Ridge, FL
Flood risk 1/10 · Minimal
- FEMA flood zone
- X (unshaded)
- Chance of flooding over 30 yrs
- 0.0%
- Est. flood insurance / yr
- $507 – $1,088
Fire risk 3/10 · Minor
- Est. fire insurance / yr
- $947 – $1,759
Heat risk 10/10 · Severe
- Hot days now (above 106°F)
- 7 days/yr
- Hot days in 30 yrs
- 24 days/yr
Wind risk 10/10 · Severe
- Chance of severe wind over 30 yrs
- 99.0%
Air-quality risk 1/10 · Minimal
- Unhealthy air days now
- 0 days/yr
- Unhealthy air days in 30 yrs
- 0 days/yr
Risk factors via First Street. Map © Google.
Why this score? — see what drove the D grade
The composite is a weighted blend of 9 inputs, each scored 0–100. Each bar is that input's sub-score; the figure is the points it added to the 100-point composite (weight × sub-score).
- Cash flow +13.9/30.0
- ARV discount +6.6/15.0
- DSCR +4.2/10.0
- Schools +4.2/10.0
- Livability +3.6/5.0
- 1% rule +3.4/10.0
- Rent growth +2.5/5.0
- Condition / age +2.5/5.0
- Appreciation +0.0/10.0
$299,900
🖨 Deal sheet (PDF) 📄 Offer letter ✓ Due diligence
Listing remarks MLS
Completely renovated! Welcome to this beautifully maintained 3-bedroom, 2-bath home perfectly situated on a desirable corner lot. This property features a recently updated kitchen with modern finishes, fresh interior paint that gives the home a bright and inviting feel, and a brand-new roof for added peace of mind. All new appliances! The functional layout offers comfortable living spaces ideal for both everyday living and entertaining. This home is move-in ready and a must-see!
Key facts
- Updated kitchen
- Corner lot
- New roof
Tags
Property features AI
Finance
- Other: Living area reported as 1,236 (source: appraiser)
- Financial info: No investor or income/expense details listed
- HOA & community: No HOA information listed
Exterior
- Parking: Attached garage with 1 covered space; Driveway
- Security: No security features listed
- Utilities: Public water; Septic tank sewer; Electricity connected; Water connected
- Home design: Single family residence; One story; Resale property; Faces east
- Construction: Frame construction; Shingle roof; Built as a single-story dwelling
- Exterior features: Not waterfront; No waterfront features
Interior
- Kitchen: Dishwasher; Electric range; Microwave; Refrigerator; Electric water heater
- Bedrooms: Three bedrooms on the main level
- Flooring: Tile; Vinyl
- Bathrooms: Two full bathrooms on the main level
- Heating & cooling: Central heating; Central air conditioning
- Interior features: No additional interior features listed
- Laundry & utility: Washer hookup; Electric dryer hookup; Laundry located in garage
Neighborhood map
What this means for you Summary
Snapshot
- This is a 3-bed/2.0-bath single-family listed at $300k.
Deal economics
- At list price, monthly cash flow is $31 ($374/yr) — positive.
- The deal already cash-flows at list — no discount required.
- To meet the 1% rule (rent ≥ 1% of price), the offer needs to be $252k (16.1% below list).
- Recommended offer: $252k (16.1% below list) — sets the bar for 1% rule.
- Cap rate 6.4% vs local median 4.5% in Florida Ridge — top-decile yield for the area; either an underpriced asset or a hidden risk that comps aren't pricing in. Stress-test before assuming the spread holds.
Location & tenants
- Location reads 72/100 on livability (#353 in FL) — a middle-class / working-renter tenant base. Strengths: commute A+, cost of living A+, housing A+; Watch: employment D, amenities F, health & safety D-.
- Indian River (other): math 48% / reading 52% proficiency, ranked #35 of 73 in FL (top 48%) — acceptable for families but not a draw, mixed tenant base, ~2y average lease.
- Zoned schools: Citrus Elementary School (math 52% / reading 52%, grade C-, #990 of 2,144 statewide, top 48%, 666 students, 78% FRL); Oslo Middle School (math 39% / reading 45%, grade D-, #340 of 571 statewide, top 61%, 864 students, 72% FRL); Vero Beach High School (math 28% / reading 43%, grade F, #367 of 667 statewide, top 57%, 2,847 students, 50% FRL).
- Market conditions: 187 active listings in the ZIP; 7 comparable units currently listed for rent nearby; rentals at typical pace (median 23d on market — plan ~3-4 weeks tenant-placement turnaround); 564 units permitted in Indian River County in 2024 (281 in 5+ unit buildings).
Forward outlook
- Local home prices are declining (-3.0%/yr); year-one equity from $2k of loan paydown is wiped out by about $9k of value loss. Plan a longer hold.
- Indian River County population projected at +18% by 2050 — long-run rental-demand tailwind backs the buy-and-hold thesis.
Negotiation context
- It's been on market 52 days — a 3% lower offer ($291k) is reasonable based on typical stale-listing flexibility.
- 2 sale attempts with the ask held roughly flat each time — persistent listings suggest the price (not the market) is what's stuck; bring a comps-based counter.
Risks & watch-outs
- Climate carrying-cost: severe wind risk, 99% chance of damaging wind over 30y; extreme-heat days projected 7→24/yr by 2055 (HVAC capex compounding) — expect insurance premiums to compound above CPI over the hold.
Questions for the listing agent
- It's been on market 52 days. Have you received any prior offers? Is the seller open to a 16% concession, seller financing, or rate buy-down credit?
- Is there a deadline driving the sale (1031 exchange, divorce, estate, relocation)? That informs how much negotiation room exists.
- Schools are D-rated, which usually means shorter tenancies and higher turnover. Who's the typical renter profile here, and what's been the actual vacancy rate?
- The area grade is low — what's the realistic commute time and amenity access for the typical tenant pool here? Any planned neighborhood developments (good or bad) we should know about?
- What's the average days-on-market for RENTAL listings here right now (not sales)? A rising rental-DOM trend means longer vacancies and softer asking-rent achievability than the comps imply.
- What's the recent tenant-quality profile in this submarket — average credit score on applications, eviction rate, late-payment / NSF rate, and stable-employment percentage? A property-management company in the area should have these aggregated.
- How much new for-sale + rental construction is in the pipeline within 1–3 miles? Heavy new supply typically softens prices + rents 12–24 months out; constrained supply supports both.
Investment metrics
- 1% rule
- 0.84% ✗
- Cap rate
- 6.42%
- Cash-on-cash
- 0.45%
- DSCR
- 1.02
- GRM
- 9.9
CMA / ARV
- ARV (on-the-fly)
- $294,168
- Comps found
- 12
Show comp detail 12 sales within ~0.75 mi
| Address | Dist | Beds/Ba | Sqft | Sold | Price | $/sf | Match |
|---|---|---|---|---|---|---|---|
| 1304 32nd Ave SW | 0.10mi | 3/2.0 | 1,236 (0%) | 1mo | $299,000 | $242 | 95 |
| 3510 11th St SW | 0.42mi | 3/2.0 | 1,220 (-1%) | 9mo | $290,000 | $238 | 71 |
| 3409 12th St SW | 0.26mi | 3/2.0 | 1,132 (-8%) | 6mo | $325,000 | $287 | 69 |
| 1116 SW 33rd Ave Ave SW | 0.34mi | 3/2.0 | 1,380 (+12%) | 0mo | $390,000 | $283 | 65 |
| 1134 37th Ave SW | 0.42mi | 3/2.0 | 1,370 (+11%) | 0mo | $264,900 | $193 | 62 |
| 945 33rd Ave SW | 0.55mi | 3/2.0 | 1,344 (+9%) | 1mo | $319,900 | $238 | 59 |
| 1175 34th Ave SW | 0.29mi | 2/2.0 (-1) | 1,400 (+13%) | 2mo | $245,000 | $175 | 58 |
| 1306 23rd Ave SW | 0.65mi | 3/2.0 | 1,189 (-4%) | 8mo | $250,000 | $210 | 57 |
| 1336 26th Ave SW | 0.45mi | 2/1.0 (-1) | 1,158 (-6%) | 5mo | $235,000 | $203 | 56 |
| 2075 14th St SW | 0.75mi | 2/2.0 (-1) | 1,200 (-3%) | 3mo | $223,000 | $186 | 53 |
| 1635 22nd Ave SW | 0.74mi | 3/2.0 | 1,141 (-8%) | 4mo | $315,000 | $276 | 50 |
| 1395 25th Ave Ave SW | 0.52mi | 2/2.0 (-1) | 1,051 (-15%) | 2mo | $239,000 | $227 | 45 |
Match score weights: distance 35% · size 25% · config 20% · recency 20%. Top-matched comps best support the ARV.
Projected returns pro-forma
-3.0% appreciation · 3.0% rent growth · sell at horizon
- IRR
- -15.6%
- Equity multiple
- 0.44×
- Total profit
- $-46,646
- Equity at exit
- $44,716
- IRR
- -7.2%
- Equity multiple
- 0.55×
- Total profit
- $-38,200
- Equity at exit
- $25,930
Cash invested: $83,972 (down + closing). Projections, not guarantees.
Landlord ↔ Tenant lean methodology
- Overall (STATE)
- 87 Strongly Landlord-Friendly
- State Florida
- 87 Strongly Landlord-Friendly · R+3
- County
- — inherits STATE
- City
- — inherits STATE
ZIP-level market 32968
- Home prices YoY
- -27.5%
- Active inventory
- 187
- Price-to-rent
- 9.9×
Monthly cashflow live
- Estimated rent
- $2,515 high interval (Pro) →
- Mortgage (P&I)
- −$1,573
- Tax from tax record
- −$258 /mo · $3,100/yr
- Insurance
- −$125
- HOA
- −$0
- Vacancy / Maint / Mgmt
- −$528
- Net cashflow
- $31
Break-even live
Sensitivity live
| Price | -10% $201 | -5% $116 | +0% $31 | +5% $-54 | +10% $-139 |
|---|---|---|---|---|---|
| Rent | -10% $-168 | -5% $-68 | +0% $31 | +5% $131 | +10% $230 |
| Rate | -1.0pp $182 | -0.5pp $107 | base $31 | +0.5pp $-47 | +1.0pp $-126 |
UW: 25.0% down · 7.5% · 30yr · 1.5% tax · 5.0% vac · 8.0% maint · 8.0% mgmt
Financing live
Cash to close
- Down payment
- $74,975
- Closing costs
- $8,997
- Reserves months
- —
- Total cash needed
- —
Loan-product check · same deal, 3 products live
Conventional
25% down · 7.5% · 30yr
- Down + closing
- —
- Monthly P&I
- —
- Monthly cashflow
- —
- DSCR
- —
- Eligible?
- —
Personal DTI + credit; lowest rate.
DSCR
20% down · 8.5% · 30yr
- Down + closing
- —
- Monthly P&I
- —
- Monthly cashflow
- —
- DSCR
- —
- Eligible?
- —
No personal income docs; deal must DSCR.
Hard money
10% down · 12.0% · 12mo
- Down + closing
- —
- Monthly P&I
- —
- Monthly cashflow
- —
- DSCR
- —
- Eligible?
- —
Short-term bridge; refi at stabilization.
Rent comps 7 comps
| Address | Beds | Baths | Sqft | Rent | $/sqft | DOM | Units | Dist |
|---|---|---|---|---|---|---|---|---|
| 1123 37th Ave SW Unit 1541760P Vero Beach, FL | 3.0 | 2.0 | 1248 | $3,075 | $2.46 | 15d | 1 | 0.45mi |
| 2565 Langrove Ln SW Vero Beach, FL | 3.0 | 2.0 | 1464 | $2,000 | $1.37 | 23d | 1 | 0.81mi |
| 2619 Langrove Ln SW Unit 2619 Vero Beach, FL | 3.0 | 2.0 | 1464 | $2,450 | $1.67 | 23d | 1 | 0.81mi |
| 2543 Stockbridge Sq SW Vero Beach, FL | 3.0 | 2.0 | 1464 | $2,200 | $1.50 | 15d | 1 | 0.91mi |
| 826 Middleton Dr SW Vero Beach, FL | 3.0 | 2.0 | 1464 | $2,150 | $1.47 | 23d | 1 | 0.91mi |
| 3673 2nd Pl SW Vero Beach, FL | 3.0 | 2.0 | 1410 | $4,800 | $3.40 | 23d | 1 | 1.46mi |
| 3673 2nd Pl SW Vero Beach, FL | 3.0 | 2.0 | 1410 | $4,800 | $3.40 | 15d | 1 | 1.46mi |
Listing history 20 events
-
2026-06-22days on market $299,900 Active 52 DOM
-
2026-06-19days on market $299,900 Active 50 DOM
-
2026-06-18days on market $299,900 Active 49 DOM
-
2026-06-17days on market $299,900 Active 48 DOM
-
2026-06-16days on market $299,900 Active 47 DOM
-
2026-06-15days on market $299,900 Active 46 DOM
-
2026-06-14days on market $299,900 Active 44 DOM
-
2026-06-13days on market $299,900 Active 43 DOM
-
2026-06-10days on market $299,900 Active 41 DOM
-
2026-06-09days on market $299,900 Active 40 DOM
-
2026-06-08days on market $299,900 Active 39 DOM
-
2026-06-07days on market $299,900 Active 38 DOM
-
2026-06-05days on market $299,900 Active 35 DOM
-
2026-06-02days on market $299,900 Active 33 DOM
-
2026-06-01days on market $299,900 Active 32 DOM
-
2026-05-31days on market $299,900 Active 31 DOM
-
2026-05-30days on market $299,900 Active 30 DOM
-
2026-04-30$299,900 Active 485-char remark
Show marketing remark (485 chars)
Completely renovated! Welcome to this beautifully maintained 3-bedroom, 2-bath home perfectly situated on a desirable corner lot. This property features a recently updated kitchen with modern finishes, fresh interior paint that gives the home a bright and inviting feel, and a brand-new roof for added peace of mind. All new appliances! The functional layout offers comfortable living spaces ideal for both everyday living and entertaining. This home is move-in ready and a must-see!
-
2026-04-30$299,900 Active
Show marketing remark (485 chars)
Completely renovated! Welcome to this beautifully maintained 3-bedroom, 2-bath home perfectly situated on a desirable corner lot. This property features a recently updated kitchen with modern finishes, fresh interior paint that gives the home a bright and inviting feel, and a brand-new roof for added peace of mind. All new appliances! The functional layout offers comfortable living spaces ideal for both everyday living and entertaining. This home is move-in ready and a must-see!
-
2018-11-29soldstatus $400,000
ⓘ Source: listings_history table (triggers on properties + properties_extension) + one-shot
backfill from property_details.listing_events for pre-trigger history.
Tax reassessment forecast FL · Resets to sale price
- Current annual tax
- $3,100 · $258/mo
- Projected year-2 tax
- $3,100 · $258/mo
- Expected delta
- $0/yr ($0/mo · 0.0%)
ⓘ Screening estimate from a state-policy table — verify with the county assessor before closing.
Climate risk First Street
- Flood 1/10 Low FEMA zone X (unshaded) · 0% chance over 30 yrs
- Wildfire 3/10 Moderate
- Heat 10/10 Extreme 7 d/yr ≥106°F today · 24 d/yr by 30 yrs out
- Wind 10/10 Extreme 99% chance of damaging wind over 30 yrs
- Air quality 1/10 Low 0 unhealthy d/yr today · 0 by 30 yrs out
Nearby sold comps map
Loading sold comps map…
Walkable amenities ~0.75 mi
Loading nearby amenities…
Taxation est. · year 1
- Rental income
- $30,185
- − Mortgage interest
- −$16,799
- − Property taxes
- −$3,100
- − Insurance
- −$1,500
- − Repairs & maintenance
- −$2,415
- − Management
- −$2,415
- − Depreciation
- −$8,724
- Taxable loss
- −$4,768
- Est. tax savings @ 24.0%
- +$1,144
- After-tax cash flow
- $1,518/yr
For passive investors: Depreciation is non-cash, so a rental often shows a tax loss while cash-flowing — sheltering income. Rental losses are passive: they offset passive income freely, and up to $25,000/yr can offset ordinary (W-2) income if you actively participate and your MAGI is under $100k (phasing out to $0 by $150k); unused losses carry forward. On sale, claimed depreciation is recaptured at up to 25%, and gains may owe capital-gains tax (a 1031 exchange can defer both). Figures are a year-1 estimate at your 24.0% rate — not tax advice; consult a CPA.
Schools (NCES district)
- District
- Indian River
- NCES district ID
- 1200930
- Math proficiency
- 48% ▼ -9.00%
- Reading proficiency
- 52% ▼ -3.00%
- Median HH income
- $46,597
- Composite
- 42.45/100
- National rank
- #3218
- State rank
- #35 of 73 in FL
Livability — Florida Ridge
- Score
- 72/100
- State rank
- #353
- US rank
- #6129
Category grades
Schools grade is shown separately in the Schools card above.
Census & demographics
- City population
- 25,629
- Population (ZIP)
- 15,576
Population outlook (Indian River County) Hauer SSP2
- Today (2025)
- 165,104 people
- By 2030
- 172,869 · +4.7%
- By 2040
- 185,640 · +12.4%
- By 2050
- 194,465 · +17.8%
- By 2075
- 211,115 · +27.9%
- By 2100
- 211,781 · +28.3%
Race, ethnicity, and origin ACS 2023
- Neighborhood character
- Predominantly White (80%)
- Race & ethnicity
- White 80% Hispanic / Latino 12% Two or more races 11% Black 4%
- Hispanic origin (detail)
- Mexican 4% Puerto Rican 3% Cuban 2%
- Common ancestry
- Romanian 4% Slovak 3% Lithuanian 3%
- Foreign-born
- 5% · Canada, China
- Languages at home
- 90% English-only · Spanish 7% Other Indo-European 1% Chinese 1%
Political lean MEDSL · Indian River
- 2024 margin
- Strong R (+27.4) · D 36.0% · R 63.4%
- 2008→2024 swing
- -12.5pp toward R · 2008: -14.8pp · 2024: -27.4pp
- All cycles
- 2024: R+27.4 2020: R+21.6 2016: R+24.5 2012: R+22.3 2008: R+14.8
Not yet ingested
- Civics
- —
Market trends
- HPI YoY
- ▼ -118.63%
- Current HPI
- 312.136
- Rent YoY
- —
- Metro
- —
- State GDP YoY
- ▲ 3.28%
- F500 in state
- 36
Industry mix (Fortune 500 HQ in FL)
| Industry | F500 HQs | Revenue |
|---|---|---|
| Industrial Technology | 2 | $29B |
|
||
| Insurance | 2 | $17B |
|
||
| Retail | 1 | $60B |
|
||
| Technology Distribution | 1 | $58B |
|
||
| Homebuilding | 1 | $35B |
|
||
| Technology Manufacturing | 1 | $35B |
|
||
Price history
-25.0% since first listed3 events — show timeline
- 2026-04-30 Listed $299,900 Beaches MLS
- 2026-04-30 Listed $299,900 RAIRCMLS
- 2018-11-29 Sold (Public Records) $400,000 Public Records
Property tax history
+11.1%/yrLatest (2025): $3,100 · +16.8% YoY. Source: county tax records.
Cash-flow waterfall
monthlySold comps — $/sqft
last 12 mo · ≤1 miLoading sold comps…