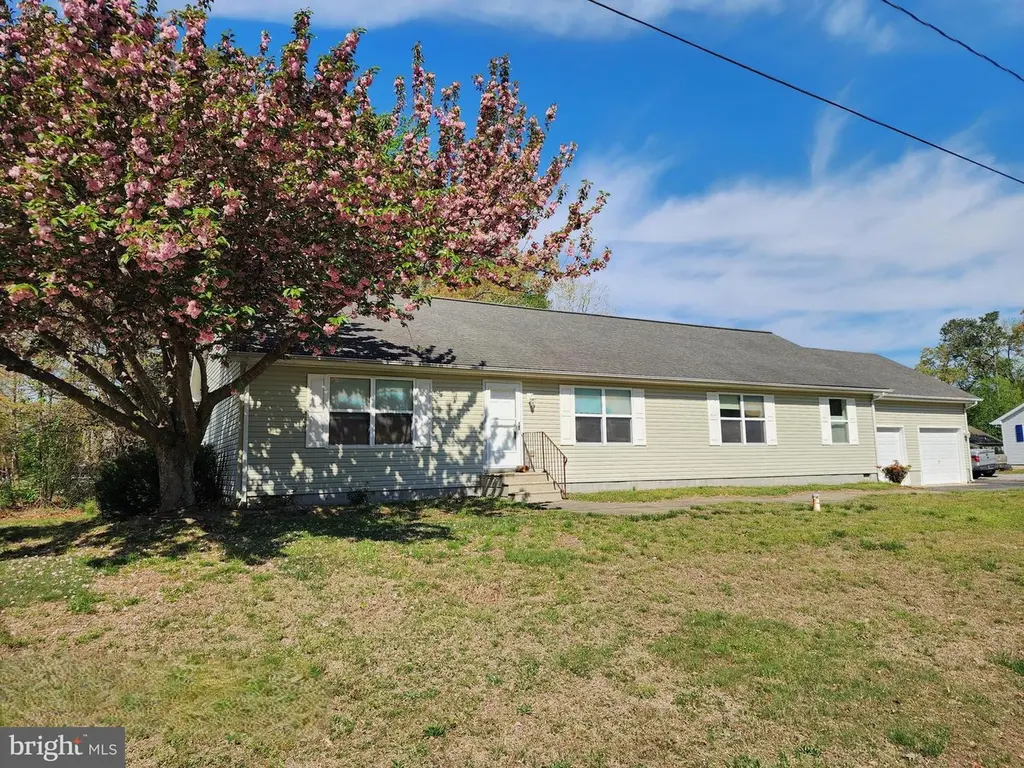
209 Sandy Beach Dr · Millsboro, DE
Flood risk 1/10 · Minimal
- FEMA flood zone
- X (unshaded)
- Chance of flooding over 30 yrs
- 0.0%
- Est. flood insurance / yr
- $473 – $860
Fire risk 2/10 · Minimal
- Est. fire insurance / yr
- $476 – $884
Heat risk 8/10 · Major
- Hot days now (above 102°F)
- 7 days/yr
- Hot days in 30 yrs
- 17 days/yr
Wind risk 8/10 · Major
- Chance of severe wind over 30 yrs
- 80.0%
Air-quality risk 2/10 · Minimal
- Unhealthy air days now
- 1 days/yr
- Unhealthy air days in 30 yrs
- 1 days/yr
Risk factors via First Street. Map © Google.
Why this score? — see what drove the D grade
The composite is a weighted blend of 9 inputs, each scored 0–100. Each bar is that input's sub-score; the figure is the points it added to the 100-point composite (weight × sub-score).
- ARV discount +15.0/15.0
- Appreciation +10.0/10.0
- Cash flow +6.0/30.0
- Livability +3.3/5.0
- Schools +2.9/10.0
- Rent growth +2.5/5.0
- Condition / age +2.5/5.0
- 1% rule +1.4/10.0
- DSCR +0.4/10.0
$350,000
🖨 Deal sheet (PDF) 📄 Offer letter ✓ Due diligence
Listing remarks MLS
A rare find in this subdivision: Large 3BR, 2BA rancher with a 2-car garage situated on a manageable yard. Fully painted interior/doors and new carpet ordered to be installed. Septic system inspected and certified. The development of "Sandy Beach" has access to the Indian River, offering kayak drops and a small boat ramp. Enjoy fishing, crabbing and jet skiing too!
Key facts
- Small boat ramp
- Kayak drops
- Indian river access
Tags
Neighborhood map
What this means for you Summary
Snapshot
- This is a 3-bed/3.0-bath manufactured listed at $350k.
Deal economics
- At list price, monthly cash flow is $-664 ($-8k/yr) — negative.
- To cash-flow at today's rent, offer at most $254k (27.5% below list).
- To meet the 1% rule (rent ≥ 1% of price), the offer needs to be $225k (35.7% below list).
- Recommended offer: $225k (35.7% below list) — sets the bar for 1% rule.
- Cap rate 4.0% vs local median 3.3% in Millsboro — meaningfully above typical; check what's discounted (condition, days-on-market, listing class) to confirm the premium yield is real.
Location & tenants
- Location reads 66/100 on livability (#44 in DE) — a middle-class / working-renter tenant base. Strengths: health & safety A+, housing A, cost of living B+; Watch: crime D-, amenities D-, commute F.
- Indian River School District (rural): math 25% / reading 41% proficiency, ranked #14 of 26 in DE (top 54%) — families likely to look elsewhere, expect single-tenant / working-renter base with shorter leases.
- Zoned schools: Clayton (John M.) Elementary School (math 29% / reading 37%, grade F, #43 of 105 statewide, top 40%, 481 students, 0% FRL); Selbyville Middle School (math 20% / reading 49%, grade F, #12 of 36 statewide, top 34%, 719 students, 0% FRL); Indian River High School (math 32% / reading 52%, grade F, #10 of 40 statewide, top 26%, 1,088 students, 0% FRL) — zoned schools average 0% FRL vs 49% district-wide (49 pts lower); this property's tenant base skews higher-income than the district average.
- Market conditions: 107 active listings in the ZIP; 1 comparable units currently listed for rent nearby; 4,354 units permitted in Sussex County in 2024 (344 in 5+ unit buildings).
Forward outlook
- In year one you build about $37k of equity ($2k loan paydown + $35k appreciation (10.0% local appreciation)).
- Sussex County population projected at +25% by 2050 — long-run rental-demand tailwind backs the buy-and-hold thesis.
- By year 2, paydown + projected appreciation supports a ~$60k cash-out refi (75% LTV) — recoverable capital for the next deal without selling this one.
Negotiation context
- It's been on market 133 days — a 12% lower offer ($308k) is reasonable based on typical stale-listing flexibility.
- Current owner paid $26k; list at $350k implies a 1251% gain — meaningful room to come down on a strong offer.
Risks & watch-outs
- Climate carrying-cost: severe wind risk, 80% chance of damaging wind over 30y; extreme-heat days projected 7→17/yr by 2055 (HVAC capex compounding) — expect insurance premiums to compound above CPI over the hold.
Questions for the listing agent
- What do current leases actually rent for vs. the listed asking? Can we see a recent rent roll and the last 12 months of T-12 income?
- It's been on market 133 days. Have you received any prior offers? Is the seller open to a 36% concession, seller financing, or rate buy-down credit?
- What does the HOA fee cover, when was the last increase, and are there any pending special assessments or reserve-fund shortfalls?
- Why hasn't it sold? Are there any deal-killer items the seller is aware of (foundation, flood, title, zoning, code violations)?
- Is there a deadline driving the sale (1031 exchange, divorce, estate, relocation)? That informs how much negotiation room exists.
- Crime grade is D in this area — have there been break-ins, vandalism, or insurance claims at this property in the last 3 years? What carrier currently insures it and at what premium?
- The area grade is low — what's the realistic commute time and amenity access for the typical tenant pool here? Any planned neighborhood developments (good or bad) we should know about?
- What's the average days-on-market for RENTAL listings here right now (not sales)? A rising rental-DOM trend means longer vacancies and softer asking-rent achievability than the comps imply.
- What's the recent tenant-quality profile in this submarket — average credit score on applications, eviction rate, late-payment / NSF rate, and stable-employment percentage? A property-management company in the area should have these aggregated.
- How much new for-sale + rental construction is in the pipeline within 1–3 miles? Heavy new supply typically softens prices + rents 12–24 months out; constrained supply supports both.
Investment metrics
- 1% rule
- 0.64% ✗
- Cap rate
- 4.02%
- Cash-on-cash
- -8.13%
- DSCR
- 0.64
- GRM
- 13.0
CMA / ARV
- ARV (median comp)
- $421,345
- List price
- $350,000
- Delta
- -16.93%
- Verdict
- UNDERPRICED
- Comps
- 20 within 1.0 mi
Projected returns pro-forma
10.0% appreciation · 3.0% rent growth · sell at horizon
- IRR
- 18.6%
- Equity multiple
- 2.51×
- Total profit
- $148,360
- Equity at exit
- $315,308
- IRR
- 17.2%
- Equity multiple
- 5.80×
- Total profit
- $470,261
- Equity at exit
- $679,973
Cash invested: $98,000 (down + closing). Projections, not guarantees.
Landlord ↔ Tenant lean methodology
- Overall (STATE)
- 70 Landlord-Friendly
- State Delaware
- 70 Landlord-Friendly · D+7
- County
- — inherits STATE
- City
- — inherits STATE
ZIP-level market 19939
- Home prices YoY
- 9.4%
- Active inventory
- 107
- Price-to-rent
- 13.0×
Monthly cashflow live
- Estimated rent
- $2,250 medium interval (Pro) →
- Mortgage (P&I)
- −$1,835
- Tax est. 1.5%
- −$438 /mo · $5,250/yr
- Insurance
- −$146
- HOA
- −$23
- Vacancy / Maint / Mgmt
- −$472
- Net cashflow
- $-664
Break-even live
Sensitivity live
| Price | -10% $-422 | -5% $-543 | +0% $-664 | +5% $-785 | +10% $-906 |
|---|---|---|---|---|---|
| Rent | -10% $-842 | -5% $-753 | +0% $-664 | +5% $-575 | +10% $-487 |
| Rate | -1.0pp $-488 | -0.5pp $-575 | base $-664 | +0.5pp $-755 | +1.0pp $-847 |
UW: 25.0% down · 7.5% · 30yr · 1.5% tax · 5.0% vac · 8.0% maint · 8.0% mgmt
Financing live
Cash to close
- Down payment
- $87,500
- Closing costs
- $10,500
- Reserves months
- —
- Total cash needed
- —
Loan-product check · same deal, 3 products live
Conventional
25% down · 7.5% · 30yr
- Down + closing
- —
- Monthly P&I
- —
- Monthly cashflow
- —
- DSCR
- —
- Eligible?
- —
Personal DTI + credit; lowest rate.
DSCR
20% down · 8.5% · 30yr
- Down + closing
- —
- Monthly P&I
- —
- Monthly cashflow
- —
- DSCR
- —
- Eligible?
- —
No personal income docs; deal must DSCR.
Hard money
10% down · 12.0% · 12mo
- Down + closing
- —
- Monthly P&I
- —
- Monthly cashflow
- —
- DSCR
- —
- Eligible?
- —
Short-term bridge; refi at stabilization.
Rent comps 1 comps
| Address | Beds | Baths | Sqft | Rent | $/sqft | DOM | Units | Dist |
|---|---|---|---|---|---|---|---|---|
| 103 Alexandreas Ct Unit 2 Millsboro, DE | 3.0 | 2.5 | 2000 | $2,250 | $1.12 | 15d | 1 | 1.47mi |
HOA detail
- Monthly dues
- $23 · $276/yr
Listing history 8 events
-
2026-06-07statusdays on market $350,000 Pending 133 DOM
-
2026-06-02days on market $350,000 Active 130 DOM
-
2026-06-01days on market $350,000 Active 129 DOM
-
2026-05-31days on market $350,000 Active 128 DOM
-
2026-05-30days on market $350,000 Active 127 DOM
-
2026-04-16price $350,000 377-char remark
Show marketing remark (377 chars)
A rare find in this subdivision: Large 3BR, 2BA rancher with a 2-car garage situated on a manageable yard. Fully painted interior/doors and new carpet ordered to be installed. Septic system inspected and certified. The development of "Sandy Beach" has access to the Indian River, offering kayak drops and a small boat ramp. Enjoy fishing, crabbing and jet skiing too!
-
2026-01-23$375,000 Active 377-char remark
Show marketing remark (377 chars)
A rare find in this subdivision: Large 3BR, 2BA rancher with a 2-car garage situated on a manageable yard. Fully painted interior/doors and new carpet ordered to be installed. Septic system inspected and certified. The development of "Sandy Beach" has access to the Indian River, offering kayak drops and a small boat ramp. Enjoy fishing, crabbing and jet skiing too!
-
2001-11-05soldstatus $25,900
ⓘ Source: listings_history table (triggers on properties + properties_extension) + one-shot
backfill from property_details.listing_events for pre-trigger history.
Climate risk First Street
- Flood 1/10 Low FEMA zone X (unshaded) · 0% chance over 30 yrs
- Wildfire 2/10 Low
- Heat 8/10 Severe 7 d/yr ≥102°F today · 17 d/yr by 30 yrs out
- Wind 8/10 Severe 80% chance of damaging wind over 30 yrs
- Air quality 2/10 Low 1 unhealthy d/yr today · 1 by 30 yrs out
Nearby sold comps map
Loading sold comps map…
Walkable amenities ~0.75 mi
Loading nearby amenities…
Taxation est. · year 1
- Rental income
- $27,000
- − Mortgage interest
- −$19,605
- − Property taxes
- −$5,250
- − Insurance
- −$1,750
- − Repairs & maintenance
- −$2,160
- − Management
- −$2,160
- − HOA
- −$276
- − Depreciation
- −$10,182
- Taxable loss
- −$14,383
- Est. tax savings @ 24.0%
- +$3,452
- After-tax cash flow
- $-4,519/yr
For passive investors: Depreciation is non-cash, so a rental often shows a tax loss while cash-flowing — sheltering income. Rental losses are passive: they offset passive income freely, and up to $25,000/yr can offset ordinary (W-2) income if you actively participate and your MAGI is under $100k (phasing out to $0 by $150k); unused losses carry forward. On sale, claimed depreciation is recaptured at up to 25%, and gains may owe capital-gains tax (a 1031 exchange can defer both). Figures are a year-1 estimate at your 24.0% rate — not tax advice; consult a CPA.
Schools (NCES district)
- District
- Indian River School District
- NCES district ID
- 1000680
- Math proficiency
- 25% ▼ -27.00%
- Reading proficiency
- 41% ▼ -17.00%
- Median HH income
- $53,838
- Composite
- 28.99/100
- National rank
- #6620
- State rank
- #14 of 26 in DE
Livability — Millsboro
- Score
- 66/100
- State rank
- #44
- US rank
- #12135
Category grades
Schools grade is shown separately in the Schools card above.
Census & demographics
- City population
- 35,884
- Population (ZIP)
- 7,833
Population outlook (Sussex County) Hauer SSP2
- Today (2025)
- 248,853 people
- By 2030
- 264,464 · +6.3%
- By 2040
- 290,980 · +16.9%
- By 2050
- 311,259 · +25.1%
- By 2075
- 352,488 · +41.6%
- By 2100
- 367,406 · +47.6%
Race, ethnicity, and origin ACS 2023
- Neighborhood character
- Predominantly White (91%)
- Race & ethnicity
- White 91% Black 3% Two or more races 3% Hispanic / Latino 2%
- Common ancestry
- Romanian 5% German 3% Slovak 3%
- Foreign-born
- 2% · Canada
- Languages at home
- 98% English-only · Spanish 1%
Political lean MEDSL · Sussex
- 2024 margin
- R (+11.0) · D 43.9% · R 54.9% · Other 1.2%
- 2008→2024 swing
- -2.4pp toward R · 2008: -8.6pp · 2024: -11.0pp
- All cycles
- 2024: R+11.0 2020: R+11.2 2016: R+22.0 2012: R+13.0 2008: R+8.6
Not yet ingested
- Civics
- —
Market trends
- HPI YoY
- ▲ 26.76%
- Current HPI
- 312.7341
- Rent YoY
- —
- Metro
- —
- State GDP YoY
- —
- F500 in state
- 0
Price history
+1251.4% since first listed3 events — show timeline
- 2026-04-16 Price Changed $350,000 BRIGHT MLS
- 2026-01-23 Listed $375,000 BRIGHT MLS
- 2001-11-05 Sold (Public Records) $25,900 Public Records
Property tax history
-2.5%/yrLatest (2025): $314 · -39.3% YoY. Source: county tax records.
Cash-flow waterfall
monthlySold comps — $/sqft
last 12 mo · ≤1 miLoading sold comps…