 Multi-family
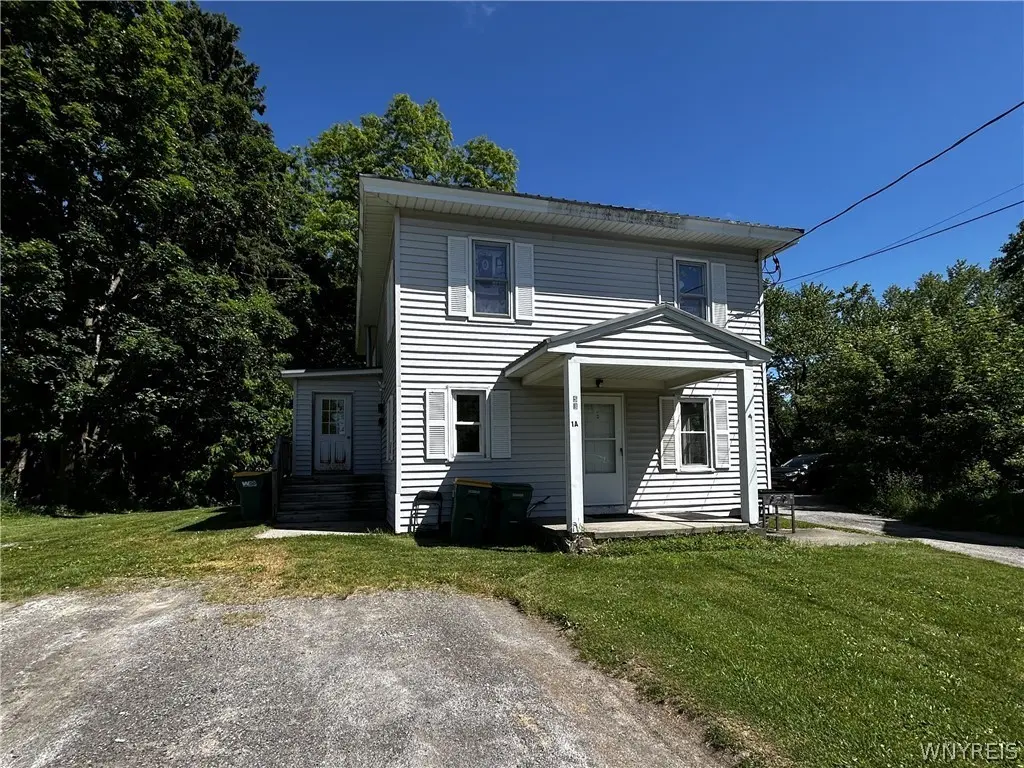
53 Grove St · Perry, NY
Flood risk 1/10 · Minimal
- FEMA flood zone
- X
- Chance of flooding over 30 yrs
- 0.0%
- Est. flood insurance / yr
- $473 – $860
Fire risk 1/10 · Minimal
- Est. fire insurance / yr
- $691 – $1,283
Heat risk 2/10 · Minimal
- Hot days now (above 93°F)
- 7 days/yr
- Hot days in 30 yrs
- 16 days/yr
Wind risk 1/10 · Minimal
- Chance of severe wind over 30 yrs
- —
Air-quality risk 1/10 · Minimal
- Unhealthy air days now
- 0 days/yr
- Unhealthy air days in 30 yrs
- 0 days/yr
Risk factors via First Street. Map © Google.
Why this score? — see what drove the B grade
The composite is a weighted blend of 9 inputs, each scored 0–100. Each bar is that input's sub-score; the figure is the points it added to the 100-point composite (weight × sub-score).
- Cash flow +30.0/30.0
- 1% rule +10.0/10.0
- DSCR +10.0/10.0
- ARV discount +7.5/15.0
- Schools +4.9/10.0
- Livability +3.6/5.0
- Rent growth +2.5/5.0
- Condition / age +2.5/5.0
- Appreciation +0.0/10.0
$175,000
🖨 Deal sheet (PDF) 📄 Offer letter ✓ Due diligence
Multi-family units
County records classify this as Multi-Family (5+ Unit). Listing-text estimate: 1 unit. estimate disagrees with records
5+ unit building — per-unit beds/baths from public records are typically unavailable; the breakdown below (if shown) is an estimate from the listing text.
Listing remarks
Investment Opportunity with Owner-Occupant Potential! Don’t miss this versatile four-unit property offering endless possibilities for investors and owner-occupants alike! Featuring four one-bedroom, one-bath apartments, this property currently has two occupied units providing immediate rental income, while the two vacant units offer the flexibility to set your own rents or move into one and let your tenants help pay the mortgage. Each unit includes appliances, and tenants enjoy the convenience of separate utilities. Situated on a quiet street with a spacious backyard, this property offers a peaceful setting while maintaining strong rental appeal. Whether you’re looking to expand
Key facts
- Quiet street
- Separate utilities
- Spacious backyard
Tags
Property features AI
Finance
- Financial info: Owner pays water; Rent includes water; Operating expenses include insurance and water/sewer; Property contains four rental units with reported rents of approximately $475–$500 per unit
Exterior
- Parking: Gravel parking with two or more spaces
- Utilities: Public water connected; Sewer connected; High-speed internet available
- Home design: 2-story building; Existing (resale) property
- Construction: Block foundation; Vinyl siding
- Exterior features: Private yard; Vinyl siding; See remarks
Interior
- Kitchen: Each unit includes an oven/range and refrigerator
- Bedrooms: Four 1-bedroom units (units are month-to-month)
- Flooring: Hardwood; Laminate; Varies
- Bathrooms: Four full bathrooms (one per unit)
- Heating & cooling: Gas forced-air heating
- Interior features: Full basement; Hardwood and laminate flooring (varies)
- Laundry & utility: Gas water heater
Neighborhood map
What this means for you Summary
Snapshot
- This is a 4-bed/4.0-bath multifamily listed at $175k.
Deal economics
- At list price, monthly cash flow is $1k ($17k/yr) — positive.
- The deal already cash-flows at list — no discount required.
- Meets the 1% rule at list price ($4k rent vs $175k).
- Cap rate 15.8% vs local median 4.2% in Perry — top-decile yield for the area; either an underpriced asset or a hidden risk that comps aren't pricing in. Stress-test before assuming the spread holds.
Location & tenants
- Location reads 72/100 on livability (#348 in NY) — a middle-class / working-renter tenant base. Strengths: cost of living A+, housing A+, health & safety A; Watch: employment D+, amenities F, commute F.
- Perry Central School District (rural): math 53% / reading 63% proficiency, ranked #272 of 590 in NY (top 46%) — acceptable for families but not a draw, mixed tenant base, ~2y average lease.
- Zoned schools: Perry Elementary School (math 47% / reading 58%, grade C-, #984 of 2,108 statewide, top 47%, 424 students, 48% FRL); Perry Junior-Senior High School (math 62% / reading 72%, grade B, #746 of 1,100 statewide, top 69%, 344 students, 52% FRL) — zoned schools average 50% FRL vs 34% district-wide (16 pts higher); higher-poverty schools than district average — tighter screening recommended.
- Market conditions: 23 active listings in the ZIP; 83 units permitted in Wyoming County in 2024 (0 in 5+ unit buildings).
Forward outlook
- Local home prices are declining (-3.0%/yr); year-one equity from $1k of loan paydown is wiped out by about $5k of value loss. Plan a longer hold.
- Wyoming County population projected at -16% by 2050 — secular population decline; favor cash flow + early exit over multi-decade hold.
- At projected returns (-3.0% appreciation + 3.0% rent growth), your $49k cash investment doubles in ~4 years — after that, you're playing with house money.
Negotiation context
- Only 12 days on market — expect competitive offers; lowballing is unlikely to land.
- Current owner paid $68k; list at $175k implies a 157% gain — meaningful room to come down on a strong offer.
Risks & watch-outs
- Watch-outs: property tax is 3.8% of price; built in 1950 — expect roof / HVAC / electrical / plumbing capex.
Questions for the listing agent
- Built in 1950 — when were the roof, HVAC, electrical panel, plumbing, and water heater last replaced?
- Property tax is high relative to price — has the assessment been appealed recently, and will the sale trigger a re-assessment?
- Is there a deadline driving the sale (1031 exchange, divorce, estate, relocation)? That informs how much negotiation room exists.
- What's the average days-on-market for RENTAL listings here right now (not sales)? A rising rental-DOM trend means longer vacancies and softer asking-rent achievability than the comps imply.
- What's the recent tenant-quality profile in this submarket — average credit score on applications, eviction rate, late-payment / NSF rate, and stable-employment percentage? A property-management company in the area should have these aggregated.
- How much new apartment / multifamily construction is in the pipeline within 1–3 miles? Heavy new supply (>2% of stock underway) typically softens rents 12–24 months out; light construction supports rent growth.
Investment metrics
- 1% rule
- 2.11% ✓
- Cap rate
- 15.80%
- Cash-on-cash
- 33.94%
- DSCR
- 2.51
- GRM
- 3.9
CMA / ARV
No comps found within radius.
Projected returns pro-forma
-3.0% appreciation · 3.0% rent growth · sell at horizon
- IRR
- 29.4%
- Equity multiple
- 2.23×
- Total profit
- $60,158
- Equity at exit
- $26,093
- IRR
- 36.7%
- Equity multiple
- 4.41×
- Total profit
- $167,079
- Equity at exit
- $15,131
Cash invested: $49,000 (down + closing). Projections, not guarantees.
Landlord ↔ Tenant lean methodology
- Overall (STATE)
- 15 Strongly Tenant-Friendly
- State New York
- 15 Strongly Tenant-Friendly · D+10
- County
- — inherits STATE
- City
- — inherits STATE
ZIP-level market 14530
- Home prices YoY
- -4.0%
- Active inventory
- 23
- Price-to-rent
- 15.8×
Monthly cashflow live
- Estimated rent
- $3,701 medium interval (Pro) →
- Mortgage (P&I)
- −$918
- Tax from tax record
- −$547 /mo · $6,569/yr
- Insurance
- −$73
- HOA
- −$0
- Vacancy / Maint / Mgmt
- −$777
- Net cashflow
- $1,386
Break-even live
Sensitivity live
| Price | -10% $1,485 | -5% $1,435 | +0% $1,386 | +5% $1,336 | +10% $1,287 |
|---|---|---|---|---|---|
| Rent | -10% $1,093 | -5% $1,240 | +0% $1,386 | +5% $1,532 | +10% $1,678 |
| Rate | -1.0pp $1,474 | -0.5pp $1,430 | base $1,386 | +0.5pp $1,340 | +1.0pp $1,294 |
4-unit breakdown (identical units grouped — click to expand)
| Units | Beds | Baths | Est. rent |
|---|---|---|---|
| 4× units | 1 | 1 | $3,700 |
| #1 | 1 | 1 | $925 |
| #2 | 1 | 1 | $925 |
| #3 | 1 | 1 | $925 |
| #4 | 1 | 1 | $925 |
| Total (4 units) | $3,701 | ||
UW: 25.0% down · 7.5% · 30yr · 1.5% tax · 5.0% vac · 8.0% maint · 8.0% mgmt
Financing live
Cash to close
- Down payment
- $43,750
- Closing costs
- $5,250
- Reserves months
- —
- Total cash needed
- —
Loan-product check · same deal, 3 products live
Conventional
25% down · 7.5% · 30yr
- Down + closing
- —
- Monthly P&I
- —
- Monthly cashflow
- —
- DSCR
- —
- Eligible?
- —
Personal DTI + credit; lowest rate.
DSCR
20% down · 8.5% · 30yr
- Down + closing
- —
- Monthly P&I
- —
- Monthly cashflow
- —
- DSCR
- —
- Eligible?
- —
No personal income docs; deal must DSCR.
Hard money
10% down · 12.0% · 12mo
- Down + closing
- —
- Monthly P&I
- —
- Monthly cashflow
- —
- DSCR
- —
- Eligible?
- —
Short-term bridge; refi at stabilization.
Listing history 10 events
-
2026-06-21days on market $175,000 Active 12 DOM
-
2026-06-21days on market $175,000 Active 11 DOM
-
2026-06-18days on market $175,000 Active 9 DOM
-
2026-06-17days on market $175,000 Active 8 DOM
-
2026-06-16days on market $175,000 Active 7 DOM
-
2026-06-15days on market $175,000 Active 6 DOM
-
2026-06-13days on market $175,000 Active 4 DOM
-
2026-06-12days on market $175,000 Active 3 DOM
-
2026-06-09remarks 687-char remark
-
2026-06-09$175,000 Active 1 DOM
ⓘ Source: listings_history table (triggers on properties + properties_extension) + one-shot
backfill from property_details.listing_events for pre-trigger history.
Tax reassessment forecast NY · Partial reset (capped growth)
- Current annual tax
- $6,569 · $547/mo
- Projected year-2 tax
- $6,569 · $547/mo
- Expected delta
- $0/yr ($0/mo · 0.0%)
ⓘ Screening estimate from a state-policy table — verify with the county assessor before closing.
Climate risk First Street
- Flood 1/10 Low FEMA zone X · 0% chance over 30 yrs
- Wildfire 1/10 Low
- Heat 2/10 Low 7 d/yr ≥93°F today · 16 d/yr by 30 yrs out
- Wind 1/10 Low
- Air quality 1/10 Low 0 unhealthy d/yr today · 0 by 30 yrs out
Nearby sold comps map
Loading sold comps map…
Walkable amenities ~0.75 mi
Loading nearby amenities…
Taxation est. · year 1
- Rental income
- $44,412
- − Mortgage interest
- −$9,803
- − Property taxes
- −$6,569
- − Insurance
- −$875
- − Repairs & maintenance
- −$3,553
- − Management
- −$3,553
- − Depreciation
- −$5,091
- Taxable income
- $14,968
- Est. tax owed @ 24.0%
- −$3,592
- After-tax cash flow
- $13,036/yr
For passive investors: Depreciation is non-cash, so a rental often shows a tax loss while cash-flowing — sheltering income. Rental losses are passive: they offset passive income freely, and up to $25,000/yr can offset ordinary (W-2) income if you actively participate and your MAGI is under $100k (phasing out to $0 by $150k); unused losses carry forward. On sale, claimed depreciation is recaptured at up to 25%, and gains may owe capital-gains tax (a 1031 exchange can defer both). Figures are a year-1 estimate at your 24.0% rate — not tax advice; consult a CPA.
Schools (NCES district)
- District
- Perry Central School District
- NCES district ID
- 3622770
- Math proficiency
- 53% ▼ -7.00%
- Reading proficiency
- 63% ▲ 12.00%
- Median HH income
- $48,386
- Composite
- 49.23/100
- National rank
- #2036
- State rank
- #272 of 590 in NY
Livability — Perry
- Score
- 72/100
- State rank
- #348
- US rank
- #5898
Category grades
Schools grade is shown separately in the Schools card above.
Census & demographics
- Census place
- Perry, NY
- Population (ZIP)
- 6,396
Population outlook (Wyoming County) Hauer SSP2
- Today (2025)
- 38,976 people
- By 2030
- 37,826 · -3.0%
- By 2040
- 35,585 · -8.7%
- By 2050
- 32,841 · -15.7%
- By 2075
- 25,920 · -33.5%
- By 2100
- 19,082 · -51.0%
Race, ethnicity, and origin ACS 2023
- Neighborhood character
- Predominantly White (84%)
- Race & ethnicity
- White 84% Hispanic / Latino 8% Black 5% Two or more races 3%
- Hispanic origin (detail)
- Mexican 5% Puerto Rican 2%
- Common ancestry
- Romanian 3% Danish 3% Slovak 2%
- Foreign-born
- 4% · Canada
- Languages at home
- 96% English-only · Spanish 3% German/W. Germanic 1%
Political lean MEDSL · Wyoming
- 2024 margin
- Solid R (+48.2) · D 25.9% · R 74.1%
- 2008→2024 swing
- -22.1pp toward R · 2008: -26.1pp · 2024: -48.2pp
- All cycles
- 2024: R+48.2 2020: R+45.5 2016: R+51.0 2012: R+29.6 2008: R+26.1
Not yet ingested
- Civics
- —
Market trends
- HPI YoY
- ▼ -10.45%
- Current HPI
- 250.8251
- Rent YoY
- —
- Metro
- —
- State GDP YoY
- ▲ 2.60%
- F500 in state
- 92
Industry mix (Fortune 500 HQ in NY)
| Industry | F500 HQs | Revenue |
|---|---|---|
| Financial Services | 10 | $950B |
|
||
| Consumer Goods | 9 | $162B |
|
||
| Insurance | 4 | $225B |
|
||
| Telecommunications | 2 | $144B |
|
||
| Pharmaceuticals | 2 | $112B |
|
||
| Media / Entertainment | 2 | $69B |
|
||
Price history
+177.8% since first listed3 events — show timeline
- 2026-06-09 Listed $175,000 WNYREIS
- 2003-10-24 Sold (Public Records) $68,000 Public Records
- 1998-01-30 Sold (Public Records) $63,000 Public Records
Property tax history
+3.9%/yrLatest (2025): $6,569 · +11.7% YoY. Source: county tax records.
Cash-flow waterfall
monthlySold comps — $/sqft
last 12 mo · ≤1 miLoading sold comps…