 Duplex
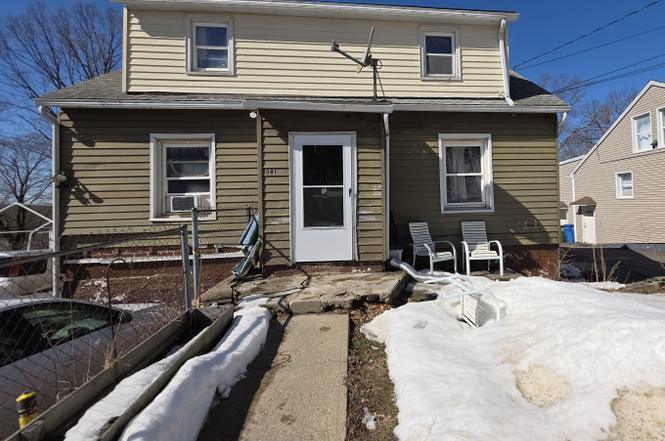
891 Pearl Lake Rd · Waterbury, CT
Flood risk 1/10 · Minimal
- FEMA flood zone
- X (unshaded)
- Chance of flooding over 30 yrs
- 0.0%
- Est. flood insurance / yr
- $473 – $860
Fire risk 1/10 · Minimal
- Est. fire insurance / yr
- $829 – $1,539
Heat risk 5/10 · Moderate
- Hot days now (above 96°F)
- 7 days/yr
- Hot days in 30 yrs
- 15 days/yr
Wind risk 6/10 · Moderate
- Chance of severe wind over 30 yrs
- 27.0%
Air-quality risk 3/10 · Minor
- Unhealthy air days now
- 2 days/yr
- Unhealthy air days in 30 yrs
- 3 days/yr
Risk factors via First Street. Map © Google.
Why this score? — see what drove the B- grade
The composite is a weighted blend of 9 inputs, each scored 0–100. Each bar is that input's sub-score; the figure is the points it added to the 100-point composite (weight × sub-score).
- Cash flow +21.0/30.0
- ARV discount +15.0/15.0
- 1% rule +7.3/10.0
- DSCR +6.7/10.0
- Appreciation +5.7/10.0
- Livability +4.0/5.0
- Rent growth +2.5/5.0
- Condition / age +2.5/5.0
- Schools +1.5/10.0
$239,900
🖨 Deal sheet 📄 Offer letter ✓ Due diligence
Multi-family units
County records classify this as Multi-Family (2-4 Unit). Listing-text estimate: 2 units. confirmed
Listing remarks
* * INVESTORS TAKE NOTICE * * Opportunity awaits here on Pearl Lake. This two-family home is the perfect investment for those seeking a property with strong potential and updated essentials. The home is slightly distressed and in need of some TLC, but features a newer roof, furnace, central air system, and oil tank-offering a solid foundation for your next project. Property includes leased solar panels and propane equipment, providing added efficiency. Currently owner-occupied and will be conveyed with vacancy, making it ideal for both investors and owner-occupants. With its solid structure, updated mechanicals, and income-producing potential, this home presents a great opportunity to ad
Key facts
- 7,405 sq ft lot
- Pool
- Built 1950
Neighborhood map
What this means for you Summary
Snapshot
- This is a 2 × 2-bed/1.0-bath units multifamily listed at $240k.
Deal economics
- At list price, monthly cash flow is $336 ($4k/yr) — positive. Per door: $168/mo.
- The deal already cash-flows at list — no discount required.
- Meets the 1% rule at list price ($3k rent vs $240k).
- Recommended offer: $236k (1.5% below list) — sets the bar for market timing.
- Cap rate 8.0% vs local median 3.6% in Waterbury — top-decile yield for the area; either an underpriced asset or a hidden risk that comps aren't pricing in. Stress-test before assuming the spread holds.
Location & tenants
- Location reads 79/100 on livability (#32 in CT, #2,205 nationally) — a middle-class / working-renter tenant base. Strengths: commute A+, cost of living A+, housing A+; Watch: schools D+, crime D, employment D.
- Waterbury School District (suburban): math 12% / reading 23% proficiency, ranked #148 of 153 in CT (top 97%) — low school quality limits family demand, transient renter base, plan for 1-2y turnover; 73% free/reduced lunch — lower-income household profile, screen leases tightly.
- Market conditions: 42 active listings in the ZIP; 2 comparable units currently listed for rent nearby; 502 units permitted in Naugatuck Valley Planning Region in 2024 (171 in 5+ unit buildings).
- At $2,954/mo this rent would consume 68% of the median local household income ($52k/yr) (locally 801% of renters already pay >50% of income on rent) — very limited rent-growth headroom before tenants either downsize or default.
Forward outlook
- In year one you build about $5k of equity ($2k loan paydown + $3k appreciation (1.4% local appreciation)).
- At projected returns (1.4% appreciation + 3.0% rent growth), your $67k cash investment doubles in ~7 years — after that, you're playing with house money.
- By year 7, paydown + projected appreciation supports a ~$33k cash-out refi (75% LTV) — recoverable capital for the next deal without selling this one.
Negotiation context
- It's been on market 20 days — a 2% lower offer ($236k) is reasonable based on typical stale-listing flexibility.
- 2 sale attempts since 4y ago with the ask held roughly flat each time — persistent listings suggest the price (not the market) is what's stuck; bring a comps-based counter.
Risks & watch-outs
- Watch-outs: property tax is 3.2% of price; built in 1950 — expect roof / HVAC / electrical / plumbing capex.
- Climate carrying-cost: major wind risk, 27% chance of damaging wind over 30y; extreme-heat days projected 7→15/yr by 2055 (HVAC capex compounding) — expect insurance premiums to compound above CPI over the hold.
Questions for the listing agent
- Can we see the unit-by-unit rent roll, current vacancy, and any below-market leases? What's the average tenancy length?
- What capital expenditures (roof, boiler, parking lot, exteriors) have been made in the last 5 years, and what's planned in the next 2?
- Built in 1950 — when were the roof, HVAC, electrical panel, plumbing, and water heater last replaced?
- Property tax is high relative to price — has the assessment been appealed recently, and will the sale trigger a re-assessment?
- Is there a deadline driving the sale (1031 exchange, divorce, estate, relocation)? That informs how much negotiation room exists.
- Schools are D-rated, which usually means shorter tenancies and higher turnover. Who's the typical renter profile here, and what's been the actual vacancy rate?
- Crime grade is D in this area — have there been break-ins, vandalism, or insurance claims at this property in the last 3 years? What carrier currently insures it and at what premium?
- What's the average days-on-market for RENTAL listings here right now (not sales)? A rising rental-DOM trend means longer vacancies and softer asking-rent achievability than the comps imply.
- What's the recent tenant-quality profile in this submarket — average credit score on applications, eviction rate, late-payment / NSF rate, and stable-employment percentage? A property-management company in the area should have these aggregated.
- How much new apartment / multifamily construction is in the pipeline within 1–3 miles? Heavy new supply (>2% of stock underway) typically softens rents 12–24 months out; light construction supports rent growth.
Investment metrics
- 1% rule
- 1.23% ✓
- Cap rate
- 7.98%
- Cash-on-cash
- 6.01%
- DSCR
- 1.27
- GRM
- 6.8
CMA / ARV
- ARV (on-the-fly)
- $401,376
- Comps found
- 2
Show comp detail 2 sales within ~0.75 mi
| Address | Dist | Beds/Ba | Sqft | Sold | Price | $/sf | Match |
|---|---|---|---|---|---|---|---|
| 425 Piedmont St | 0.37mi | 4/2.0 (-1) | 1,860 (+5%) | 3mo | $419,900 | $226 | 68 |
| 1402 Baldwin St | 0.69mi | 6/2.0 (+1) | 1,640 (-8%) | 14mo | $303,000 | $185 | 38 |
Match score weights: distance 35% · size 25% · config 20% · recency 20%. Top-matched comps best support the ARV.
Projected returns pro-forma
1.39% appreciation · 3.0% rent growth · sell at horizon
- IRR
- 8.8%
- Equity multiple
- 1.46×
- Total profit
- $30,826
- Equity at exit
- $86,852
- IRR
- 12.5%
- Equity multiple
- 2.58×
- Total profit
- $106,346
- Equity at exit
- $119,351
Cash invested: $67,172 (down + closing). Projections, not guarantees.
Landlord ↔ Tenant lean methodology
- Overall (STATE)
- 27 Tenant-Leaning
- State Connecticut
- 27 Tenant-Leaning · D+7
- County
- — inherits STATE
- City
- — inherits STATE
ZIP-level market 06706
- Home prices YoY
- 0.5%
- Active inventory
- 42
- Price-to-rent
- 13.5×
Monthly cashflow live
- Estimated rent
- $2,954 high interval (Pro) →
- Mortgage (P&I)
- −$1,258
- Tax from tax record
- −$639 /mo · $7,670/yr
- Insurance
- −$100
- HOA
- −$0
- Vacancy / Maint / Mgmt
- −$620
- Net cashflow
- $336
Break-even live
2-unit breakdown (identical units grouped — click to expand)
| Units | Beds | Baths | Est. rent |
|---|---|---|---|
| 2× units | 2 | 1 | $2,954 |
| #1 | 2 | 1 | $1,477 |
| #2 | 2 | 1 | $1,477 |
| Total (2 units) | $2,954 | ||
UW: 25.0% down · 7.5% · 30yr · 1.5% tax · 5.0% vac · 8.0% maint · 8.0% mgmt
Financing live
Cash to close
- Down payment
- $59,975
- Closing costs
- $7,197
- Reserves months
- —
- Total cash needed
- —
Loan-product check · same deal, 3 products live
Conventional
25% down · 7.5% · 30yr
- Down + closing
- —
- Monthly P&I
- —
- Monthly cashflow
- —
- DSCR
- —
- Eligible?
- —
Personal DTI + credit; lowest rate.
DSCR
20% down · 8.5% · 30yr
- Down + closing
- —
- Monthly P&I
- —
- Monthly cashflow
- —
- DSCR
- —
- Eligible?
- —
No personal income docs; deal must DSCR.
Hard money
10% down · 12.0% · 12mo
- Down + closing
- —
- Monthly P&I
- —
- Monthly cashflow
- —
- DSCR
- —
- Eligible?
- —
Short-term bridge; refi at stabilization.
Rent comps 2 comps
| Address | Beds | Baths | Sqft | Rent | $/sqft | DOM | Units | Dist |
|---|---|---|---|---|---|---|---|---|
| 218 Charles St Waterbury, CT | 4.0 | 1.5 | 2600 | $2,800 | $1.08 | 43d | 1 | 1.25mi |
| 29 Bouley Ave Waterbury, CT | 4.0 | 1.0 | 1267 | $3,000 | $2.37 | 43d | 1 | 1.48mi |
Listing history 6 events
-
2026-04-07status Under Contract
-
2026-03-29historical Under Contract - Continue to Show
-
2026-03-19$239,900 Active
-
2026-03-05historical $239,900
-
2022-01-22historical
-
2022-01-05$150,000 Active
ⓘ Source: listings_history table (triggers on properties + properties_extension) + one-shot
backfill from property_details.listing_events for pre-trigger history.
Tax reassessment forecast CT · Partial reset (capped growth)
- Current annual tax
- $7,670 · $639/mo
- Projected year-2 tax
- $7,670 · $639/mo
- Expected delta
- $0/yr ($0/mo · 0.0%)
ⓘ Screening estimate from a state-policy table — verify with the county assessor before closing.
Climate risk First Street
- Flood 1/10 Low FEMA zone X (unshaded) · 0% chance over 30 yrs
- Wildfire 1/10 Low
- Heat 5/10 Major 7 d/yr ≥96°F today · 15 d/yr by 30 yrs out
- Wind 6/10 Major 27% chance of damaging wind over 30 yrs
- Air quality 3/10 Moderate 2 unhealthy d/yr today · 3 by 30 yrs out
Nearby sold comps map
Loading sold comps map…
Walkable amenities ~0.75 mi
Loading nearby amenities…
Taxation est. · year 1
- Rental income
- $35,448
- − Mortgage interest
- −$13,438
- − Property taxes
- −$7,670
- − Insurance
- −$1,200
- − Repairs & maintenance
- −$2,836
- − Management
- −$2,836
- − Depreciation
- −$6,979
- Taxable income
- $490
- Est. tax owed @ 24.0%
- −$118
- After-tax cash flow
- $3,920/yr
For passive investors: Depreciation is non-cash, so a rental often shows a tax loss while cash-flowing — sheltering income. Rental losses are passive: they offset passive income freely, and up to $25,000/yr can offset ordinary (W-2) income if you actively participate and your MAGI is under $100k (phasing out to $0 by $150k); unused losses carry forward. On sale, claimed depreciation is recaptured at up to 25%, and gains may owe capital-gains tax (a 1031 exchange can defer both). Figures are a year-1 estimate at your 24.0% rate — not tax advice; consult a CPA.
Schools (NCES district)
- District
- Waterbury School District
- NCES district ID
- 0904830
- Math proficiency
- 12% ▼ -7.00%
- Reading proficiency
- 23% ▼ -8.00%
- Median HH income
- $40,040
- Composite
- 14.85/100
- National rank
- #9380
- State rank
- #148 of 153 in CT
Livability — Waterbury
- Score
- 79/100
- State rank
- #32
- US rank
- #2205
Category grades
Schools grade is shown separately in the Schools card above.
Census & demographics
- Census place
- Waterbury, CT
- County
- New Haven County · 688,236 people
- City population
- 115,012
- Metro
- New Haven-Milford, CT
- Population (ZIP)
- 15,551
- Household income
- $52,242
- Rent vs Own
- Severe rent burden
- 801.0
Population outlook (Naugatuck Valley County) Hauer SSP2
- By 2040
- 496,846
Race, ethnicity, and origin ACS 2023
- Neighborhood character
- Highly diverse neighborhood (Simpson 0.72)
- Race & ethnicity
- Hispanic / Latino 35% White 31% Black 25% Two or more races 12% Asian 3%
- Hispanic origin (detail)
- Puerto Rican 25% Dominican 4%
- Common ancestry
- Lithuanian 3% Estonian 2% Romanian 1%
- Foreign-born
- 20% · Canada, Jamaica
- Languages at home
- 60% English-only · Spanish 27% Other Indo-European 11% Other Asian/Pacific 1%
Political lean MEDSL · Naugatuck Valley
- 2024 margin
- Lean R (+7.4) · D 45.6% · R 53.0% · Other 1.4%
- All cycles
- 2024: R+7.4
Not yet ingested
- Civics
- —
Market trends
- HPI YoY
- ▲ 1.39%
- Current HPI
- 309.8467
- Rent YoY
- —
- Metro
- New Haven-Milford, CT
- State GDP YoY
- ▲ 1.06%
- F500 in state
- 38
Industry mix (Fortune 500 HQ in CT)
| Industry | F500 HQs | Revenue |
|---|---|---|
| Industrial Machinery | 4 | $38B |
|
||
| Insurance | 3 | $71B |
|
||
| Financial Services | 2 | $25B |
|
||
| Transportation / Logistics | 2 | $18B |
|
||
| Healthcare | 1 | $247B |
|
||
| Telecommunications | 1 | $55B |
|
||
Price history
+59.9% since first listed6 events — show timeline
- 2026-04-07 Pending — Smart MLS
- 2026-03-29 Contingent — Smart MLS
- 2026-03-19 Listed $239,900 Smart MLS
- 2026-03-05 Coming Soon $239,900 Smart MLS
- 2022-01-22 Listing Removed — Smart MLS
- 2022-01-05 Listed $150,000 Smart MLS
Property tax history
+6.1%/yrLatest (2023): $7,670 · +94.9% YoY. Source: county tax records.
Cash-flow waterfall
monthlySold comps — $/sqft
last 12 mo · ≤1 miLoading sold comps…