418 Pebblebrook Dr · Mount Juliet, TN
Flood risk 1/10 · Minimal
- FEMA flood zone
- X (unshaded)
- Chance of flooding over 30 yrs
- 0.0%
- Est. flood insurance / yr
- $507 – $1,088
Fire risk 3/10 · Minor
- Est. fire insurance / yr
- $949 – $1,763
Heat risk 6/10 · Moderate
- Hot days now (above 105°F)
- 7 days/yr
- Hot days in 30 yrs
- 20 days/yr
Wind risk 4/10 · Minor
- Chance of severe wind over 30 yrs
- 8.0%
Air-quality risk 3/10 · Minor
- Unhealthy air days now
- 2 days/yr
- Unhealthy air days in 30 yrs
- 3 days/yr
Risk factors via First Street. Map © Google.
Why this score? — see what drove the B grade
The composite is a weighted blend of 9 inputs, each scored 0–100. Each bar is that input's sub-score; the figure is the points it added to the 100-point composite (weight × sub-score).
- Cash flow +30.0/30.0
- 1% rule +10.0/10.0
- DSCR +10.0/10.0
- ARV discount +7.5/15.0
- Condition / age +4.0/5.0
- Schools +3.8/10.0
- Livability +3.6/5.0
- Rent growth +3.4/5.0
- Appreciation +0.0/10.0
$85,000
🖨 Deal sheet 📄 Offer letter ✓ Due diligence
Listing remarks
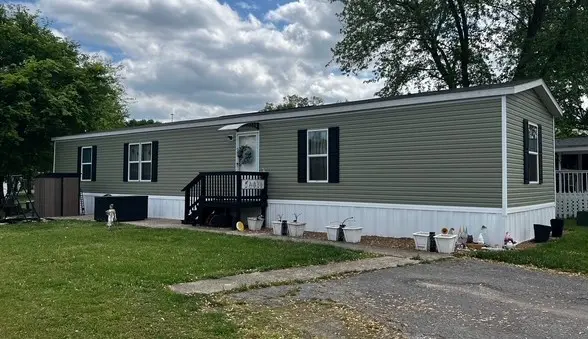
Like new and move-in ready! This 3 bed, 2 bath home in the Stonegate Manufactured Housing Community offers an incredible opportunity to own in the highly sought-after Mount Juliet school district at an affordable price point. Built in 2022 and originally used as a model home, this 1,025 sq ft singlewide still feels almost brand new. Enjoy an open layout, modern finishes, and low-maintenance living. Monthly lot rent is $750 and includes water, sewer, and trash. Community amenities feature a pool, playground, and clubhouse with shelter. Conveniently located near Providence shopping center, dining, and commuter routes. A rare chance to own instead of rent in one of Middle Tennessee’s mos
Key facts
- Community amenities
- Open layout
- Modern finishes
Tags
Property features AI
Finance
- HOA & community: Monthly HOA fee of $750 (includes water, sewer, and trash)
Exterior
- Parking: Two open parking spaces (total 2 parking spaces)
- Security: Security gate
- Utilities: Public water; Public sewer; Electricity available
- Home design: Residential mobile home; One level; Existing home
- Construction: Vinyl siding construction
- Exterior features: Vinyl siding
Interior
- Kitchen: Eat-in kitchen; Electric range; Dishwasher; Microwave; Refrigerator
- Bedrooms: Three bedrooms (all on the main level); Bedroom sizes approximately 15 x 11, 11 x 10, and 15 x 9
- Bathrooms: Two full bathrooms
- Heating & cooling: Central electric heating; Central electric air conditioning
- Interior features: Crawl space basement; Security gate
- Laundry & utility: Washer; Dryer
Neighborhood map
What this means for you Summary
Snapshot
- This is a 3-bed/2.0-bath manufactured listed at $85k. Condition is rated good.
Deal economics
- At list price, monthly cash flow is $495 ($6k/yr) — positive.
- The deal already cash-flows at list — no discount required.
- Meets the 1% rule at list price ($2k rent vs $85k).
- Recommended offer: $82k (3.0% below list) — sets the bar for market timing.
- Cap rate 13.3% vs local median 2.8% in Mount Juliet — top-decile yield for the area; either an underpriced asset or a hidden risk that comps aren't pricing in. Stress-test before assuming the spread holds.
Location & tenants
- Location reads 71/100 on livability (#48 in TN) — a middle-class / working-renter tenant base. Strengths: employment A+, housing A+, crime A; Watch: amenities F, commute F, health & safety F.
- Wilson County (rural): math 42% / reading 43% proficiency, ranked #10 of 139 in TN (top 7%) — families likely to look elsewhere, expect single-tenant / working-renter base with shorter leases.
- Market conditions: Rents rising (+3.7%/yr); 957 active listings in the ZIP; 7 comparable units currently listed for rent nearby; rentals leasing fast (median 3d on market — plan ~1-2 weeks tenant-placement turnaround); high-income renter base; 1,927 units permitted in Wilson County in 2024 (10 in 5+ unit buildings).
Forward outlook
- Local home prices are declining (-3.0%/yr); year-one equity from $588 of loan paydown is wiped out by about $3k of value loss. Plan a longer hold.
- Wilson County population projected at +47% by 2050 — long-run rental-demand tailwind backs the buy-and-hold thesis.
- At projected returns (-3.0% appreciation + 3.7% rent growth), your $24k cash investment doubles in ~5 years — after that, you're playing with house money.
Negotiation context
- It's been on market 35 days — a 3% lower offer ($82k) is reasonable based on typical stale-listing flexibility.
Risks & watch-outs
- Watch-outs: HOA is 34% of rent.
- Climate carrying-cost: extreme-heat days projected 7→20/yr by 2055 (HVAC capex compounding) — expect insurance premiums to compound above CPI over the hold.
Questions for the listing agent
- It's been on market 35 days. Have you received any prior offers? Is the seller open to a 3% concession, seller financing, or rate buy-down credit?
- What does the HOA fee cover, when was the last increase, and are there any pending special assessments or reserve-fund shortfalls?
- Is there a deadline driving the sale (1031 exchange, divorce, estate, relocation)? That informs how much negotiation room exists.
- Schools are B-rated — typically a magnet for longer-tenancy family renters. What's the average tenant stay here, and is there a school-zone premium baked into asking?
- What's the average days-on-market for RENTAL listings here right now (not sales)? A rising rental-DOM trend means longer vacancies and softer asking-rent achievability than the comps imply.
- What's the recent tenant-quality profile in this submarket — average credit score on applications, eviction rate, late-payment / NSF rate, and stable-employment percentage? A property-management company in the area should have these aggregated.
- How much new for-sale + rental construction is in the pipeline within 1–3 miles? Heavy new supply typically softens prices + rents 12–24 months out; constrained supply supports both.
Investment metrics
- 1% rule
- 2.60% ✓
- Cap rate
- 13.28%
- Cash-on-cash
- 24.97%
- DSCR
- 2.11
- GRM
- 3.2
CMA / ARV
No comps found within radius.
Projected returns pro-forma
-3.0% appreciation · 3.72% rent growth · sell at horizon
- IRR
- 20.1%
- Equity multiple
- 1.83×
- Total profit
- $19,819
- Equity at exit
- $12,674
- IRR
- 29.3%
- Equity multiple
- 3.79×
- Total profit
- $66,373
- Equity at exit
- $7,349
Cash invested: $23,800 (down + closing). Projections, not guarantees.
Landlord ↔ Tenant lean methodology
- Overall (STATE)
- 87 Strongly Landlord-Friendly
- State Tennessee
- 87 Strongly Landlord-Friendly · R+13
- County
- — inherits STATE
- City
- — inherits STATE
ZIP-level market 37122
- Home prices YoY
- -30.1%
- Rents YoY
- 3.7%
- Active inventory
- 957
- Price-to-rent
- 3.2×
Monthly cashflow live
- Estimated rent
- $2,209 high interval (Pro) →
- Mortgage (P&I)
- −$446
- Tax from tax record
- −$19 /mo · $228/yr
- Insurance
- −$35
- HOA
- −$750
- Vacancy / Maint / Mgmt
- −$464
- Net cashflow
- $495
Break-even live
UW: 25.0% down · 7.5% · 30yr · 1.5% tax · 5.0% vac · 8.0% maint · 8.0% mgmt
Financing live
Cash to close
- Down payment
- $21,250
- Closing costs
- $2,550
- Reserves months
- —
- Total cash needed
- —
Loan-product check · same deal, 3 products live
Conventional
25% down · 7.5% · 30yr
- Down + closing
- —
- Monthly P&I
- —
- Monthly cashflow
- —
- DSCR
- —
- Eligible?
- —
Personal DTI + credit; lowest rate.
DSCR
20% down · 8.5% · 30yr
- Down + closing
- —
- Monthly P&I
- —
- Monthly cashflow
- —
- DSCR
- —
- Eligible?
- —
No personal income docs; deal must DSCR.
Hard money
10% down · 12.0% · 12mo
- Down + closing
- —
- Monthly P&I
- —
- Monthly cashflow
- —
- DSCR
- —
- Eligible?
- —
Short-term bridge; refi at stabilization.
Rent comps 7 comps
| Address | Beds | Baths | Sqft | Rent | $/sqft | DOM | Units | Dist |
|---|---|---|---|---|---|---|---|---|
| 120 Providence Trl Mount Juliet, TN | 1.0–3.0 | 1.0–2.0 | 1095 | $2,099 | $1.92 | 12d | 14 | 0.56mi |
| 2500 Aventura Dr Mount Juliet, TN | 1.0–3.0 | 1.0–2.0 | 1050 | $1,934 | $1.84 | 2d | 40 | 0.71mi |
| 1125 Westwood Blvd Mt. Juliet, TN | 1.0–2.0 | 1.0–2.5 | 1016 | $2,265 | $2.23 | 2d | 22 | 0.87mi |
| 2000 Buckhead Trl Mt. Juliet, TN | 1.0–2.0 | 1.0–2.0 | 931 | $1,899 | $2.04 | 43d | 17 | 0.90mi |
| 1001 Providence Pkwy Mt. Juliet, TN | 1.0–2.0 | 1.0–2.0 | 1025 | $1,914 | $1.87 | 3d | 18 | 0.96mi |
| 630 Providence Trl Mt. Juliet, TN | 1.0–3.0 | 1.0–2.0 | 1085 | $2,208 | $2.03 | 1d | 33 | 1.03mi |
| 4675 Old Lebanon Dirt Rd Mount Juliet, TN | 1.0–2.0 | 1.0–2.0 | 936 | $1,706 | $1.82 | 3d | 4 | 1.44mi |
HOA detail
- Monthly dues
- $750 · $9,000/yr
- Likely covers
- watersewertrashpool
Listing history 3 events
-
2026-06-01days on market $85,000 Active 35 DOM
-
2026-05-31days on market $85,000 Active 34 DOM
-
2026-04-28$85,000 Active 850-char remark
ⓘ Source: listings_history table (triggers on properties + properties_extension) + one-shot
backfill from property_details.listing_events for pre-trigger history.
Tax reassessment forecast TN · Resets to sale price
- Current annual tax
- $228 · $19/mo
- Projected year-2 tax
- $604 · $50/mo
- Expected delta
- +$376/yr (+$31/mo · 164.7%)
ⓘ Screening estimate from a state-policy table — verify with the county assessor before closing.
Climate risk First Street
- Flood 1/10 Low FEMA zone X (unshaded) · 0% chance over 30 yrs
- Wildfire 3/10 Moderate
- Heat 6/10 Major 7 d/yr ≥105°F today · 20 d/yr by 30 yrs out
- Wind 4/10 Moderate 8% chance of damaging wind over 30 yrs
- Air quality 3/10 Moderate 2 unhealthy d/yr today · 3 by 30 yrs out
Nearby sold comps map
Loading sold comps map…
Walkable amenities ~0.75 mi
Loading nearby amenities…
Taxation est. · year 1
- Rental income
- $26,512
- − Mortgage interest
- −$4,761
- − Property taxes
- −$228
- − Insurance
- −$425
- − Repairs & maintenance
- −$2,121
- − Management
- −$2,121
- − HOA
- −$9,000
- − Depreciation
- −$2,473
- Taxable income
- $5,383
- Est. tax owed @ 24.0%
- −$1,292
- After-tax cash flow
- $4,651/yr
For passive investors: Depreciation is non-cash, so a rental often shows a tax loss while cash-flowing — sheltering income. Rental losses are passive: they offset passive income freely, and up to $25,000/yr can offset ordinary (W-2) income if you actively participate and your MAGI is under $100k (phasing out to $0 by $150k); unused losses carry forward. On sale, claimed depreciation is recaptured at up to 25%, and gains may owe capital-gains tax (a 1031 exchange can defer both). Figures are a year-1 estimate at your 24.0% rate — not tax advice; consult a CPA.
Condition & rehab AI · 12 photos
This move-in ready manufactured home in Mount Juliet offers a good condition with modern finishes and low-maintenance living. A fresh coat of paint and updated flooring would significantly enhance its curb appeal and value.
Value-add opportunities
- Both Paint exterior — Enhances curb appeal and value
- Both Replace worn-out flooring — Improves aesthetics and functionality
- Both Update kitchen appliances — Modernizes the space and adds value
Renovation cost estimate screening
Value-add ROI direction
- Both Paint exterior — Enhances curb appeal and value ↑
- Both Replace worn-out flooring — Improves aesthetics and functionality ↑
- Both Update kitchen appliances — Modernizes the space and adds value ↑
ⓘ Cost ranges are severity-bucket heuristics (US national rule-of-thumb). Get contractor quotes + a written scope before underwriting a rehab budget.
Schools (NCES district)
- District
- Wilson County
- NCES district ID
- 4704550
- Math proficiency
- 42% ▼ -11.00%
- Reading proficiency
- 43% ▼ -4.00%
- Median HH income
- $68,429
- Composite
- 38.33/100
- National rank
- #4225
- State rank
- #10 of 139 in TN
Livability — Mount Juliet
- Score
- 71/100
- State rank
- #48
- US rank
- #7154
Category grades
Schools grade is shown separately in the Schools card above.
Census & demographics
- Census place
- Mount Juliet, TN
- County
- Wilson County · 144,921 people
- City population
- 68,492
- Metro
- Nashville-Davidson--Murfreesboro--Franklin, TN
- Population (ZIP)
- 68,492
- Household income
- $112,967
- Rent vs Own
- Severe rent burden
- 602.0
Population outlook (Wilson County) Hauer SSP2
- Today (2025)
- 160,409 people
- By 2030
- 176,099 · +9.8%
- By 2040
- 206,769 · +28.9%
- By 2050
- 235,383 · +46.7%
- By 2075
- 302,144 · +88.4%
- By 2100
- 343,710 · +114.3%
Race, ethnicity, and origin ACS 2023
- Neighborhood character
- Predominantly White (80%)
- Race & ethnicity
- White 80% Black 7% Hispanic / Latino 6% Two or more races 5% Asian 3%
- Hispanic origin (detail)
- Mexican 2% Puerto Rican 1%
- Common ancestry
- Slovak 3% Lithuanian 3% Italian 3%
- Foreign-born
- 7% · Canada, Jamaica
- Languages at home
- 90% English-only · Spanish 4% Arabic 1% Other Indo-European 1%
Political lean MEDSL · Wilson
- 2024 margin
- Solid R (+40.1) · D 29.4% · R 69.4% · Other 1.2%
- 2008→2024 swing
- -3.5pp toward R · 2008: -36.6pp · 2024: -40.1pp
- All cycles
- 2024: R+40.1 2020: R+37.7 2016: R+44.3 2012: R+41.6 2008: R+36.6
Not yet ingested
- Civics
- —
Market trends
- HPI YoY
- ▼ -131.85%
- Current HPI
- 306.1814
- Rent YoY
- ▲ 3.72%
- Metro
- Nashville-Davidson--Murfreesboro--Franklin, TN
- State GDP YoY
- ▲ 2.78%
- F500 in state
- 22
Industry mix (Fortune 500 HQ in TN)
| Industry | F500 HQs | Revenue |
|---|---|---|
| Healthcare | 3 | $91B |
|
||
| Retail | 3 | $72B |
|
||
| Transportation / Logistics | 1 | $88B |
|
||
| Paper / Packaging | 1 | $19B |
|
||
| Insurance | 1 | $13B |
|
||
| Energy | 1 | $12B |
|
||
Price history
2 events — show timeline
- 2026-06-01 Listing Removed — REALTRACS as Distributed by MLS Grid
- 2026-04-28 Listed $85,000 REALTRACS as Distributed by MLS Grid
Property tax history
-31.8%/yrLatest (2025): $228 · -31.8% YoY. Source: county tax records.
Cash-flow waterfall
monthlySold comps — $/sqft
last 12 mo · ≤1 miLoading sold comps…