117 Glenwood Rd · Glenwood Landing, NY
Flood risk 4/10 · Minor
- FEMA flood zone
- X (unshaded)
- Chance of flooding over 30 yrs
- 0.22%
- Est. flood insurance / yr
- $473 – $860
Fire risk 1/10 · Minimal
- Est. fire insurance / yr
- $691 – $1,283
Heat risk 6/10 · Moderate
- Hot days now (above 97°F)
- 7 days/yr
- Hot days in 30 yrs
- 16 days/yr
Wind risk 6/10 · Moderate
- Chance of severe wind over 30 yrs
- 59.0%
Air-quality risk 4/10 · Minor
- Unhealthy air days now
- 4 days/yr
- Unhealthy air days in 30 yrs
- 5 days/yr
Risk factors via First Street. Map © Google.
Why this score? — see what drove the D+ grade
The composite is a weighted blend of 9 inputs, each scored 0–100. Each bar is that input's sub-score; the figure is the points it added to the 100-point composite (weight × sub-score).
- ARV discount +15.0/15.0
- Appreciation +10.0/10.0
- Schools +7.9/10.0
- Cash flow +5.9/30.0
- Livability +3.5/5.0
- Rent growth +2.5/5.0
- Condition / age +2.5/5.0
- 1% rule +1.6/10.0
- DSCR +0.3/10.0
$850,000
🖨 Deal sheet 📄 Offer letter ✓ Due diligence
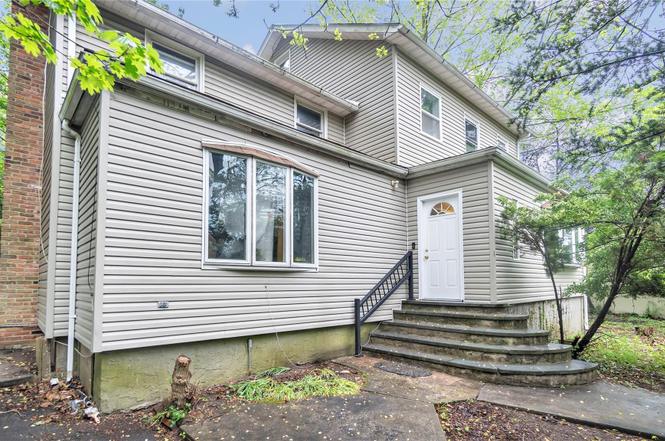
Listing remarks
Tucked away for ultimate privacy and set far back from the street, this hidden gem is just . 2 miles from the waterfront. Featuring 3 spacious bedrooms and 2 full baths (including an ensuite), the home offers both comfort and flexibility for a variety of lifestyles. Step inside to find vaulted ceilings and a semi-open floor plan, perfect for both everyday living and entertaining. The large living room boasts a convenient half bath and sliding doors that open to the backyard, seamlessly blending indoor and outdoor living. The property’s expansive depth and size must be seen in person to be fully appreciated. With generous front and back yards, there’s ample space for gardening, r
Key facts
- Large living room
- Semi-open floor plan
- Vaulted ceilings
Tags
Neighborhood map
What this means for you Summary
Snapshot
- This is a 4-bed/2.5-bath single-family listed at $850k.
Deal economics
- At list price, monthly cash flow is $-2k ($-20k/yr) — negative.
- To cash-flow at today's rent, offer at most $556k (34.6% below list).
- To meet the 1% rule (rent ≥ 1% of price), the offer needs to be $561k (34.0% below list).
- Recommended offer: $556k (34.6% below list) — sets the bar for cash-flow.
- Cap rate 3.9% vs local median 3.0% in Glenwood Landing — top-decile yield for the area; either an underpriced asset or a hidden risk that comps aren't pricing in. Stress-test before assuming the spread holds.
Location & tenants
- Location reads 70/100 on livability (#456 in NY) — a middle-class / working-renter tenant base. Strengths: crime A+, commute A+, employment A+; Watch: amenities F, cost of living F, health & safety F.
- North Shore Central School District (suburban): math 88% / reading 84% proficiency, ranked #24 of 590 in NY (top 4%) — strong family-tenant draw, lease renewals of 3-5y typical; only 5% free/reduced lunch — higher-income household profile.
- Zoned schools: Glenwood Landing Elementary School (math 87% / reading 82%, grade A+, #93 of 2,108 statewide, top 6%, 427 students, 0% FRL) — zoned schools at 0% FRL track the district average.
- Market conditions: 17 active listings in the ZIP; 3 comparable units currently listed for rent nearby; rentals at typical pace (median 25d on market — plan ~3-4 weeks tenant-placement turnaround); 824 units permitted in Nassau County in 2024 (153 in 5+ unit buildings).
Forward outlook
- In year one you build about $91k of equity ($6k loan paydown + $85k appreciation (10.0% local appreciation)).
- Nassau County population projected at +7% by 2050 — modest demand growth; plan on rents tracking national, not racing it.
- By year 2, paydown + projected appreciation supports a ~$146k cash-out refi (75% LTV) — recoverable capital for the next deal without selling this one.
Negotiation context
- It's been on market 120 days — a 9% lower offer ($774k) is reasonable based on typical stale-listing flexibility.
- 8 sale attempts since 2y ago; this cycle's ask has dropped $50k (6%) from the opening price — seller is motivated, your offer sets the floor, not the list.
- Current owner paid $426k; list at $850k implies a 99% gain — meaningful room to come down on a strong offer.
Risks & watch-outs
- Watch-outs: built in 1888 — expect roof / HVAC / electrical / plumbing capex.
- Climate carrying-cost: major wind risk, 59% chance of damaging wind over 30y; extreme-heat days projected 7→16/yr by 2055 (HVAC capex compounding) — expect insurance premiums to compound above CPI over the hold.
Questions for the listing agent
- What do current leases actually rent for vs. the listed asking? Can we see a recent rent roll and the last 12 months of T-12 income?
- It's been on market 120 days. Have you received any prior offers? Is the seller open to a 35% concession, seller financing, or rate buy-down credit?
- Built in 1888 — when were the roof, HVAC, electrical panel, plumbing, and water heater last replaced?
- Why hasn't it sold? Are there any deal-killer items the seller is aware of (foundation, flood, title, zoning, code violations)?
- Is there a deadline driving the sale (1031 exchange, divorce, estate, relocation)? That informs how much negotiation room exists.
- Schools are A-rated — typically a magnet for longer-tenancy family renters. What's the average tenant stay here, and is there a school-zone premium baked into asking?
- The area grade is low — what's the realistic commute time and amenity access for the typical tenant pool here? Any planned neighborhood developments (good or bad) we should know about?
- What's the average days-on-market for RENTAL listings here right now (not sales)? A rising rental-DOM trend means longer vacancies and softer asking-rent achievability than the comps imply.
- What's the recent tenant-quality profile in this submarket — average credit score on applications, eviction rate, late-payment / NSF rate, and stable-employment percentage? A property-management company in the area should have these aggregated.
- How much new for-sale + rental construction is in the pipeline within 1–3 miles? Heavy new supply typically softens prices + rents 12–24 months out; constrained supply supports both.
Investment metrics
- 1% rule
- 0.66% ✗
- Cap rate
- 3.94%
- Cash-on-cash
- -8.40%
- DSCR
- 0.63
- GRM
- 12.6
CMA / ARV
- ARV (on-the-fly)
- $1,089,836
- Comps found
- 12
Show comp detail 12 sales within ~0.75 mi
| Address | Dist | Beds/Ba | Sqft | Sold | Price | $/sf | Match |
|---|---|---|---|---|---|---|---|
| 117 Glenwood Rd | 0.00mi | 4/2.0 | 2,108 (0%) | 1mo | $780,000 | $370 | 97 |
| 1 Glen Ln | 0.03mi | 5/2.0 (+1) | 2,296 (+9%) | 5mo | $1,085,000 | $473 | 72 |
| 1 William St | 0.48mi | 4/2.0 | 2,036 (-3%) | 5mo | $875,000 | $430 | 66 |
| 11 Maple St | 0.26mi | 4/2.5 | 2,420 (+15%) | 4mo | $1,430,000 | $591 | 60 |
| 21 Orchard St | 0.55mi | 3/1.5 (-1) | 2,100 (-0%) | 8mo | $1,200,000 | $571 | 58 |
| 98 Glenwood Rd | 0.17mi | 3/2.0 (-1) | 1,959 (-7%) | 18mo | $820,000 | $419 | 58 |
| 20 Waverly St | 0.40mi | 3/1.5 (-1) | 2,012 (-5%) | 16mo | $1,170,000 | $582 | 52 |
| 14 Washington Ave | 0.70mi | 5/4.0 (+1) | 2,140 (+2%) | 12mo | $1,030,000 | $481 | 44 |
| 48 Smith St | 0.44mi | 5/3.0 (+1) | 2,387 (+13%) | 15mo | $1,070,000 | $448 | 38 |
| 15 Smith St | 0.64mi | 4/2.0 | 1,873 (-11%) | 19mo | $969,000 | $517 | 34 |
| 7 Dogwood Ln | 0.61mi | 4/2.5 | 2,376 (+13%) | 21mo | $1,240,000 | $522 | 33 |
| 43 Scudders Ln | 0.66mi | 3/2.0 (-1) | 1,793 (-15%) | 10mo | $985,000 | $549 | 29 |
Match score weights: distance 35% · size 25% · config 20% · recency 20%. Top-matched comps best support the ARV.
Projected returns pro-forma
10.0% appreciation · 3.0% rent growth · sell at horizon
- IRR
- 18.4%
- Equity multiple
- 2.50×
- Total profit
- $357,105
- Equity at exit
- $765,747
- IRR
- 17.1%
- Equity multiple
- 5.77×
- Total profit
- $1,135,458
- Equity at exit
- $1,651,363
Cash invested: $238,000 (down + closing). Projections, not guarantees.
Landlord ↔ Tenant lean methodology
- Overall (STATE)
- 15 Strongly Tenant-Friendly
- State New York
- 15 Strongly Tenant-Friendly · D+10
- County
- — inherits STATE
- City
- — inherits STATE
ZIP-level market 11547
- Home prices YoY
- 3.8%
- Active inventory
- 17
- Price-to-rent
- 12.6×
Monthly cashflow live
- Estimated rent
- $5,614 medium interval (Pro) →
- Mortgage (P&I)
- −$4,457
- Tax from tax record
- −$1,289 /mo · $15,462/yr
- Insurance
- −$354
- HOA
- −$0
- Vacancy / Maint / Mgmt
- −$1,179
- Net cashflow
- $-1,665
Break-even live
UW: 25.0% down · 7.5% · 30yr · 1.5% tax · 5.0% vac · 8.0% maint · 8.0% mgmt
Financing live
Cash to close
- Down payment
- $212,500
- Closing costs
- $25,500
- Reserves months
- —
- Total cash needed
- —
Loan-product check · same deal, 3 products live
Conventional
25% down · 7.5% · 30yr
- Down + closing
- —
- Monthly P&I
- —
- Monthly cashflow
- —
- DSCR
- —
- Eligible?
- —
Personal DTI + credit; lowest rate.
DSCR
20% down · 8.5% · 30yr
- Down + closing
- —
- Monthly P&I
- —
- Monthly cashflow
- —
- DSCR
- —
- Eligible?
- —
No personal income docs; deal must DSCR.
Hard money
10% down · 12.0% · 12mo
- Down + closing
- —
- Monthly P&I
- —
- Monthly cashflow
- —
- DSCR
- —
- Eligible?
- —
Short-term bridge; refi at stabilization.
Rent comps 3 comps
| Address | Beds | Baths | Sqft | Rent | $/sqft | DOM | Units | Dist |
|---|---|---|---|---|---|---|---|---|
| 36 Coolidge Ave Glen Head, NY | 3.0 | 1.0 | 1410 | $4,600 | $3.26 | 24d | 1 | 0.77mi |
| 14 Harbor Ln Glen Head, NY | 4.0 | 2.0 | 2115 | $7,100 | $3.36 | 1d | 1 | 0.90mi |
| 20 Alex Ln Unit 2 Glen Cove, NY | 3.0 | 2.0 | 1407 | $4,000 | $2.84 | 44d | 1 | 1.40mi |
Listing history 22 events
-
2025-12-03status Pending
-
2025-10-15price $850,000
-
2025-08-04$900,000 Active
-
2025-07-25historical
-
2025-07-16historical $4,800
-
2025-07-11price $948,000
-
2025-06-18$988,000 Active
-
2025-05-26$4,800
-
2025-05-22historical $4,800
-
2025-05-13$4,800
-
2025-03-10historical $4,995
-
2025-02-05price $4,995
-
2025-01-29$5,700
-
2024-12-12historical $4,650
-
2024-11-26$4,650
-
2024-11-26historical $4,650
-
2024-09-24$4,650
-
2024-09-05historical $4,650
-
2024-09-02$4,650
-
2001-12-12soldstatus $426,500
-
2000-08-16soldstatus $298,000
-
1990-10-09soldstatus $340,000
ⓘ Source: listings_history table (triggers on properties + properties_extension) + one-shot
backfill from property_details.listing_events for pre-trigger history.
Tax reassessment forecast NY · Partial reset (capped growth)
- Current annual tax
- $15,462 · $1,289/mo
- Projected year-2 tax
- $15,462 · $1,289/mo
- Expected delta
- $0/yr ($0/mo · 0.0%)
ⓘ Screening estimate from a state-policy table — verify with the county assessor before closing.
Climate risk First Street
- Flood 4/10 Moderate FEMA zone X (unshaded) · 22% chance over 30 yrs
- Wildfire 1/10 Low
- Heat 6/10 Major 7 d/yr ≥97°F today · 16 d/yr by 30 yrs out
- Wind 6/10 Major 59% chance of damaging wind over 30 yrs
- Air quality 4/10 Moderate 4 unhealthy d/yr today · 5 by 30 yrs out
Nearby sold comps map
Loading sold comps map…
Walkable amenities ~0.75 mi
Loading nearby amenities…
Taxation est. · year 1
- Rental income
- $67,368
- − Mortgage interest
- −$47,613
- − Property taxes
- −$15,462
- − Insurance
- −$4,250
- − Repairs & maintenance
- −$5,389
- − Management
- −$5,389
- − Depreciation
- −$24,727
- Taxable loss
- −$35,463
- Est. tax savings @ 24.0%
- +$8,511
- After-tax cash flow
- $-11,470/yr
For passive investors: Depreciation is non-cash, so a rental often shows a tax loss while cash-flowing — sheltering income. Rental losses are passive: they offset passive income freely, and up to $25,000/yr can offset ordinary (W-2) income if you actively participate and your MAGI is under $100k (phasing out to $0 by $150k); unused losses carry forward. On sale, claimed depreciation is recaptured at up to 25%, and gains may owe capital-gains tax (a 1031 exchange can defer both). Figures are a year-1 estimate at your 24.0% rate — not tax advice; consult a CPA.
Schools (NCES district)
- District
- North Shore Central School District
- NCES district ID
- 3626370
- Math proficiency
- 88% ▼ -3.00%
- Reading proficiency
- 84% ▼ -2.00%
- Median HH income
- $113,973
- Composite
- 78.77/100
- National rank
- #69
- State rank
- #24 of 590 in NY
Livability — Glenwood Landing
- Score
- 70/100
- State rank
- #456
- US rank
- #7971
Category grades
Schools grade is shown separately in the Schools card above.
Census & demographics
- Census place
- Glenwood Landing, NY
- City population
- 788
- Population (ZIP)
- 788
Population outlook (Nassau County) Hauer SSP2
- Today (2025)
- 1,409,302 people
- By 2030
- 1,431,482 · +1.6%
- By 2040
- 1,471,607 · +4.4%
- By 2050
- 1,502,845 · +6.6%
- By 2075
- 1,575,403 · +11.8%
- By 2100
- 1,554,356 · +10.3%
Race, ethnicity, and origin ACS 2023
- Neighborhood character
- Predominantly White (91%)
- Race & ethnicity
- White 91% Asian 6% Hispanic / Latino 3% Two or more races 3%
- Common ancestry
- Scotch-Irish 2% Italian 1%
- Foreign-born
- 9% · China
- Languages at home
- 87% English-only · German/W. Germanic 5% Other Indo-European 4% Spanish 3%
Political lean MEDSL · Nassau
- 2024 margin
- Toss-up / Even · D 47.9% · R 52.1%
- 2008→2024 swing
- -12.6pp toward R · 2008: 8.4pp · 2024: -4.2pp
- All cycles
- 2024: R+4.2 2020: D+9.5 2016: D+5.3 2012: D+6.7 2008: D+8.4
Not yet ingested
- Civics
- —
Market trends
- HPI YoY
- ▲ 12.03%
- Current HPI
- 329.8977
- Rent YoY
- —
- Metro
- —
- State GDP YoY
- ▲ 2.60%
- F500 in state
- 92
Industry mix (Fortune 500 HQ in NY)
| Industry | F500 HQs | Revenue |
|---|---|---|
| Financial Services | 10 | $950B |
|
||
| Consumer Goods | 9 | $162B |
|
||
| Insurance | 4 | $225B |
|
||
| Telecommunications | 2 | $144B |
|
||
| Pharmaceuticals | 2 | $112B |
|
||
| Media / Entertainment | 2 | $69B |
|
||
Price history
+150.0% since first listed22 events — show timeline
- 2025-12-03 Pending — OneKey® MLS as Distributed by MLS Grid
- 2025-10-15 Price Changed $850,000 OneKey® MLS as Distributed by MLS Grid
- 2025-08-04 Listed $900,000 OneKey® MLS as Distributed by MLS Grid
- 2025-07-25 Listing Removed — OneKey® MLS as Distributed by MLS Grid
- 2025-07-16 Rental Removed $4,800 ONEKEY
- 2025-07-11 Price Changed $948,000 OneKey® MLS as Distributed by MLS Grid
- 2025-06-18 Listed $988,000 OneKey® MLS as Distributed by MLS Grid
- 2025-05-26 Listed for Rent $4,800 ONEKEY
- 2025-05-22 Rental Removed $4,800 ONEKEY
- 2025-05-13 Listed for Rent $4,800 ONEKEY
- 2025-03-10 Rental Removed $4,995 ONEKEY
- 2025-02-05 Price Changed $4,995 ONEKEY
- 2025-01-29 Listed for Rent $5,700 ONEKEY
- 2024-12-12 Rental Removed $4,650 ONEKEY
- 2024-11-26 Listed for Rent $4,650 ONEKEY
- 2024-11-26 Rental Removed $4,650 ONEKEY
- 2024-09-24 Listed for Rent $4,650 ONEKEY
- 2024-09-05 Rental Removed $4,650 ONEKEY
- 2024-09-02 Listed for Rent $4,650 ONEKEY
- 2001-12-12 Sold (Public Records) $426,500 Public Records
- 2000-08-16 Sold (Public Records) $298,000 Public Records
- 1990-10-09 Sold (Public Records) $340,000 Public Records
Property tax history
+3.8%/yrLatest (2024): $15,462 · -0.1% YoY. Source: county tax records.
Cash-flow waterfall
monthlySold comps — $/sqft
last 12 mo · ≤1 miLoading sold comps…