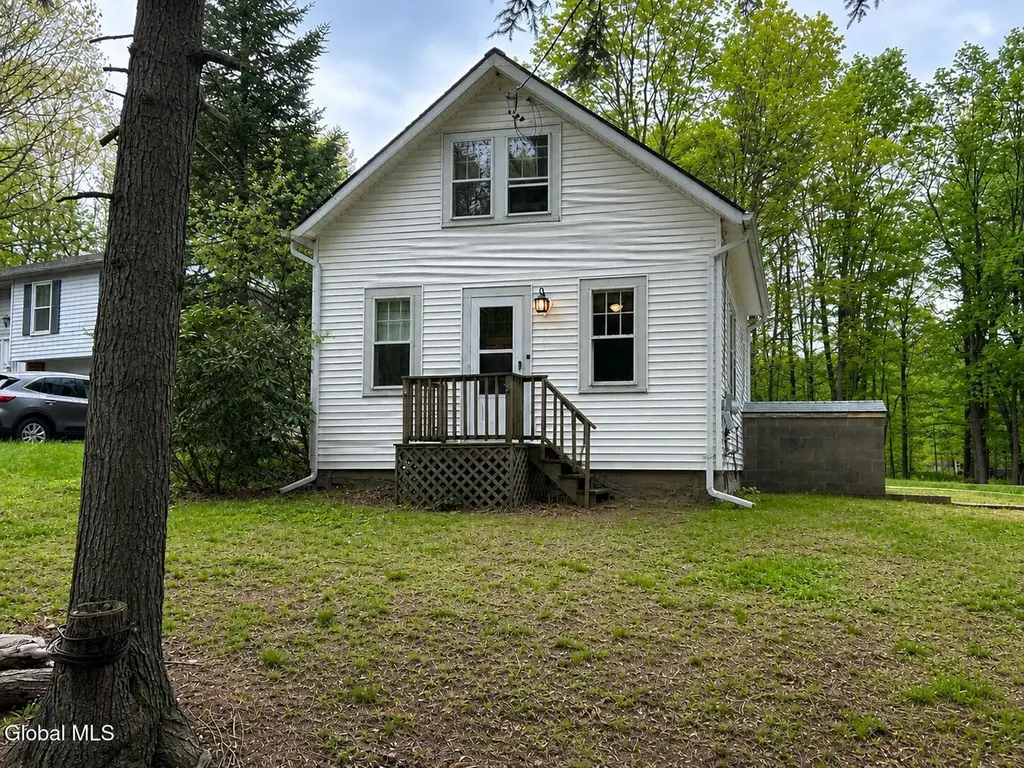
148 Elliot Rd · East Greenbush, NY
Flood risk 1/10 · Minimal
- FEMA flood zone
- X
- Chance of flooding over 30 yrs
- 0.0%
- Est. flood insurance / yr
- $473 – $860
Fire risk 5/10 · Moderate
- Est. fire insurance / yr
- $691 – $1,283
Heat risk 3/10 · Minor
- Hot days now (above 96°F)
- 7 days/yr
- Hot days in 30 yrs
- 15 days/yr
Wind risk 3/10 · Minor
- Chance of severe wind over 30 yrs
- 6.0%
Air-quality risk 2/10 · Minimal
- Unhealthy air days now
- 0 days/yr
- Unhealthy air days in 30 yrs
- 1 days/yr
Risk factors via First Street. Map © Google.
Why this score? — see what drove the C- grade
The composite is a weighted blend of 9 inputs, each scored 0–100. Each bar is that input's sub-score; the figure is the points it added to the 100-point composite (weight × sub-score).
- ARV discount +15.0/15.0
- Cash flow +14.2/30.0
- Schools +6.1/10.0
- 1% rule +4.9/10.0
- DSCR +4.3/10.0
- Livability +3.8/5.0
- Rent growth +2.5/5.0
- Condition / age +2.5/5.0
- Appreciation +0.0/10.0
$199,900
🖨 Deal sheet 📄 Offer letter ✓ Due diligence
Listing remarks MLS
QUAINT HOME WITH CHARM AND CHARACTER.DEEP LOT. HARDWOOD FLOORS THROUGHOUT. A LITTLE TLC-NEEDED INSIDE- NEW HW FLOORS, HW TANK, ROOF 3 YRS, FURNACE 2 YEARS. CALL L.A 448-5946. Good Condition
Key facts
- Generous lot
- Newer roof
- Ample parking
Tags
Property features AI
Exterior
- Parking: Off-street parking and driveway; Total of about 10 parking spaces
- Utilities: Public sewer
- Home design: Single family residence; Vinyl siding construction; Shingle/asphalt roof; Lot about 0.34 acre (approx. 85 x 220)
- Construction: Vinyl siding; Shingle/asphalt roof; Unfinished basement (walk-out) - exterior and interior entry
- Exterior features: Rear porch (enclosed back porch / mud room); Paved driveway; Exterior lighting; Shed(s)
Interior
- Kitchen: Oven; Refrigerator
- Bedrooms: First-floor bedroom; Second-floor bedroom
- Flooring: Hardwood flooring
- Bathrooms: One full bathroom on the first floor
- Heating & cooling: Forced air heating; Oil heating
- Interior features: High speed internet; Unfinished walk-out basement with interior and exterior entry
- Laundry & utility: Washer and dryer located in the basement
Neighborhood map
What this means for you Summary
Snapshot
- This is a 2-bed/1.0-bath single-family listed at $200k.
Deal economics
- At list price, monthly cash flow is $34 ($412/yr) — positive.
- The deal already cash-flows at list — no discount required.
- To meet the 1% rule (rent ≥ 1% of price), the offer needs to be $197k (1.5% below list).
- Recommended offer: $197k (1.5% below list) — sets the bar for 1% rule.
- Cap rate 6.5% vs local median 3.0% in East Greenbush — top-decile yield for the area; either an underpriced asset or a hidden risk that comps aren't pricing in. Stress-test before assuming the spread holds.
Location & tenants
- Location reads 76/100 on livability (#233 in NY, #3,674 nationally) — a middle-class / working-renter tenant base. Strengths: employment A+, housing A+, health & safety A+; Watch: amenities F, commute F, cost of living D-.
- East Greenbush Central School District (suburban): math 68% / reading 71% proficiency, ranked #132 of 590 in NY (top 22%) — acceptable for families but not a draw, mixed tenant base, ~2y average lease; only 15% free/reduced lunch — higher-income household profile.
- Zoned schools: Columbia High School (math 97% / reading 87%, grade A+, #171 of 1,100 statewide, top 18%, 1,252 students, 27% FRL).
- Zoned-school proficiency averages 92% at this address vs 70% district-wide (+22 pts) — the actual schools serving this property are materially stronger than the East Greenbush Central School District average implies; a family-tenant draw the district grade alone would hide.
- Market conditions: 44 active listings in the ZIP; 4 comparable units currently listed for rent nearby; rentals at typical pace (median 24d on market — plan ~3-4 weeks tenant-placement turnaround); 405 units permitted in Rensselaer County in 2024 (224 in 5+ unit buildings).
Forward outlook
- Local home prices are declining (-3.0%/yr); year-one equity from $1k of loan paydown is wiped out by about $6k of value loss. Plan a longer hold.
- Rensselaer County population projected to shrink 6% by 2050 — rents likely to lag national; underwrite the cash flow, not the appreciation.
Negotiation context
- Only 3 days on market — expect competitive offers; lowballing is unlikely to land.
- 2 sale attempts since 23y ago with the ask held roughly flat each time — persistent listings suggest the price (not the market) is what's stuck; bring a comps-based counter.
- Current owner paid $62k; list at $200k implies a 220% gain — meaningful room to come down on a strong offer.
Risks & watch-outs
- Watch-outs: built in 1930 — expect roof / HVAC / electrical / plumbing capex.
- Climate carrying-cost: moderate wildfire risk — expect insurance premiums to compound above CPI over the hold.
Questions for the listing agent
- Built in 1930 — when were the roof, HVAC, electrical panel, plumbing, and water heater last replaced?
- Is there a deadline driving the sale (1031 exchange, divorce, estate, relocation)? That informs how much negotiation room exists.
- Schools are A-rated — typically a magnet for longer-tenancy family renters. What's the average tenant stay here, and is there a school-zone premium baked into asking?
- What's the average days-on-market for RENTAL listings here right now (not sales)? A rising rental-DOM trend means longer vacancies and softer asking-rent achievability than the comps imply.
- What's the recent tenant-quality profile in this submarket — average credit score on applications, eviction rate, late-payment / NSF rate, and stable-employment percentage? A property-management company in the area should have these aggregated.
- How much new for-sale + rental construction is in the pipeline within 1–3 miles? Heavy new supply typically softens prices + rents 12–24 months out; constrained supply supports both.
Investment metrics
- 1% rule
- 0.99% ✗
- Cap rate
- 6.50%
- Cash-on-cash
- 0.74%
- DSCR
- 1.03
- GRM
- 8.5
CMA / ARV
- ARV (median comp)
- $253,907
- List price
- $199,900
- Delta
- -21.27%
- Verdict
- UNDERPRICED
- Comps
- 6 within 1.0 mi
Show comp detail 2 sales within ~0.75 mi
| Address | Dist | Beds/Ba | Sqft | Sold | Price | $/sf | Match |
|---|---|---|---|---|---|---|---|
| 181 Elliot Rd | 0.15mi | 2/1.0 | 882 (+9%) | 11mo | $265,000 | $300 | 69 |
| 85 Elliot Rd | 0.29mi | 3/1.0 (+1) | 864 (+6%) | 21mo | $250,000 | $289 | 53 |
Match score weights: distance 35% · size 25% · config 20% · recency 20%. Top-matched comps best support the ARV.
Projected returns pro-forma
-3.0% appreciation · 3.0% rent growth · sell at horizon
- IRR
- -15.1%
- Equity multiple
- 0.46×
- Total profit
- $-30,089
- Equity at exit
- $29,806
- IRR
- -6.4%
- Equity multiple
- 0.59×
- Total profit
- $-22,913
- Equity at exit
- $17,284
Cash invested: $55,972 (down + closing). Projections, not guarantees.
Landlord ↔ Tenant lean methodology
- Overall (STATE)
- 15 Strongly Tenant-Friendly
- State New York
- 15 Strongly Tenant-Friendly · D+10
- County
- — inherits STATE
- City
- — inherits STATE
ZIP-level market 12061
- Home prices YoY
- -22.2%
- Active inventory
- 44
- Price-to-rent
- 8.5×
Monthly cashflow live
- Estimated rent
- $1,970 medium interval (Pro) →
- Mortgage (P&I)
- −$1,048
- Tax from tax record
- −$390 /mo · $4,682/yr
- Insurance
- −$83
- HOA
- −$0
- Vacancy / Maint / Mgmt
- −$414
- Net cashflow
- $34
Break-even live
UW: 25.0% down · 7.5% · 30yr · 1.5% tax · 5.0% vac · 8.0% maint · 8.0% mgmt
Financing live
Cash to close
- Down payment
- $49,975
- Closing costs
- $5,997
- Reserves months
- —
- Total cash needed
- —
Loan-product check · same deal, 3 products live
Conventional
25% down · 7.5% · 30yr
- Down + closing
- —
- Monthly P&I
- —
- Monthly cashflow
- —
- DSCR
- —
- Eligible?
- —
Personal DTI + credit; lowest rate.
DSCR
20% down · 8.5% · 30yr
- Down + closing
- —
- Monthly P&I
- —
- Monthly cashflow
- —
- DSCR
- —
- Eligible?
- —
No personal income docs; deal must DSCR.
Hard money
10% down · 12.0% · 12mo
- Down + closing
- —
- Monthly P&I
- —
- Monthly cashflow
- —
- DSCR
- —
- Eligible?
- —
Short-term bridge; refi at stabilization.
Rent comps 4 comps
| Address | Beds | Baths | Sqft | Rent | $/sqft | DOM | Units | Dist |
|---|---|---|---|---|---|---|---|---|
| 100 Horizon View Dr East Greenbush, NY | 1.0–2.0 | 1.0–2.0 | 915 | $1,919 | $2.10 | 14d | 1 | 0.75mi |
| 4 Horizon View Dr W Unit 3 East Greenbush, NY | 2.0 | 1.0 | 1000 | $18,250 | $18.25 | 23d | 1 | 0.88mi |
| 15 Forrest Dr Rensselaer, NY | 1.0 | 1.0 | 600 | $1,300 | $2.17 | 43d | 1 | 1.21mi |
| 1 Forrest Pointe Dr East Greenbush, NY | 1.0–2.0 | 1.0–2.0 | 1193 | $2,889 | $2.42 | 14d | 1 | 1.34mi |
Listing history 4 events
-
2026-05-09status Pending 696-char remark
-
2026-05-06$199,900 Active 696-char remark
-
2003-02-28soldstatus $62,500 189-char remark
Show marketing remark (189 chars)
QUAINT HOME WITH CHARM AND CHARACTER.DEEP LOT. HARDWOOD FLOORS THROUGHOUT. A LITTLE TLC-NEEDED INSIDE- NEW HW FLOORS, HW TANK, ROOF 3 YRS, FURNACE 2 YEARS. CALL L.A 448-5946. Good Condition
-
2003-01-26$64,900 189-char remark
Show marketing remark (189 chars)
QUAINT HOME WITH CHARM AND CHARACTER.DEEP LOT. HARDWOOD FLOORS THROUGHOUT. A LITTLE TLC-NEEDED INSIDE- NEW HW FLOORS, HW TANK, ROOF 3 YRS, FURNACE 2 YEARS. CALL L.A 448-5946. Good Condition
ⓘ Source: listings_history table (triggers on properties + properties_extension) + one-shot
backfill from property_details.listing_events for pre-trigger history.
Tax reassessment forecast NY · Partial reset (capped growth)
- Current annual tax
- $4,682 · $390/mo
- Projected year-2 tax
- $4,682 · $390/mo
- Expected delta
- $0/yr ($0/mo · 0.0%)
ⓘ Screening estimate from a state-policy table — verify with the county assessor before closing.
Climate risk First Street
- Flood 1/10 Low FEMA zone X · 0% chance over 30 yrs
- Wildfire 5/10 Major
- Heat 3/10 Moderate 7 d/yr ≥96°F today · 15 d/yr by 30 yrs out
- Wind 3/10 Moderate 6% chance of damaging wind over 30 yrs
- Air quality 2/10 Low 0 unhealthy d/yr today · 1 by 30 yrs out
Nearby sold comps map
Loading sold comps map…
Walkable amenities ~0.75 mi
Loading nearby amenities…
Taxation est. · year 1
- Rental income
- $23,637
- − Mortgage interest
- −$11,198
- − Property taxes
- −$4,682
- − Insurance
- −$1,000
- − Repairs & maintenance
- −$1,891
- − Management
- −$1,891
- − Depreciation
- −$5,815
- Taxable loss
- −$2,839
- Est. tax savings @ 24.0%
- +$681
- After-tax cash flow
- $1,094/yr
For passive investors: Depreciation is non-cash, so a rental often shows a tax loss while cash-flowing — sheltering income. Rental losses are passive: they offset passive income freely, and up to $25,000/yr can offset ordinary (W-2) income if you actively participate and your MAGI is under $100k (phasing out to $0 by $150k); unused losses carry forward. On sale, claimed depreciation is recaptured at up to 25%, and gains may owe capital-gains tax (a 1031 exchange can defer both). Figures are a year-1 estimate at your 24.0% rate — not tax advice; consult a CPA.
Schools (NCES district)
- District
- East Greenbush Central School District
- NCES district ID
- 3609630
- Math proficiency
- 68% ▼ -5.00%
- Reading proficiency
- 71% ▲ 2.00%
- Median HH income
- $73,174
- Composite
- 61.16/100
- National rank
- #783
- State rank
- #132 of 590 in NY
Livability — East Greenbush
- Score
- 76/100
- State rank
- #233
- US rank
- #3674
Category grades
Schools grade is shown separately in the Schools card above.
Census & demographics
- Census place
- East Greenbush, NY
- Population (ZIP)
- 9,778
Population outlook (Rensselaer County) Hauer SSP2
- Today (2025)
- 162,400 people
- By 2030
- 161,746 · -0.4%
- By 2040
- 158,095 · -2.7%
- By 2050
- 152,966 · -5.8%
- By 2075
- 140,767 · -13.3%
- By 2100
- 124,727 · -23.2%
Race, ethnicity, and origin ACS 2023
- Neighborhood character
- Predominantly White (84%)
- Race & ethnicity
- White 84% Hispanic / Latino 8% Two or more races 5% Asian 5% Black 3%
- Hispanic origin (detail)
- Puerto Rican 4% Dominican 2%
- Common ancestry
- Romanian 6% Lithuanian 5% Iranian 4%
- Foreign-born
- 9% · Canada, China
- Languages at home
- 89% English-only · Spanish 4% Other Indo-European 3% Other Asian/Pacific 2%
Political lean MEDSL · Rensselaer
- 2024 margin
- Toss-up / Even · D 50.7% · R 49.3%
- 2008→2024 swing
- -8.0pp toward R · 2008: 9.3pp · 2024: 1.4pp
- All cycles
- 2024: D+1.4 2020: D+5.6 2016: R+2.9 2012: D+11.8 2008: D+9.3
Not yet ingested
- Civics
- —
Market trends
- HPI YoY
- ▼ -75.49%
- Current HPI
- 265.2112
- Rent YoY
- —
- Metro
- —
- State GDP YoY
- ▲ 2.60%
- F500 in state
- 92
Industry mix (Fortune 500 HQ in NY)
| Industry | F500 HQs | Revenue |
|---|---|---|
| Financial Services | 10 | $950B |
|
||
| Consumer Goods | 9 | $162B |
|
||
| Insurance | 4 | $225B |
|
||
| Telecommunications | 2 | $144B |
|
||
| Pharmaceuticals | 2 | $112B |
|
||
| Media / Entertainment | 2 | $69B |
|
||
Price history
+208.0% since first listed4 events — show timeline
- 2026-05-09 Pending — Global MLS
- 2026-05-06 Listed $199,900 Global MLS
- 2003-02-28 Sold (MLS) $62,500 Global MLS
- 2003-01-26 Listed $64,900 Global MLS
Property tax history
+5.1%/yrLatest (2025): $4,682 · -17.3% YoY. Source: county tax records.
Cash-flow waterfall
monthlySold comps — $/sqft
last 12 mo · ≤1 miLoading sold comps…