226 Meadows Rd S · Bourbonnais, IL
Flood risk 1/10 · Minimal
- FEMA flood zone
- X (unshaded)
- Chance of flooding over 30 yrs
- 0.0%
- Est. flood insurance / yr
- $473 – $860
Fire risk 1/10 · Minimal
- Est. fire insurance / yr
- $804 – $1,492
Heat risk 3/10 · Minor
- Hot days now (above 104°F)
- 7 days/yr
- Hot days in 30 yrs
- 16 days/yr
Wind risk 2/10 · Minimal
- Chance of severe wind over 30 yrs
- 1.0%
Air-quality risk 2/10 · Minimal
- Unhealthy air days now
- 1 days/yr
- Unhealthy air days in 30 yrs
- 1 days/yr
Risk factors via First Street. Map © Google.
Why this score? — see what drove the C grade
The composite is a weighted blend of 9 inputs, each scored 0–100. Each bar is that input's sub-score; the figure is the points it added to the 100-point composite (weight × sub-score).
- Cash flow +20.4/30.0
- ARV discount +15.0/15.0
- 1% rule +6.5/10.0
- DSCR +6.5/10.0
- Livability +3.5/5.0
- Rent growth +2.5/5.0
- Condition / age +2.5/5.0
- Schools +1.8/10.0
- Appreciation +0.0/10.0
$206,000
🖨 Deal sheet (PDF) 📄 Offer letter ✓ Due diligence
Listing remarks
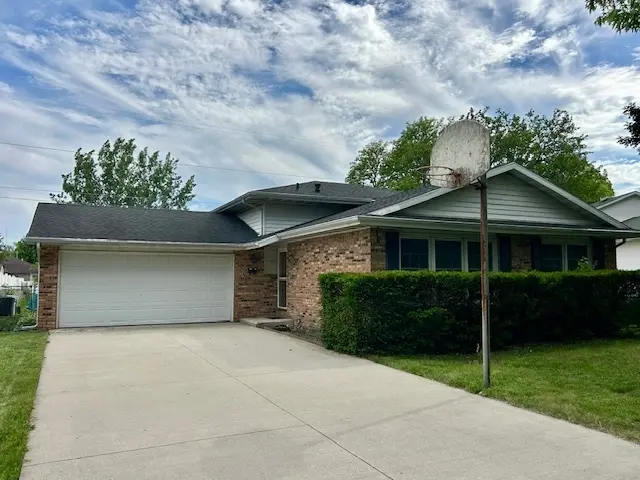
Located in the sought-after Village Meadows subdivision in Bourbonnais, this 4-bedroom, 1.5-bath tri-level offers plenty of space for comfortable living. Over the past 10+ years, several major updates have been completed, including the roof and windows, while the furnace and central air have been updated within the last 15 years. The functional floor plan provides multiple living areas, giving everyone room to spread out. Enjoy the fenced backyard, perfect for pets, play, or entertaining, along with a 2.5-car attached garage offering ample storage and parking. Being sold AS-IS, this home presents a great opportunity to make it your own in a well-established neighborhood. Call today to sched
Key facts
- Attached garage
- Fenced backyard
- 2 garage spots
Tags
Property features AI
Finance
- Other: School bus service available; Directions: Route 45 to Meadows North to Meadows South to home
- HOA & community: No master association fee required; Community features include sidewalks
Exterior
- Parking: Attached garage; Garage with concrete surface and garage door opener; Garage owned; about 2.5 garage/parking spaces (total 2.5)
- Utilities: Public water; Public sewer; Cable available
- Home design: Detached single-family home; Tri-level / 3-story configuration; Fee simple ownership; Built before 1978
- Construction: Vinyl siding with brick accents; Asphalt roof; Concrete perimeter foundation; Estimated age 41–50 years
- Exterior features: Mature trees on lot; Fenced yard; Sidewalks in the community; Lot dimensions approximately 65 x 154.7 x 60 x 165.98
Interior
- Kitchen: Eating area / table space; Pantry-closet; Tile flooring; Range; Refrigerator
- Bedrooms: Four bedrooms total; Master bedroom on second level (12 x 15) with carpet; Bedroom 2 on second level (10 x 12) with carpet; Bedroom 3 on second level (10 x 11) with carpet; Bedroom 4 on lower level (11 x 10) with vinyl flooring
- Flooring: Laminate flooring in living area; Carpet in multiple bedrooms and master; Vinyl flooring in lower-level rooms; Tile in kitchen
- Bathrooms: One full bathroom; One half bathroom
- Heating & cooling: Natural gas heating with forced air; Central air conditioning
- Interior features: Seven total rooms; Storm door(s); Screens and window treatments with drapes; Insulated windows; Crawl space basement
- Laundry & utility: Lower-level laundry room (5 x 6); Washer; Dryer
Neighborhood map
What this means for you Summary
Snapshot
- This is a 4-bed/1.5-bath single-family listed at $206k.
Deal economics
- At list price, monthly cash flow is $269 ($3k/yr) — positive.
- The deal already cash-flows at list — no discount required.
- Meets the 1% rule at list price ($2k rent vs $206k).
- Cap rate 7.9% vs local median 4.0% in Bourbonnais — top-decile yield for the area; either an underpriced asset or a hidden risk that comps aren't pricing in. Stress-test before assuming the spread holds.
Location & tenants
- Location reads 70/100 on livability (#362 in IL) — a middle-class / working-renter tenant base. Strengths: crime A+, cost of living A+, housing A+; Watch: amenities F, commute F.
- Bradley Bourbonnais Chsd 307 (suburban): math 15% / reading 24% proficiency, ranked #413 of 620 in IL (top 67%) — low school quality limits family demand, transient renter base, plan for 1-2y turnover.
- Zoned schools: Shabbona Elem School (math 34% / reading 24%, grade F, #658 of 2,056 statewide, top 35%, 264 students, 0% FRL); Liberty Intermediate School (math 25% / reading 22%, grade F, #371 of 665 statewide, top 56%, 720 students, 0% FRL); Bradley-Bourbonnais C High School (math 15% / reading 24%, grade F, #397 of 693 statewide, top 61%, 1,921 students, 0% FRL).
- Market conditions: 86 active listings in the ZIP; 2 comparable units currently listed for rent nearby; solid renter incomes; 145 units permitted in Kankakee County in 2024 (5 in 5+ unit buildings).
- This rent runs 33% of the median local income ($86k/yr) — at the standard rent-burdened threshold; future hikes will face affordability resistance.
Forward outlook
- Local home prices are declining (-3.0%/yr); year-one equity from $1k of loan paydown is wiped out by about $6k of value loss. Plan a longer hold.
- Kankakee County population projected at -19% by 2050 — secular population decline; favor cash flow + early exit over multi-decade hold.
Negotiation context
- Only 5 days on market — expect competitive offers; lowballing is unlikely to land.
Risks & watch-outs
- Watch-outs: property tax is 2.6% of price.
Questions for the listing agent
- Built in 1976 — when were the roof, HVAC, electrical panel, plumbing, and water heater last replaced?
- Property tax is high relative to price — has the assessment been appealed recently, and will the sale trigger a re-assessment?
- Is there a deadline driving the sale (1031 exchange, divorce, estate, relocation)? That informs how much negotiation room exists.
- Schools are D-rated, which usually means shorter tenancies and higher turnover. Who's the typical renter profile here, and what's been the actual vacancy rate?
- What's the average days-on-market for RENTAL listings here right now (not sales)? A rising rental-DOM trend means longer vacancies and softer asking-rent achievability than the comps imply.
- What's the recent tenant-quality profile in this submarket — average credit score on applications, eviction rate, late-payment / NSF rate, and stable-employment percentage? A property-management company in the area should have these aggregated.
- How much new for-sale + rental construction is in the pipeline within 1–3 miles? Heavy new supply typically softens prices + rents 12–24 months out; constrained supply supports both.
Investment metrics
- 1% rule
- 1.15% ✓
- Cap rate
- 7.86%
- Cash-on-cash
- 5.59%
- DSCR
- 1.25
- GRM
- 7.2
CMA / ARV
- ARV (on-the-fly)
- $294,336
- Comps found
- 12
Show comp detail 12 sales within ~0.75 mi
| Address | Dist | Beds/Ba | Sqft | Sold | Price | $/sf | Match |
|---|---|---|---|---|---|---|---|
| 209 Meadows Rd S | 0.08mi | 4/2.0 | 1,677 (-4%) | 1mo | $280,000 | $167 | 86 |
| 1063 Yale Ave | 0.12mi | 4/2.0 | 1,830 (+4%) | 1mo | $260,000 | $142 | 84 |
| 269 Harvard Ave | 0.08mi | 3/2.0 (-1) | 1,665 (-5%) | 4mo | $259,900 | $156 | 78 |
| 434 Meadows Rd S | 0.22mi | 3/2.0 (-1) | 1,679 (-4%) | 1mo | $280,000 | $167 | 75 |
| 230 Curwick Dr | 0.15mi | 3/2.0 (-1) | 1,632 (-7%) | 1mo | $345,000 | $211 | 74 |
| 375 Meadows Rd N | 0.23mi | 3/2.0 (-1) | 1,616 (-8%) | 3mo | $272,000 | $168 | 66 |
| 206 Meadows Road South | 0.07mi | 4/3.0 | 2,000 (+14%) | 2mo | $351,000 | $176 | 66 |
| 180 Karen Dr | 0.66mi | 4/2.0 | 1,786 (+2%) | 1mo | $260,000 | $146 | 63 |
| 54 Bonds Dr | 0.72mi | 3/1.5 (-1) | 1,680 (-4%) | 1mo | $285,000 | $170 | 54 |
| 9 Hilltop Dr | 0.47mi | 4/1.5 | 1,997 (+14%) | 2mo | $224,000 | $112 | 53 |
| 675 Washington Ave | 0.54mi | 3/2.0 (-1) | 1,602 (-9%) | 2mo | $315,000 | $197 | 52 |
| 1565 Stefanie Ln | 0.69mi | 4/3.0 | 1,538 (-12%) | 2mo | $315,000 | $205 | 40 |
Match score weights: distance 35% · size 25% · config 20% · recency 20%. Top-matched comps best support the ARV.
Projected returns pro-forma
-3.0% appreciation · 3.0% rent growth · sell at horizon
- IRR
- -7.6%
- Equity multiple
- 0.72×
- Total profit
- $-16,115
- Equity at exit
- $30,715
- IRR
- 2.1%
- Equity multiple
- 1.15×
- Total profit
- $8,620
- Equity at exit
- $17,811
Cash invested: $57,680 (down + closing). Projections, not guarantees.
Landlord ↔ Tenant lean methodology
- Overall (STATE)
- 43 Moderately Tenant-Leaning
- State Illinois
- 43 Moderately Tenant-Leaning · D+7
- County
- — inherits STATE
- City
- — inherits STATE
ZIP-level market 60914
- Active inventory
- 86
- Price-to-rent
- 7.2×
Monthly cashflow live
- Estimated rent
- $2,379 medium interval (Pro) →
- Mortgage (P&I)
- −$1,080
- Tax from tax record
- −$445 /mo · $5,336/yr
- Insurance
- −$86
- HOA
- −$0
- Vacancy / Maint / Mgmt
- −$500
- Net cashflow
- $269
Break-even live
Sensitivity live
| Price | -10% $385 | -5% $327 | +0% $269 | +5% $210 | +10% $152 |
|---|---|---|---|---|---|
| Rent | -10% $81 | -5% $175 | +0% $269 | +5% $363 | +10% $457 |
| Rate | -1.0pp $372 | -0.5pp $321 | base $269 | +0.5pp $215 | +1.0pp $161 |
UW: 25.0% down · 7.5% · 30yr · 1.5% tax · 5.0% vac · 8.0% maint · 8.0% mgmt
Financing live
Cash to close
- Down payment
- $51,500
- Closing costs
- $6,180
- Reserves months
- —
- Total cash needed
- —
Loan-product check · same deal, 3 products live
Conventional
25% down · 7.5% · 30yr
- Down + closing
- —
- Monthly P&I
- —
- Monthly cashflow
- —
- DSCR
- —
- Eligible?
- —
Personal DTI + credit; lowest rate.
DSCR
20% down · 8.5% · 30yr
- Down + closing
- —
- Monthly P&I
- —
- Monthly cashflow
- —
- DSCR
- —
- Eligible?
- —
No personal income docs; deal must DSCR.
Hard money
10% down · 12.0% · 12mo
- Down + closing
- —
- Monthly P&I
- —
- Monthly cashflow
- —
- DSCR
- —
- Eligible?
- —
Short-term bridge; refi at stabilization.
Rent comps 2 comps
| Address | Beds | Baths | Sqft | Rent | $/sqft | DOM | Units | Dist |
|---|---|---|---|---|---|---|---|---|
| 655 Winston Dr Bourbonnais, IL | 4.0 | 2.5 | 2600 | $2,700 | $1.04 | 23d | 1 | 1.09mi |
| 495 W River St Bourbonnais, IL | 4.0 | 2.0 | 1715 | $2,300 | $1.34 | 18d | 1 | 1.44mi |
Listing history 5 events
-
2026-06-05statusdays on market $206,000 Pending 5 DOM
-
2026-06-02days on market $206,000 Active 3 DOM
-
2026-06-01days on market $206,000 Active 2 DOM
-
2026-05-31remarks 699-char remark
-
2026-05-31$206,000 Active 1 DOM
ⓘ Source: listings_history table (triggers on properties + properties_extension) + one-shot
backfill from property_details.listing_events for pre-trigger history.
Tax reassessment forecast IL · Partial reset (capped growth)
- Current annual tax
- $5,336 · $445/mo
- Projected year-2 tax
- $5,336 · $445/mo
- Expected delta
- $0/yr ($0/mo · 0.0%)
ⓘ Screening estimate from a state-policy table — verify with the county assessor before closing.
Climate risk First Street
- Flood 1/10 Low FEMA zone X (unshaded) · 0% chance over 30 yrs
- Wildfire 1/10 Low
- Heat 3/10 Moderate 7 d/yr ≥104°F today · 16 d/yr by 30 yrs out
- Wind 2/10 Low 100% chance of damaging wind over 30 yrs
- Air quality 2/10 Low 1 unhealthy d/yr today · 1 by 30 yrs out
Nearby sold comps map
Loading sold comps map…
Walkable amenities ~0.75 mi
Loading nearby amenities…
Taxation est. · year 1
- Rental income
- $28,549
- − Mortgage interest
- −$11,539
- − Property taxes
- −$5,336
- − Insurance
- −$1,030
- − Repairs & maintenance
- −$2,284
- − Management
- −$2,284
- − Depreciation
- −$5,993
- Taxable income
- $84
- Est. tax owed @ 24.0%
- −$20
- After-tax cash flow
- $3,205/yr
For passive investors: Depreciation is non-cash, so a rental often shows a tax loss while cash-flowing — sheltering income. Rental losses are passive: they offset passive income freely, and up to $25,000/yr can offset ordinary (W-2) income if you actively participate and your MAGI is under $100k (phasing out to $0 by $150k); unused losses carry forward. On sale, claimed depreciation is recaptured at up to 25%, and gains may owe capital-gains tax (a 1031 exchange can defer both). Figures are a year-1 estimate at your 24.0% rate — not tax advice; consult a CPA.
Schools (NCES district)
- District
- Bradley Bourbonnais Chsd 307
- NCES district ID
- 1706960
- Math proficiency
- 15% ▼ -6.00%
- Reading proficiency
- 24% ▼ -6.00%
- Median HH income
- $59,302
- Composite
- 18.35/100
- National rank
- #8945
- State rank
- #413 of 620 in IL
Livability — Bourbonnais
- Score
- 70/100
- State rank
- #362
- US rank
- #7487
Category grades
Schools grade is shown separately in the Schools card above.
Census & demographics
- Census place
- Bourbonnais, IL
- County
- Kankakee County · 61,801 people
- City population
- 28,673
- Metro
- Kankakee, IL
- Population (ZIP)
- 28,673
- Household income
- $86,223
- Rent vs Own
- Severe rent burden
- 590.0
Population outlook (Kankakee County) Hauer SSP2
- Today (2025)
- 105,479 people
- By 2030
- 101,792 · -3.5%
- By 2040
- 93,479 · -11.4%
- By 2050
- 85,061 · -19.4%
- By 2075
- 67,314 · -36.2%
- By 2100
- 52,439 · -50.3%
Race, ethnicity, and origin ACS 2023
- Neighborhood character
- Predominantly White (76%)
- Race & ethnicity
- White 76% Black 10% Hispanic / Latino 7% Two or more races 6% Asian 3%
- Hispanic origin (detail)
- Mexican 4%
- Common ancestry
- Lithuanian 7% Romanian 6% Iranian 2%
- Foreign-born
- 4% · Canada, South Korea
- Languages at home
- 93% English-only · Spanish 4% Tagalog/Filipino 1%
Political lean MEDSL · Kankakee
- 2024 margin
- Strong R (+20.8) · D 38.7% · R 59.5% · Other 1.8%
- 2008→2024 swing
- -25.4pp toward R · 2008: 4.6pp · 2024: -20.8pp
- All cycles
- 2024: R+20.8 2020: R+16.5 2016: R+13.3 2012: R+3.4 2008: D+4.6
Not yet ingested
- Civics
- —
Market trends
- HPI YoY
- ▼ -106.62%
- Current HPI
- 175.0777
- Rent YoY
- —
- Metro
- Kankakee, IL
- State GDP YoY
- ▲ 1.59%
- F500 in state
- 60
Industry mix (Fortune 500 HQ in IL)
| Industry | F500 HQs | Revenue |
|---|---|---|
| Insurance | 4 | $201B |
|
||
| Consumer Goods | 4 | $87B |
|
||
| Industrial Machinery | 3 | $64B |
|
||
| Healthcare | 2 | $55B |
|
||
| Retail / Pharmacy | 1 | $148B |
|
||
| Agriculture / Food | 1 | $86B |
|
||
Price history
1 event — show timeline
- 2026-05-30 Listed $206,000 MRED as Distributed by MLS Grid
Property tax history
+3.9%/yrLatest (2024): $5,336 · +10.2% YoY. Source: county tax records.
Cash-flow waterfall
monthlySold comps — $/sqft
last 12 mo · ≤1 miLoading sold comps…